. 2021 May 10;3(1):36.
doi: 10.1186/s42523-021-00098-0.

The microbiota of healthy dogs demonstrates individualized responses to synbiotic supplementation in a randomized controlled trial

Affiliations

The microbiota of healthy dogs demonstrates individualized responses to synbiotic supplementation in a randomized controlled trial

Jirayu Tanprasertsuk et al. Anim Microbiome. .

Abstract

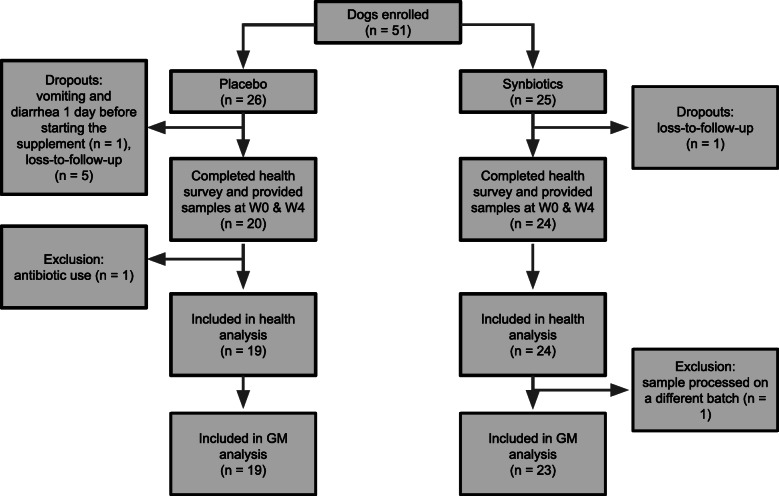
Background: Probiotics have been demonstrated to ameliorate clinical signs of gastrointestinal diseases in dogs in various studies. However, the effect of probiotics in a healthy population, as well as factors contributing individualized responses, remain largely unknown. This trial examined gut microbiota (GM) and health outcomes in household dogs after synbiotic (SN) supplementation containing probiotics and inulin (a prebiotic). Healthy dogs were randomized to receive SN (50 mg/d inulin and 20 billion total CFU/d of L. reuteri, P. acidilactici, E. faecium, L. acidophilus, B. animalis, L. fermentum, L. rhamnosus) or placebo (PL) for 4 weeks. Owners completed a health survey and collected stool samples for GM profiling (shotgun metagenomic sequencing) at baseline and week 4 in both groups, and at week 6 in the SN group.

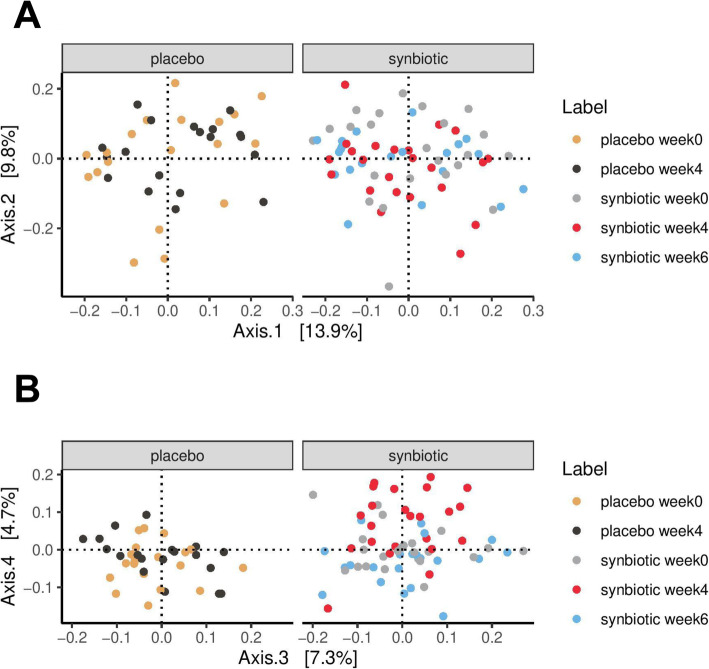
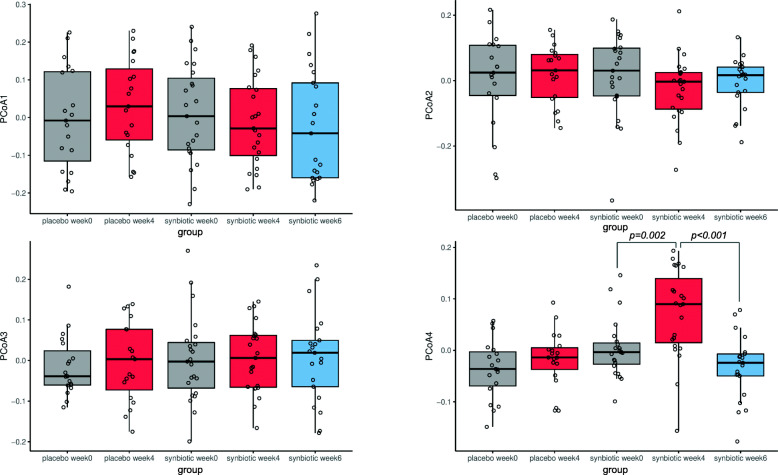
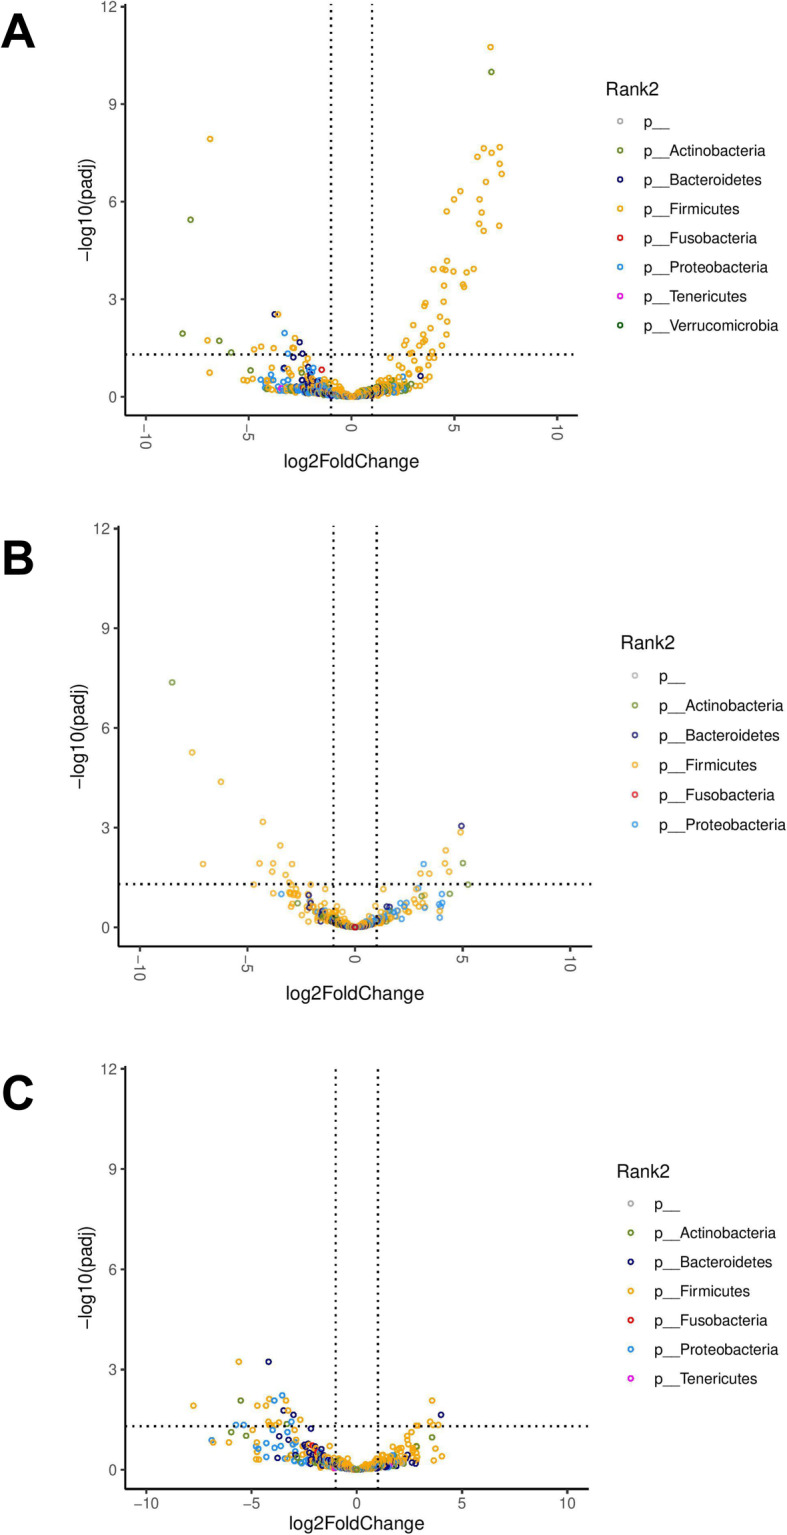
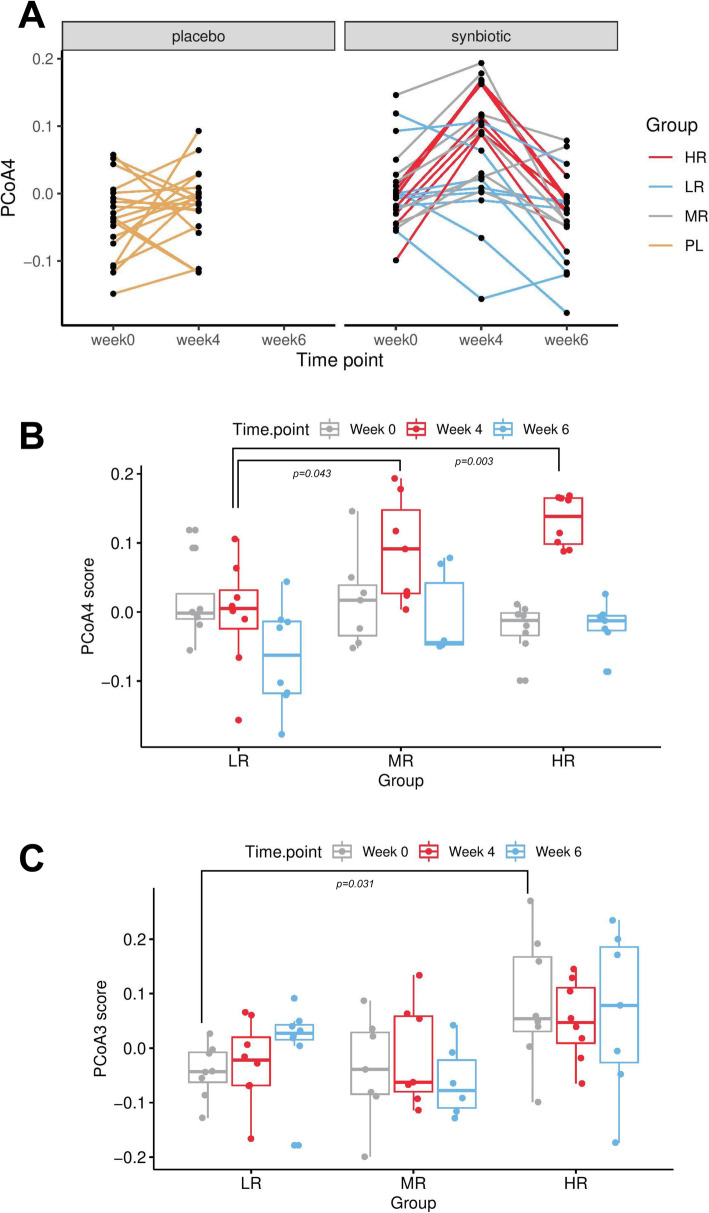
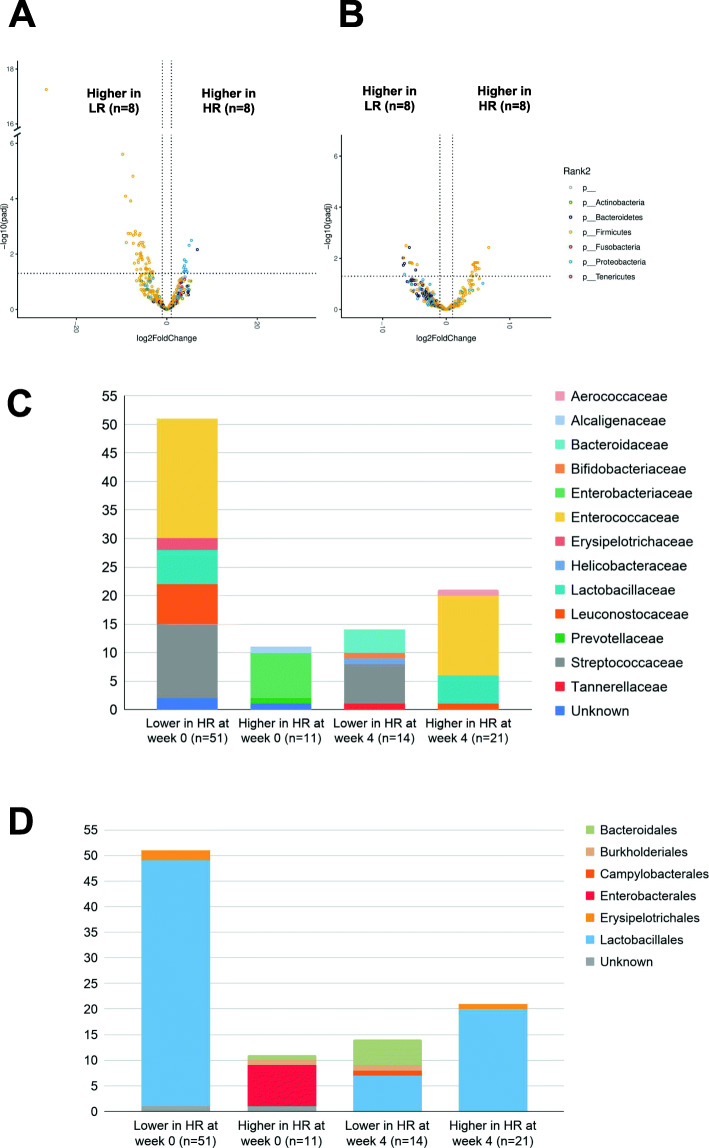
Results: A significant shift (p < 0.001) in β-diversity was observed in the SN (n = 24), but not PL group (n = 19), at week 4 relative to baseline. Forty-five bacterial species, 43 (96%) of which were Lactobacillales, showed an increase in the relative abundances (≥2 fold change, adjusted p < 0.05) in the SN group at week 4. E. coli also decreased at week 4 in the SN group (2.8-fold, adjusted p < 0.01). The altered taxa largely returned to baseline at week 6. The degree of changes in β-diversity was associated with GM at baseline. Specifically, dogs with higher Proteobacteria and lower Lactobacillales responded more robustly to supplementation in terms of the change in β-diversity. Dogs fed SN tended to have lower diarrhea incidence (0% vs 16%, p = 0.08).

Conclusions: SN supplement had a short-term impact on the gut microbiota in healthy household dogs as characterized by shotgun metagenomic sequencing. Findings warrant further investigation with longer duration and populations at risk of gastrointestinal diseases. The magnitude of response to the supplement was associated with microbial profile at baseline. To our knowledge, this is the first study documenting such association and may provide a basis for personalized nutrition in companion dogs.

Keywords: Diarrhea; Dogs; Gastrointestinal health; Inulin; Microbiome; Probiotics; Synbiotics.


Conflict of interest statement

JT, JS, RBJ, LMP, RWH are employees of and/or hold stocks or stock options in NomNomNow Inc. ARJ and HM are contracted by NomNomNow Inc. as consultants.

Figures

Fig. 1
Fig. 1
Trial flowchart
Fig. 2
Fig. 2
Principal coordinate analysis (PCoA) plot. a PCoA1 (Axis 1) and PCoA2 (Axis 2) respectively explained 13.9 and 9.8% of the variance of the abundance of gut microbiota at the species level (105 samples from 42 dogs). PERMANOVA using Bray-Curtis distance showed no spatial separation among groups (placebo and probiotics) or timepoints (weeks 0, 4, 6) based on PCoA1 and PCoA2 scores. b PCoA3 (Axis 3) and PCoA4 (Axis 4) respectively explained 7.3 and 4.7% of the variance of the abundance of gut microbiota at the species level
Fig. 3
Fig. 3
Scores of the first 4 PCoA axes in subjects receiving synbiotic (SN, n = 23) or placebo (PL, n = 19) at weeks 0, 4, and 6. PCoA4 score in the synbiotic group at week 4 was significantly different from that at week 0 (adjusted p = 0.002) and week 6 (adjusted p < 0.001). P value adjustment for pairwise comparisons was performed with the Benjamini Hochberg method
Fig. 4
Fig. 4
Volcano plots demonstrating the fold-change (FC) in the differential abundance analysis of gut bacteria at the species level (a) at week 4 compared to week 0 in the synbiotic group (n = 23); b at week 4 compared to week 0 in the placebo group (n = 19); and c at week 6 compared to week 0 in the synbiotic group (n = 21). Vertical dashed lines show log2FC at 1 and − 1 (i.e. FC at 2 and − 2). Horizontal dashed line shows -log10(adjusted p) = 2 (i.e. adjusted p = 0.01). Each point represents a different species and points are colored by phylum
Fig. 5
Fig. 5
Varying degrees of PCoA4 changes from week 0 to week 4 were observed among subjects receiving the synbiotic supplement. a PCoA4 score at week 4 increased in 20 dogs (87%) as compared to baseline in the synbiotic group, while the direction of change was less consistent in the placebo (PL) group - increased in 11 dogs (58%) and decreased in 8 dogs (42%). Subjects in the synbiotic group were divided into tertiles based on the degree of PCoA4 changes between week 0 and week 4, with subjects in the first tertile labeled high-responders (HR, maximal PCoA4 score increase, n = 8), those in the second tertile mid-responders (MR, n = 7), and those in the third tertile low-responders (LR, PCoA4 score decrease or minimal PCoA4 score increase, n = 8). b PCoA4 scores at week 4 were significantly higher in HR (0.132 ± 0.037, FDR-adjusted p = 0.003, pairwise Wilcoxon rank sum test) and MR (0.091 ± 0.076, FDR-adjusted p = 0.043) as compared to LR (−0.004 ± 0.080). c PCoA3 scores were significantly higher in HR (0.084 ± 0.117) than LR (−0.043 ± 0.049) but not MR (− 0.038 ± 0.096) at baseline (FDR-adjusted p = 0.031, Kruskal-Wallis test). PCoA3 scores were not significantly different among groups at week 4 or week 6
Fig. 6
Fig. 6
Volcano plots demonstrating fold-change (FC) in the differential abundance analysis of gut bacteria between HR (high-responders, n = 8) and LR (low-responders, n = 8) among dogs receiving the probiotics at a week 0 and b week 4. Each point represents a different species and points are colored by phylum. Numbers of taxa with significantly different abundances are shown at c the family level and d the order level

Similar articles

Cited by

References

    1. Sanders ME, Merenstein DJ, Reid G, Gibson GR, Rastall RA. Probiotics and prebiotics in intestinal health and disease: from biology to the clinic. Nat Rev Gastroenterol Hepatol. 2019;16(10):605–616. doi: 10.1038/s41575-019-0173-3. - DOI - PubMed
    1. Monteagudo-Mera A, Rastall RA, Gibson GR, Charalampopoulos D, Chatzifragkou A. Adhesion mechanisms mediated by probiotics and prebiotics and their potential impact on human health. Appl Microbiol Biotechnol. 2019;103(16):6463–6472. doi: 10.1007/s00253-019-09978-7. - DOI - PMC - PubMed
    1. Pilla R, Suchodolski JS. The role of the canine gut microbiome and Metabolome in health and gastrointestinal disease. Front Vet Sci. 2019;6:498. doi: 10.3389/fvets.2019.00498. - DOI - PMC - PubMed
    1. Swanson KS, Dowd SE, Suchodolski JS, Middelbos IS, Vester BM, Barry KA, Nelson KE, Torralba M, Henrissat B, Coutinho PM, Cann IKO, White BA, Fahey GC., Jr Phylogenetic and gene-centric metagenomics of the canine intestinal microbiome reveals similarities with humans and mice. ISME J. 2011;5(4):639–649. doi: 10.1038/ismej.2010.162. - DOI - PMC - PubMed
    1. Coelho LP, Kultima JR, Costea PI, Fournier C, Pan Y, Czarnecki-Maulden G, Hayward MR, Forslund SK, Schmidt TSB, Descombes P, Jackson JR, Li Q, Bork P. Similarity of the dog and human gut microbiomes in gene content and response to diet. Microbiome. 2018;6(1):72. doi: 10.1186/s40168-018-0450-3. - DOI - PMC - PubMed

LinkOut - more resources