. 2021 Oct;11(10):2506-2523.
doi: 10.1158/2159-8290.CD-20-1285. Epub 2021 May 10.

Resolving the Spatial and Cellular Architecture of Lung Adenocarcinoma by Multiregion Single-Cell Sequencing

Affiliations

Resolving the Spatial and Cellular Architecture of Lung Adenocarcinoma by Multiregion Single-Cell Sequencing

Ansam Sinjab et al. Cancer Discov. 2021 Oct.

Abstract

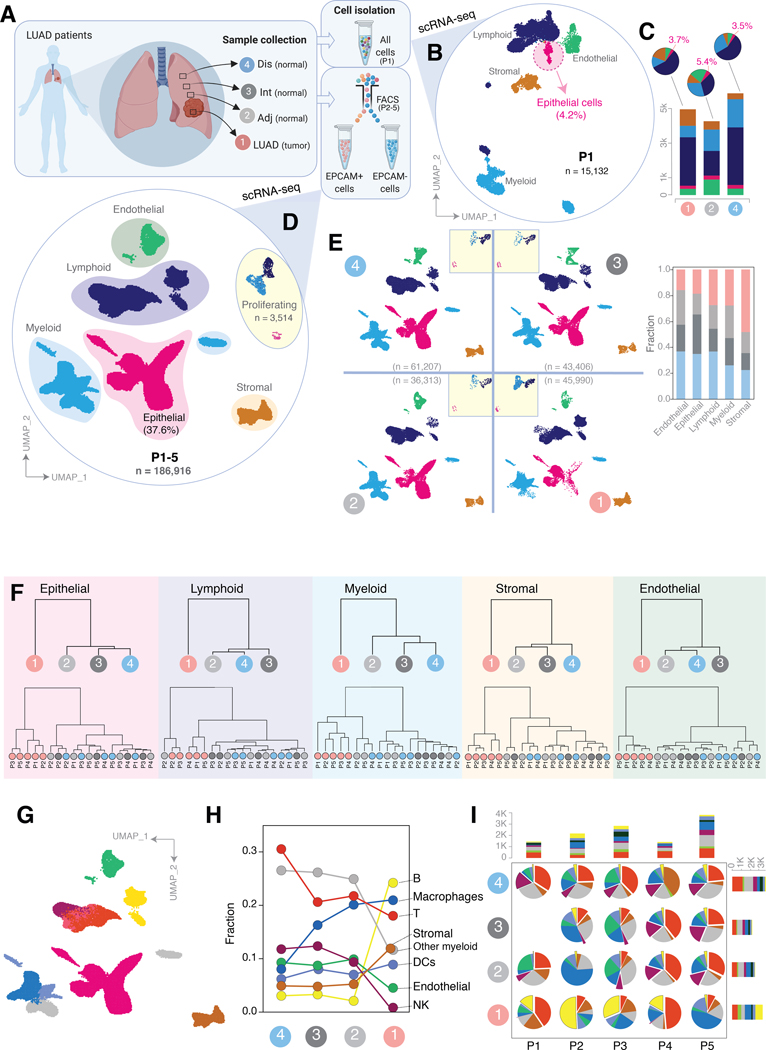
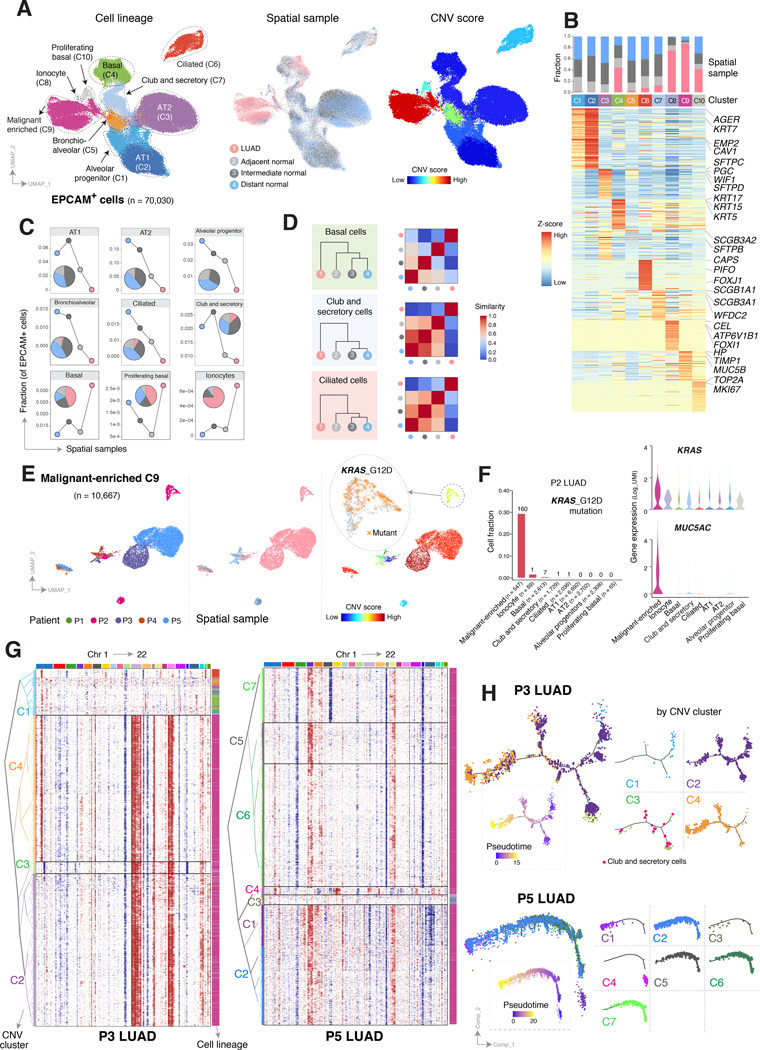
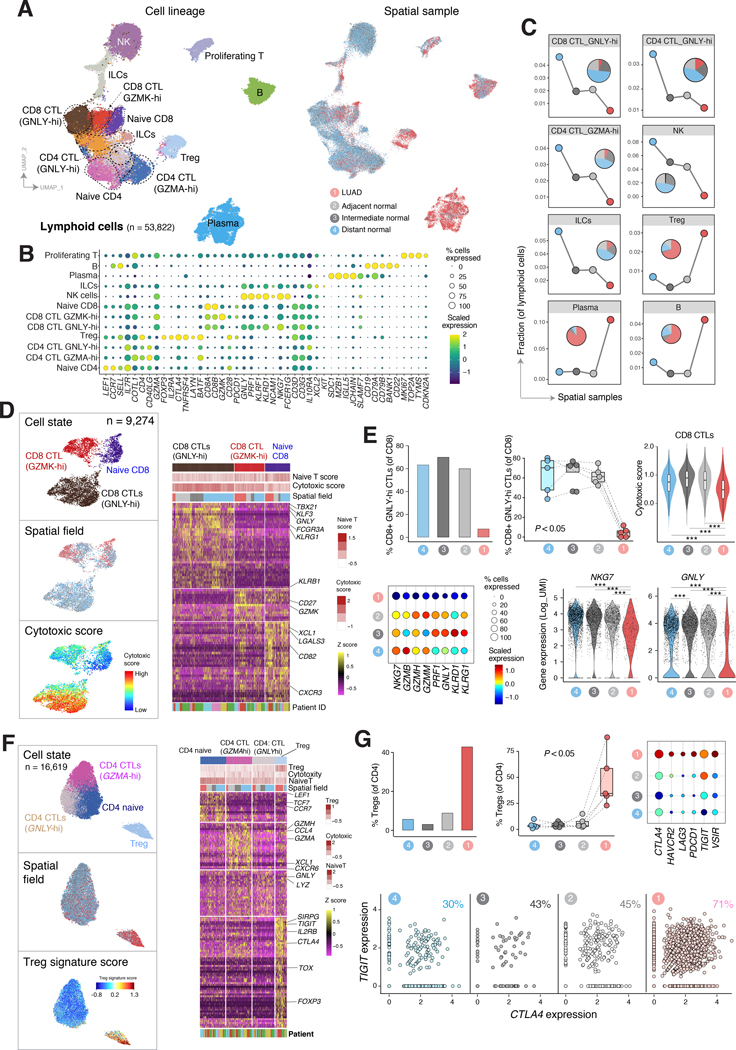
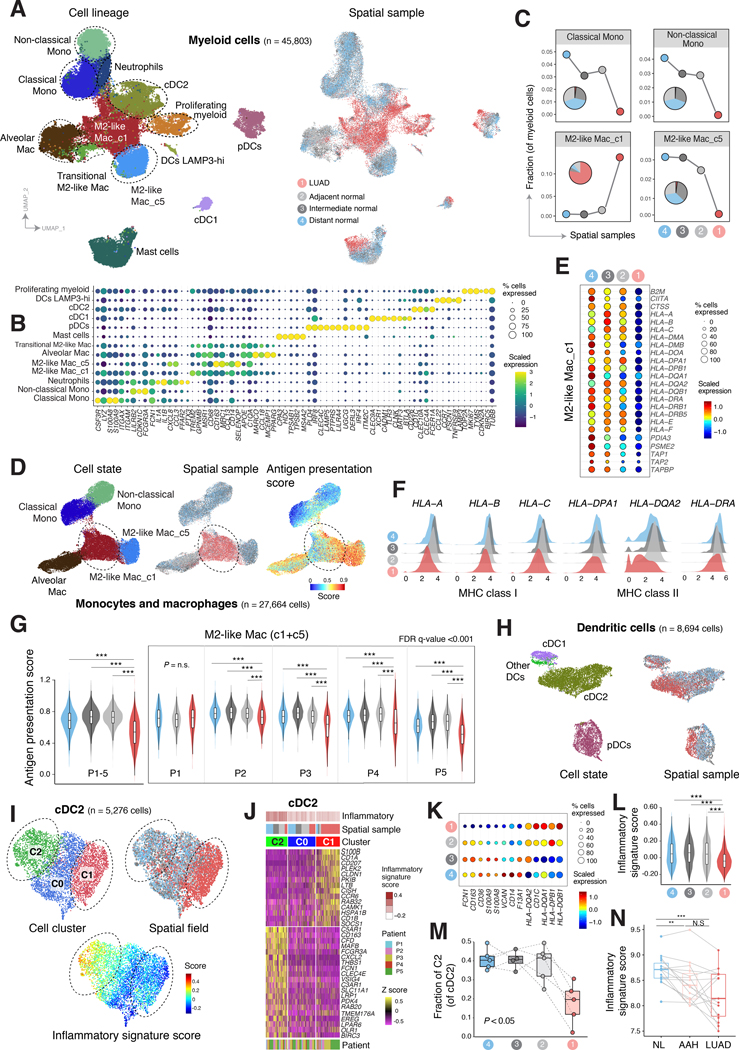
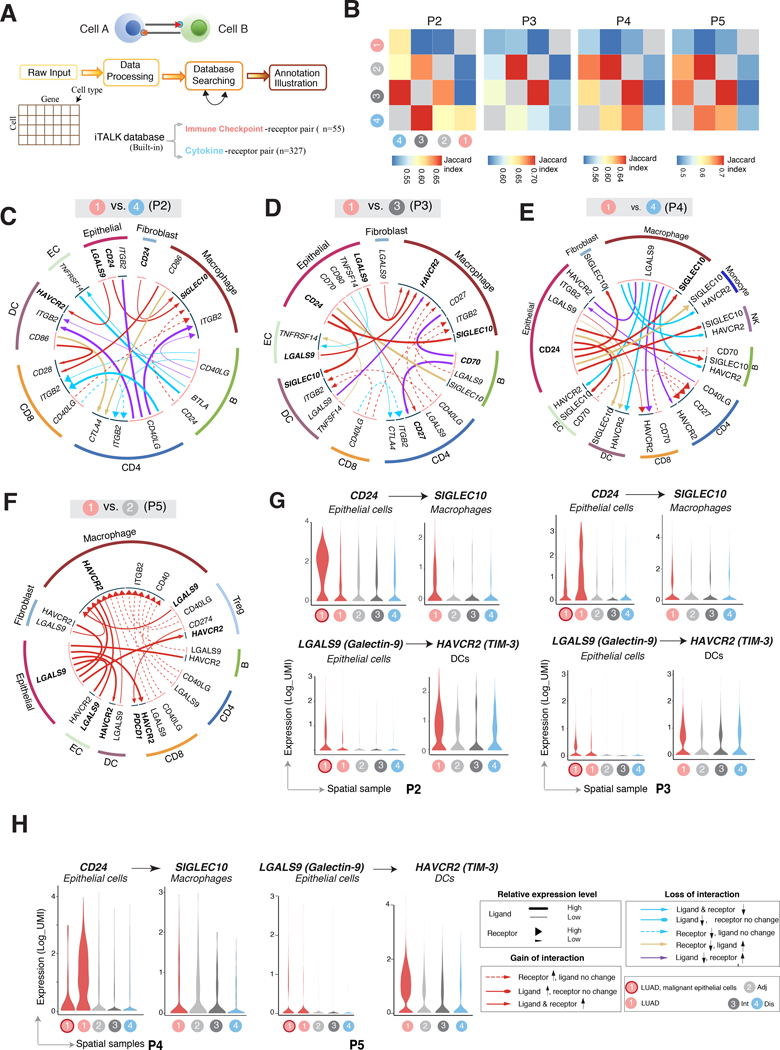
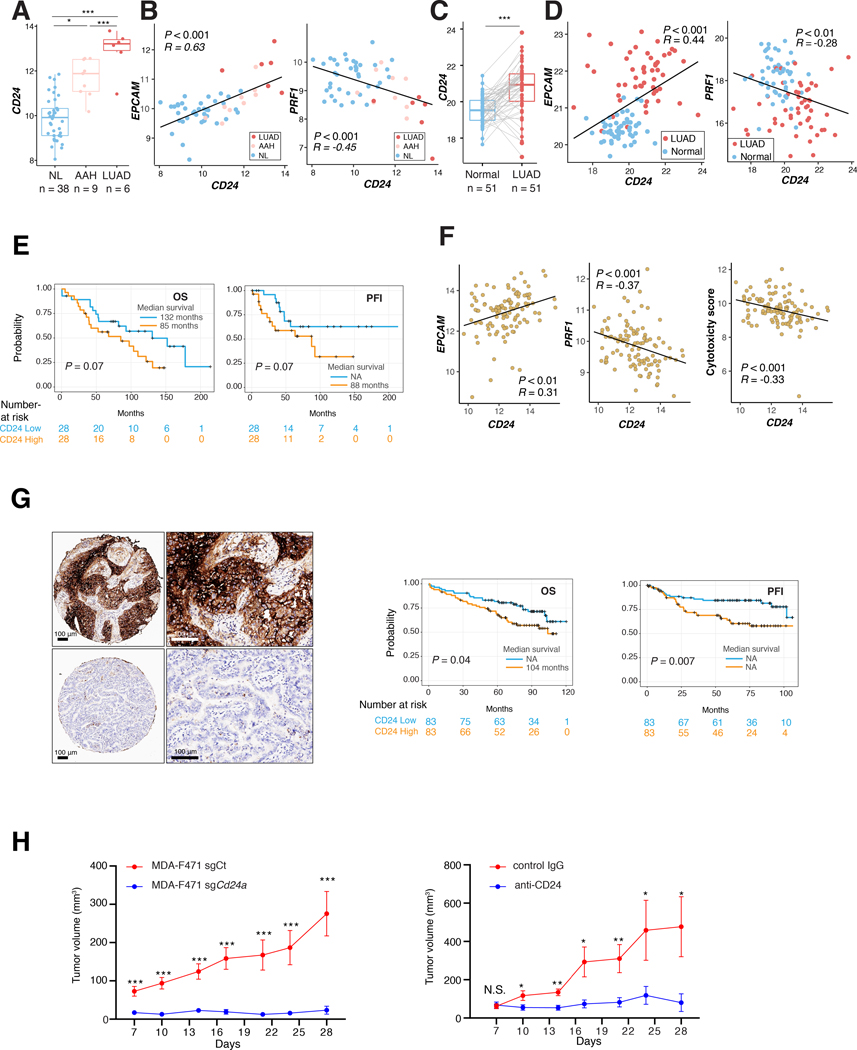
Little is known of the geospatial architecture of individual cell populations in lung adenocarcinoma (LUAD) evolution. Here, we perform single-cell RNA sequencing of 186,916 cells from five early-stage LUADs and 14 multiregion normal lung tissues of defined spatial proximities from the tumors. We show that cellular lineages, states, and transcriptomic features geospatially evolve across normal regions to LUADs. LUADs also exhibit pronounced intratumor cell heterogeneity within single sites and transcriptional lineage-plasticity programs. T regulatory cell phenotypes are increased in normal tissues with proximity to LUAD, in contrast to diminished signatures and fractions of cytotoxic CD8+ T cells, antigen-presenting macrophages, and inflammatory dendritic cells. We further find that the LUAD ligand-receptor interactome harbors increased expression of epithelial CD24, which mediates protumor phenotypes. These data provide a spatial atlas of LUAD evolution, and a resource for identification of targets for its treatment. SIGNIFICANCE: The geospatial ecosystem of the peripheral lung and early-stage LUAD is not known. Our multiregion single-cell sequencing analyses unravel cell populations, states, and phenotypes in the spatial and ecologic evolution of LUAD from the lung that comprise high-potential targets for early interception.This article is highlighted in the In This Issue feature, p. 2355.


Figures

Figure 1.
Figure 1.. Dissecting early-stage LUAD and the peripheral lung ecosystem by multi-region single-cell RNA sequencing.
A, Workflow showing multi-region sampling strategy of 5 LUADs and 14 spatially defined normal lung tissues for analysis by scRNA-seq. Dis, distant normal; Int, intermediate normal; Adj, adjacent normal; LUAD, tumor tissue. B, Uniform manifold approximation and projection (UMAP) embedding of cells from tumor, adjacent normal and distant normal samples of patient one (P1). Cells are colored by their inferred cell types. C, Cell composition in absolute cell numbers (stacked bar plots) and relative fractions (pie charts) in each spatial sample derived from P1. D, UMAP view of cells from all 5 patients, including EPCAM+ and EPCAM- pre-enriched cells from P2-P5. Colors represent assigned major cell types. Proliferating, proliferating cells. E, UMAP view of cell types and their fractions (stacked bar plot) by spatial samples. Clusters in embedded squares represent proliferating cells. Colors represent assigned cell types as in panel D. F, Dendrograms showing hierarchical relationships of cells among the spatial samples based on the computed Euclidean distance using transcriptomic features. Dendrograms are shown for 5 major cell types (from left to right), for all patients together (top) and by patient (bottom). G, Same UMAP as in panel D, with further subclustering of lymphoid and myeloid cells. Colors correspond to the cell type annotation in panel H for EPCAM- cells. H-I, Line plot showing changes in the relative fractions among the EPCAM negative subsets across spatial samples for all patients together (H) and by patient (pie charts, I). Stacked bar plots in panel I show absolute cell numbers of the fractions by patient and spatial sample.
Figure 2.
Figure 2.. Epithelial lineage diversity and intratumoral heterogeneity in the spatial ecosystem of early-stage LUAD.
A, UMAP visualization of all EPCAM+ cells from P1-P5 colored (from left to right) by their assigned cell types, spatial samples, and inferred copy number variation (CNV) scores. B, Heatmap of major lineage marker genes for EPCAM+ cell clusters (C1–10 as shown in panel A, left), with corresponding bar blots outlining fraction by spatial sample. C, Area plot showing changes in EPCAM+ subset fractions across spatial samples. D, Hierarchical relationships of 3 representative subsets of epithelial cells (from top to bottom) among the spatial samples based on the computed Euclidean distance using transcriptomic features (left), and corresponding heatmaps quantifying similarity levels among spatial samples (right). Similarity score is defined as one minus the Euclidean distance. E, UMAP plots of cells in the malignant-enriched cluster C9 (panel A), colored by their corresponding patient origin (left), spatial sample (middle), and CNV score (right). The zoom in view of the right panel shows KRAS G12D mutant cells in P2. F, Fraction of cells carrying KRAS G12D mutation (left bar plot), with numbers indicating the absolute cell numbers, as well as expression levels of KRAS (violin plot, top right) and MUC5AC (violin plot, bottom right), within cells of each epithelial lineage cluster of P2. G, Unsupervised clustering of CNV profiles inferred from scRNA-seq data from patient P3 (left) and P5 (right) tumor samples using NK cells as control and demonstrating intratumoral heterogeneity in CNV profiles. Chromosomal amplifications (red) and deletions (blue) are inferred for all 22 chromosomes (color bars on the top). Each row represents a single cell, with corresponding cell type annotated on the right (same as in panel A). H, Potential developmental trajectories for EPCAM+ cells from P3 (top) and P5 (bottom) inferred by Monocle 3 analysis. Cells on the tree are colored by pseudotime (dotted boxes) and CNV clusters.
Figure 3.
Figure 3.. Spatial reprogramming of lymphoid subsets towards protumor phenotypes in early-stage LUAD.
A, UMAP visualization of lymphoid cell subsets from P1-P5 colored by cell lineage (left) and spatial sample (right). CTL, cytotoxic T lymphocyte; Treg, T regulatory cell; ILC, innate lymphoid cell; NK, natural killer cell. B, Bubble plot showing the expression of lineage markers. Both the fraction of cells expressing signature genes (indicated by the size of the circle) as well as their scaled expression levels (indicated by the color of the circle) are shown. C, Changes in the abundance of lymphoid cell lineages and cellular states across the LUADs and spatial normal samples. Embedded pie charts show the contribution of each spatial sample to the indicated cell subtype/state. D, UMAP plots of CD8+ T lymphocytes colored by cell states (top), spatial sample (middle), and cytotoxic score (bottom). The heatmap on the right shows normalized expression of marker genes for defined CD8 T cell subsets. Each column represents a cell. Top annotation tracks indicate (from top to bottom) cell states, naïve T cell scores and cytotoxic scores calculated using curated gene signatures, and the corresponding spatial sample of each cell. E, Depletion of CD8+ GNLY-hi CTLs in the tumor microenvironment (TME) of LUADs. Bar plot (top left) and boxplot (top middle) showing percentage of CD8+ GNLY-hi CTLs among total CD8+ cells from all patients across the spatial sample. Each circle in the boxplot represents a patient sample. P – value was calculated using Kruskal-Wallis test. Cytotoxicity signature score (violin plot, top right) of CD8+ CTLs across spatial samples (***, P < 0.001). The percentage of CD8+ CTLs expressing cytotoxic signature genes (indicated by the size of the circle) and their scaled expression levels (indicated by the color of the circle) across the LUADs and spatial normal lung samples (bubble plot, bottom left). Expression levels of NKG7 and GNLY in CD8+ CTLs across the spatial samples (violin plots, bottom right; ***, P < 0.001). P – values from pairwise comparisons were calculated using Wilcoxon rank sum test and values from examining spatial patterns through multiple comparisons were obtained using Kruskal-Wallis test. F, UMAP plots of CD4+ T lymphocytes colored by cell states (top), spatial sample (middle), and Treg signature score (bottom). The heatmap on the right shows normalized expression of marker genes for CD4+ T cells grouped by defined subcluster. Each column represents a cell. Top annotation tracks indicate (from top to bottom) cell states, Treg signature score, cytotoxic scores, and naïve T cell score calculated using curated gene signatures, and the corresponding spatial sample of each cell. G, Enrichment of CD4+ T regulatory cells (Treg) in the TME of LUADs. Bar plot (top left) and boxplot (top middle) showing percentage of CD4+ Tregs among total CD4+ cells from all patients across the spatial samples. Each circle in the boxplot represents a patient sample. P – value was calculated using Kruskal-Wallis test. Percentage of CD4+ Tregs expressing inhibitory immune checkpoint genes (indicated by the size of the circle) and their scaled expression levels (indicated by the color of the circle, color assignment same as panel E) across the spatial samples (bubble plot, top right). Frequency of CD4+ Treg cells co-expressing CTLA4 and TIGIT immune checkpoints across the spatial samples (scatter plots, bottom). The fractions of CTLA4+TIGIT+ Tregs are labeled on each plot.
Figure 4.
Figure 4.. Reduced signatures of antigen presentation and inflammatory dendritic cells in the microenvironment of early-stage LUAD.
A, UMAP visualization of myeloid cell lineages colored by cell type/state (left) and the spatial samples (right). Mac, macrophages; Mono, monocytes; DC, dendritic cell; cDC, classical dendritic cell; pDC, plasmacytoid dendritic cell. B, Bubble plot showing the percentage of myeloid cells expressing lineage specific marker genes (indicated by the size of the circle) as well as their scaled expression levels (indicated by the color of the circle). C, Changes in the abundance of myeloid cell subsets across the LUADs and spatial normal lung samples. Embedded pie charts show the contribution of each spatial sample to the indicated cell subtype/state. D, UMAP plot of monocyte and macrophage subpopulations, color coded by cell type/state (left), spatial sample (middle), and antigen presentation score (right). E, Percentage of M2-like macrophages cluster 1 expressing antigen presentation genes (indicated by the size of the circle) and their scaled expression levels (indicated by the color of the circle) across the spatial samples (bubble plot). F, Ridge plots showing the distribution of MHC class I and MHC class II gene expression densities in M2-like macrophages cluster 1, and across LUADs and spatial normal lung samples. G, Violin plots showing the antigen presentation score in M2-like macrophages (clusters 1 and 5) across LUADs and spatial normal lung samples for all patients together (left) and within patients (right) (***, P < 0.001, N.S, P > 0.05). P – values were calculated by Wilcoxon rank sum test. H, UMAP plots of dendritic cells, color coded by cell state (left) and spatial sample (right). I, UMAP plots showing unsupervised subclustering of cDC2 cells colored by cluster ID (top left), spatial sample (top right) and the computed inflammatory signature score (bottom). J, Heatmap showing normalized expression of marker genes of cDC2 cell subsets. The top annotation tracks indicate (from top to bottom) the inflammatory signature scores, spatial tissue of origin, and cDC2 cell clusters. K, Bubble plot showing the percentage of cDC2 cells expressing inflammatory and non-inflammatory signature genes (indicated by the size of the circle) as well as their scaled expression levels (indicated by the color of the circle) in the LUADs and spatial normal lung tissues. L, Violin plot showing expression of inflammatory signature score in cells from cDC2 cluster C2 in the TME of LUADs. P – value was calculated using Kruskal-Wallis test (***, P < 0.001; N.S, P > 0.05). M, Boxplot showing fraction of cDC2 C2 cells among total cDC2 cells and across the LUADs and spatial normal lung tissues. Individual circles correspond to patient samples. P – value was calculated using Kruskal-Wallis test. N, Boxplot showing the inflammatory signature score in normal lung (NL), in premalignant atypical adenomatous hyperplasia (AAH) and in LUAD from an independent cohort (**, P < 0.01; ***, P < 0.001; N.S, P > 0.05 of the Wilcoxon rank sum test).”
Figure 5.
Figure 5.. Enriched ligand-receptor cell-cell communication networks between LUADs and their immune microenvironment.
A, Computational analysis workflow of cell-cell communication using iTALK to identify, from a database of curated ligand-receptor (L-R) pairs, the highly expressed immune checkpoint- and cytokine-receptor pairs, that are significantly and differentially altered (i.e., interactions lost or gained) between LUADs and spatial normal lung tissues. B, Heatmaps showing the overlap (quantified by Jaccard index) of predicted ligand-receptor based interactions among individual LUADs and their corresponding spatially distributed normal lung tissues. C-F, Representative circos plots showing details of immune checkpoint-mediated L-R pairs compared between each of the LUADs of patients 2 (C), 3 (D), 4 (E) and 5 (F), and selected matching spatial normal lung samples. G-H, Violin plots showing expression of the ligand and receptor genes (selected from panels C-F) involving immune checkpoints and showing spatial gain-of-interaction patterns as highlighted in circus plots for patient 2 (panel G left), 3 (panel G right), 4 (panel H left) and 5 (panel H right).
Figure 6.
Figure 6.. Pro-tumor phenotypes associated with augmented CD24 in LUAD.
A, Boxplot showing CD24 expression levels in an independent cohort of normal lung tissues (NL), premalignant atypical adenomatous hyperplasias (AAH) and LUADs assessed using the Nanostring immune Counter panel (see Supplementary Methods) (*, P < 0.05; **, P < 0.01; ***, P < 0.001 of the Wilcoxon rank sum test). B, Scatterplots using Pearson correlation coefficients between levels of CD24 with EPCAM and PRF1 in the NL, AAH, and LUAD samples. C, Boxplot depicting CD24 expression levels in LUADs and matched normal lung (NL) tissues from TCGA LUAD cohort (***, P < 0.001 of the Wilcoxon rank sum test). D, Scatter plots showing correlation of expression using Pearson’s correlation coefficients between CD24 and EPCAM or PRF1. E, Overall survival (OS) and progression-free interval (PFI) in a subset of early-stage LUAD patients analyzed by targeted immune profiling (MDACC cohort) and dichotomized by median CD24 mRNA expression (CD24 low n = 28 and high n= 28). Survival analysis was performed using Kaplan–Meier estimates and two-sided log-rank tests. F, Scatter plots showing correlation of expression using Pearson’s correlation coefficients between CD24 and EPCAM, PRF1 or cytotoxicity score in MDACC cohort. Cytotoxicity score was calculated as the square root of the product of GZMB and PRF1 expression. G, Representative images showing relatively high (top) and low (bottom) immunohistochemical CD24 staining (left). Scale bar = 100 μm. OS (middle) and PFI (right) analysis in the early-stage LUAD TMA. Patients were dichotomized based on median CD24 protein expression (CD24 low n = 83 and high n = 83). The analysis was performed with the Kaplan–Meier estimates and two-sided log-rank tests. H, In vivo growth of MDA-F471 cells subcutaneously implanted into syngeneic mice. Lengths and widths of tumors were measured twice per week for 3 weeks and tumor volumes were calculated according to the formula (length x width2)/2, and tumor growth was plotted as mean ± SEM. Mice in the left panel were implanted with MDA-F471 sgCt or MDA-F471 sgCd24a cells following FACS-sorting for high or low expression of CD24 surface protein, respectively. Mice in the right panel were implanted with parental MDA-F471 cells and treated with either control IgG or anti-CD24 antibody at the indicated timepoints (*, P < 0.05; **, P < 0.01; ***, P < 0.001; unpaired Student’s t test).

References

    1. Siegel RL, Miller KD, Jemal A. Cancer statistics, 2018. CA: a cancer journal for clinicians 2018;68(1):7–30 doi 10.3322/caac.21442. - DOI - PubMed
    1. Goldstraw P, Ball D, Jett JR, Le Chevalier T, Lim E, Nicholson AG, et al.Non-small-cell lung cancer. Lancet (London, England) 2011;378(9804):1727–40 doi 10.1016/s0140-6736(10)62101-0. - DOI - PubMed
    1. Aberle DR, Adams AM, Berg CD, Black WC, Clapp JD, Fagerstrom RM, et al.Reduced lung-cancer mortality with low-dose computed tomographic screening. The New England journal of medicine 2011;365(5):395–409 doi 10.1056/NEJMoa1102873. - DOI - PMC - PubMed
    1. Abbosh C, Venkatesan S, Janes SM, Fitzgerald RC, Swanton C. Evolutionary dynamics in pre-invasive neoplasia. Current opinion in systems biology 2017;2:1–8 doi 10.1016/j.coisb.2017.02.009. - DOI - PMC - PubMed
    1. Saab S, Zalzale H, Rahal Z, Khalifeh Y, Sinjab A, Kadara H. Insights Into Lung Cancer Immune-Based Biology, Prevention, and Treatment. Front Immunol 2020;11:159 doi 10.3389/fimmu.2020.00159. - DOI - PMC - PubMed

Publication types