. 2021 Jul 23;41(8):e0014921.
doi: 10.1128/MCB.00149-21. Epub 2021 Jul 23.

Erf Affects Commitment and Differentiation of Osteoprogenitor Cells in Cranial Sutures via the Retinoic Acid Pathway

Affiliations

Erf Affects Commitment and Differentiation of Osteoprogenitor Cells in Cranial Sutures via the Retinoic Acid Pathway

Angeliki Vogiatzi et al. Mol Cell Biol. .

Abstract

ETS2 repressor factor (ERF) haploinsufficiency causes late-onset craniosynostosis (CRS) (OMIM entry 600775; CRS4) in humans, while in mice Erf insufficiency also leads to a similar multisuture synostosis phenotype preceded by mildly reduced calvarium ossification. However, neither the cell types affected nor the effects per se have been identified so far. Here, we establish an ex vivo system for the expansion of suture-derived mesenchymal stem and progenitor cells (sdMSCs) and analyze the role of Erf levels in their differentiation. Cellular data suggest that Erf insufficiency specifically decreases osteogenic differentiation of sdMSCs, resulting in the initially delayed mineralization of the calvarium. Transcriptome analysis indicates that Erf is required for efficient osteogenic lineage commitment of sdMSCs. Elevated retinoic acid catabolism due to increased levels of the cytochrome P450 superfamily member Cyp26b1 as a result of decreased Erf levels appears to be the underlying mechanism leading to defective differentiation. Exogenous addition of retinoic acid can rescue the osteogenic differentiation defect, suggesting that Erf affects cranial bone mineralization during skull development through retinoic acid gradient regulation.

Keywords: Ets transcription factors; craniosynostosis; mesenchymal stem cells; retinoic acid.


Figures
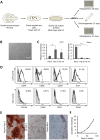
FIG 1
FIG 1
Characterization of leukemia inhibitory factor (LIF)-selected suture-derived mesenchymal cells expanded in culture for 8 population doublings (PDs). (A) A schematic representation and timeline of the cell isolation, culture, and characterization process. (B) Phase-contrast image of suture-derived wild-type cells displaying a fibroblastoid morphology. (C) Axin2 and Osterix mRNA levels normalized to Gapdh as determined by quantitative PCR (qPCR) in suture cells of the indicated population doubling (PD) level. Data were analyzed with one-way analysis of variance (ANOVA) followed by Dunnett’s (two-sided) test to compare all groups against the control group (PD 0). **, P < 0.01; ***, P < 0.001. (D) Flow cytometric analysis of cells for mesenchymal stem cell (MSC) markers (CD44, CD90, CD29, Sca1, and CD105) and hematopoietic/endothelial markers (CD45, CD34, and CD31). Filled histograms indicate the unlabeled cells used as negative controls. (E) Cells were induced to differentiate toward osteocytes, adipocytes, and chondrocytes and were stained with alizarin red S, oil red O, and alcian blue/hematoxylin, respectively. Bars, 100 μm, 50 μm, and 20 μm, respectively. (F) Graph showing the population doublings over time in culture for LIF-expanded suture mesenchymal cells. Each measurement (point in graph) was performed at the end of each passage.
FIG 2
FIG 2
Erf insufficiency compromises the ability of suture-derived mesenchymal stem and progenitor cells (sdMSCs) to mineralize. (A) Frequency in each of the cell cycle phases of cells growing in maintenance conditions as determined by propidium iodide staining and flow cytometry. (B) Doubling time in hours of ErfloxP/+ and ErfloxP/− sdMSCs at the indicated population doubling (PD) levels. (C to E) sdMSCs were induced to differentiate along the chondrogenic lineage for 21 days (C), the adipogenic lineage for 21 days (D), and the osteogenic lineage for 28 days (E) and stained with alcian blue and hematoxylin, oil red O, and alizarin red S, respectively. Bars, 10 μm, 50 μm, and 100 μm, respectively. (F) Measurements of the alizarin red S dye extracted from the cells after 28 days of osteogenic differentiation. Three independent biological experiments were conducted, and the statistical analysis was performed using an unpaired t test with two-tailed distribution. *, P < 0.05.
FIG 3
FIG 3
Freshly isolated suture-derived Erf-insufficient cells display altered differentiation potential. (A) The initial heterogeneous population of cells was induced to differentiate along the osteogenic lineage for 28 days and stained with alizarin red S for calcium deposits. (B) Quantification of alizarin red S levels after extraction from culture wells at the indicated time points of differentiation. (C) Cells differentiating toward chondrocytes for 21 days, stained with alcian blue and hematoxylin. (D) Cells differentiating toward adipocytes for 7 days, stained with oil red O. (E) The total number of cells in adipocyte differentiation was determined by Hoechst 33342 staining of the nuclei. Statistical analysis was performed using a t test with two-tailed distribution. *, P < 0.05; **, P < 0.01.
FIG 4
FIG 4
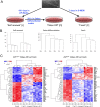
Extensive transcriptional differences between growth conditions but not genotypes. (A) RNA was collected from suture-derived (top) freshly isolated suture cells cultured for 7 days (right, “fresh [F]”), sdMSCs cultured for 8 PDs in maintenance medium (left, “self-renewal [L]”), and sdMSCs of 8 PDs induced with osteogenic differentiation medium for 24 h (middle, “osteo diff [O]”). At least 3 or 4 mice were used per genotype for each of the above conditions tested per experiment, and at least 4 independent experiments were conducted. (B) Unsupervised clustering of gene expression experiment from Erf-competent Erfloxp/+ (P/+) and Erf-insufficient Erfloxp/− (P/−) cells, indicating no genotype-specific associations. Self-renewal, sdMSCs in self renewal medium; osteo differentiation, sdMSCs 24 h in osteogenic differentiation medium; fresh cells, freshly isolated suture-derived cells. (C) Heatmaps based on the 60 most differentially expressed genes of the indicated comparison, showing a clear clustering between conditions but not between genotypes. P/+, Erf-competent (ErfloxP/+) cells; P/−, Erf-insufficient (ErfloxP/−) cells.
FIG 5
FIG 5
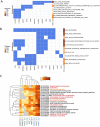
Transcriptome analysis indicates a deficit of extracellular matrix- and ossification- related genes in Erf-insufficient cells. (A, B) The limited number of genes found to be significantly decreased in Erf-insufficient cells compared to Erf-competent cells (Table 1) were analyzed with the GSEA program and visualized with ComplexHeatmap in the R environment. The significance of the top 10 categories enriched in the query genes for the sdMSCs in osteogenic differentiation (A) and for the initial heterogeneous suture cell population (freshly isolated cells) (B) is shown. (C) Differentially expressed genes identified by transcriptome analysis (see Table S1 in the supplemental material) of sdMSCs (L), sdMSCs growing in osteogenic differentiation medium for 24 h (“O”), and freshly isolated suture cells (“F”), from Erf-competent (ErfloxP/+; “plus”) and Erf-insufficient (ErfloxP/−; “minus”) animals, were clustered, based on their ontology, with the Metascape program. L-O_comm, genes found to be differentially expressed during the 24-h induction of sdMSCs of both Erf-competent and Erf-insufficient cells; L-O_plus, genes found to be differentially expressed during the 24-h induction only in the Erf-competent sdMSCs; L-O_minus, genes found to be differentially expressed during the 24-h induction only in the Erf-insufficient sdMSCs. “L-F” indicates genes found to be differentially expressed between sdMSCs and freshly isolated cells and “O-F” indicates differential expression between sdMSCs differentiating for 24 h and freshly isolated cells. Red and orange lettering indicate ossification-related and differentiation-related ontologies, respectively. Only the top 20 categories are shown. GO, gene ontology.
FIG 6
FIG 6
Erf expression correlates with ossification- and extracellular matrix organization- related genes. (A) Genes found in mouse suture single-cell RNA sequencing experiments (see Table S2 in the supplemental material) to correlate with Erf expression were clustered based on their ontology with the Metascape program. P10, single-cell RNA sequencing (scRNA-seq) data from P10 animals; E16.5, scRNA-seq data from E16.5 embryos; E18.5, scRNA-seq data from E18.5 embryos. (B) As in panel A, but with the addition of data from genes correlated with Alpl, Fgfr2, Runx2, Sp7, and Twist1 as markers for osteogenic differentiation stages. Red and orange lettering indicate ossification-related and differentiation-related ontologies, respectively. Only the top 20 categories are shown.
FIG 7
FIG 7
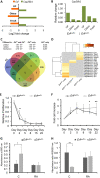
Retinoic acid reverts the osteogenic differentiation deficiency of ErfloxP/− sdMSCs. (A) Fold change in the expression level of Erf and Cyp26b1 between Erf-competent and Erf-deficient cells in self-renewing sdMSCs (LIF), differentiating sdMSCs (osteo) and freshly derived suture cells (fresh). (B) Relative expression level of Cyp26b1 compared to Erf-competent (ErfloxP/+) sdMSCs in proliferation medium (LIF). (C) Venn diagram showing genes differentially expressed during MSC differentiation for each genotype and genes found regulated in mouse embryonic stem cells (mESCs) after retinoic acid treatment. The table above indicates the significance of the enrichment in retinoic acid (RA)-related genes. The number of common genes in each comparison is underlined. (D) Analysis of genes associated with RA (underlined in panel C) via Metascape, in relation to other transcription factors. (E) Relative percentage of proliferating cells as estimated by BrdU incorporation during osteogenic differentiation of Erf-insufficient (ErfloxP/−) and Erf-competent (ErfloxP/+) sdMSCs. Data are derived from four independent biological experiments, each including two experimental replicates. (F) Relative cell number during the same experiment as in panel E. (G) Cell numbers, as evaluated by formazan absorbance after 28 days in osteogenic differentiation medium in the presence or absence (“C”) of 0.5 μM all-trans retinoic acid (RA). (H) Calcification potential per cell as evaluated by the alizarin red S to formazan absorbance after 28 days of osteogenic differentiation in the presence or absence (“C”) of 0.5 μM all-trans retinoic acid (RA). Data for panels A and B are derived from the RNA sequencing data set and analyzed as described in Materials and Methods. The values shown have a false-discovery rate (FDR) lower than 0.05. Data for panels G and H are from four experiments, and the statistical analysis was performed in all cases using an unpaired t test with two-tailed distribution. *, P < 0.05; **, P < 0.01.
FIG 8
FIG 8
Mechanism of Erf effect in the osteogenic differentiation of cranial suture mesenchymal stem/progenitor cells. Erf, an FGF effector, affects the level of retinoic acid, possibly through the RA-catabolizing enzyme Cyp26b1. Decreased levels of Erf lead to increased levels of Cyp26b1, which in turn decrease retinoic acid levels, leading to reduced osteogenic differentiation and/or increased mesenchymal progenitor proliferation.

References

    1. Morriss-Kay GM, Wilkie AO. 2005. Growth of the normal skull vault and its alteration in craniosynostosis: insights from human genetics and experimental studies. J Anat 207:637–653. 10.1111/j.1469-7580.2005.00475.x. - DOI - PMC - PubMed
    1. Opperman LA. 2000. Cranial sutures as intramembranous bone growth sites. Dev Dyn 219:472–485. 10.1002/1097-0177(2000)9999:9999<::AID-DVDY1073>3.0.CO;2-F. - DOI - PubMed
    1. Debnath S, Yallowitz AR, McCormick J, Lalani S, Zhang T, Xu R, Li N, Liu Y, Yang YS, Eiseman M, Shim JH, Hameed M, Healey JH, Bostrom MP, Landau DA, Greenblatt MB. 2018. Discovery of a periosteal stem cell mediating intramembranous bone formation. Nature 562:133–139. 10.1038/s41586-018-0554-8. - DOI - PMC - PubMed
    1. Zhao H, Feng J, Ho TV, Grimes W, Urata M, Chai Y. 2015. The suture provides a niche for mesenchymal stem cells of craniofacial bones. Nat Cell Biol 17:386–396. 10.1038/ncb3139. - DOI - PMC - PubMed
    1. Lana-Elola E, Rice R, Grigoriadis AE, Rice DP. 2007. Cell fate specification during calvarial bone and suture development. Dev Biol 311:335–346. 10.1016/j.ydbio.2007.08.028. - DOI - PubMed

Publication types

LinkOut - more resources