. 2021 May 18;118(20):e2021814118.
doi: 10.1073/pnas.2021814118.

CYK-1/Formin activation in cortical RhoA signaling centers promotes organismal left-right symmetry breaking

Affiliations

CYK-1/Formin activation in cortical RhoA signaling centers promotes organismal left-right symmetry breaking

Teije C Middelkoop et al. Proc Natl Acad Sci U S A. .

Abstract

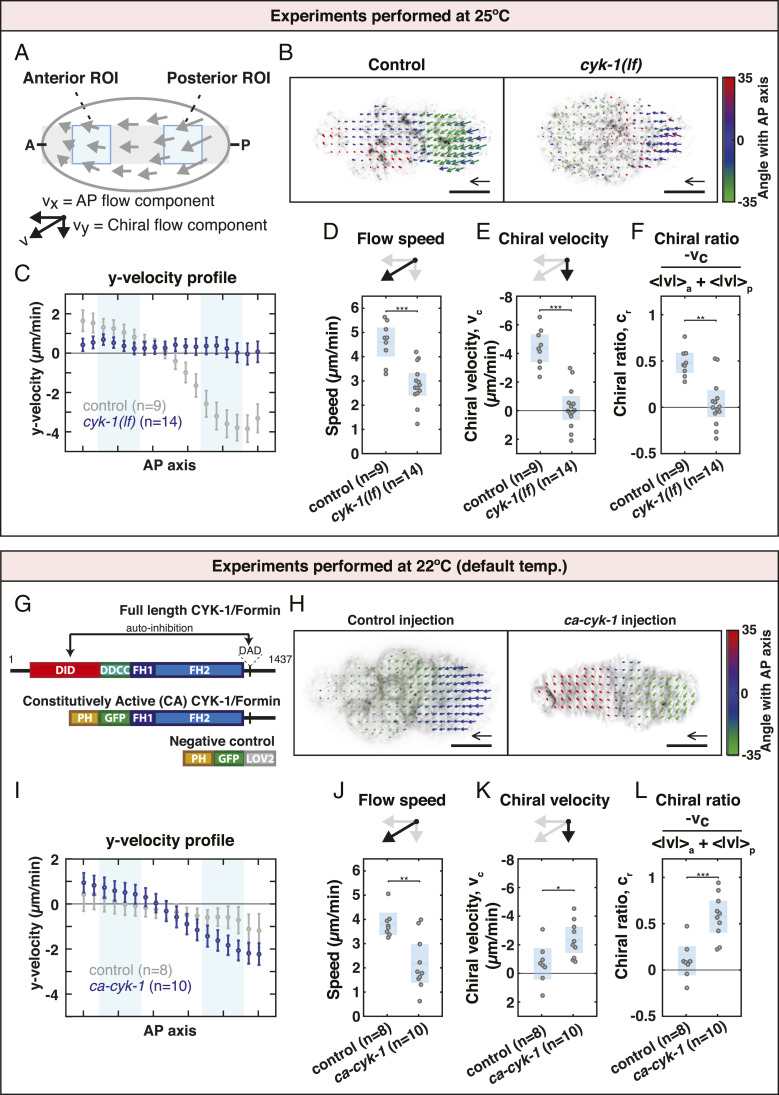
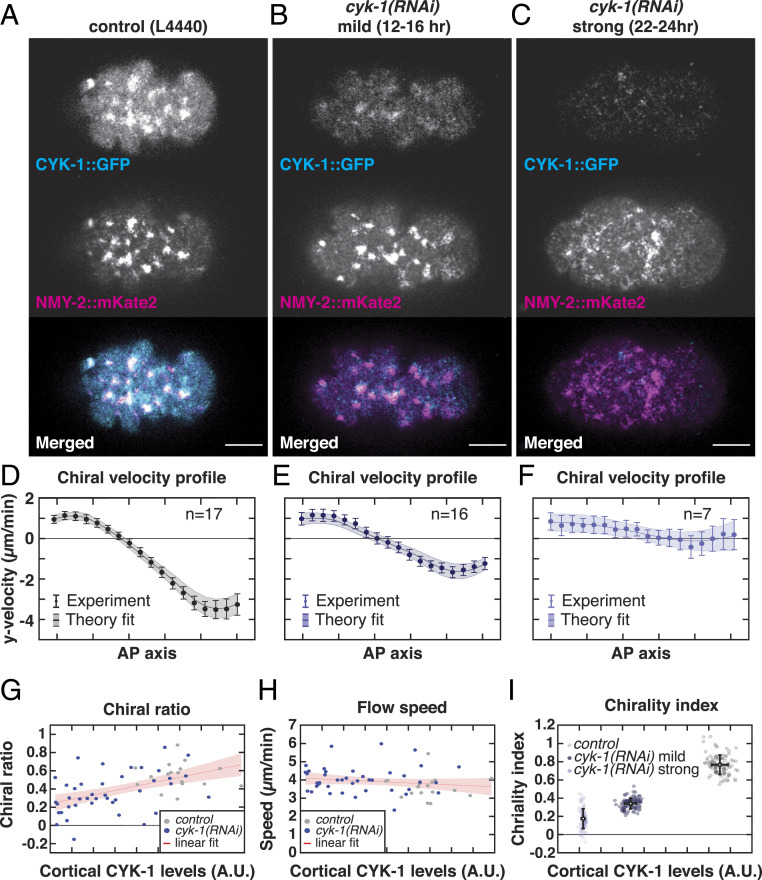
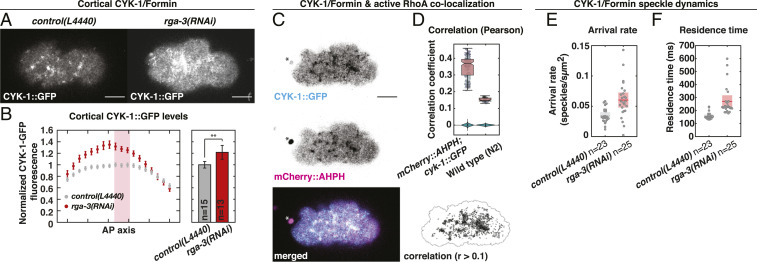
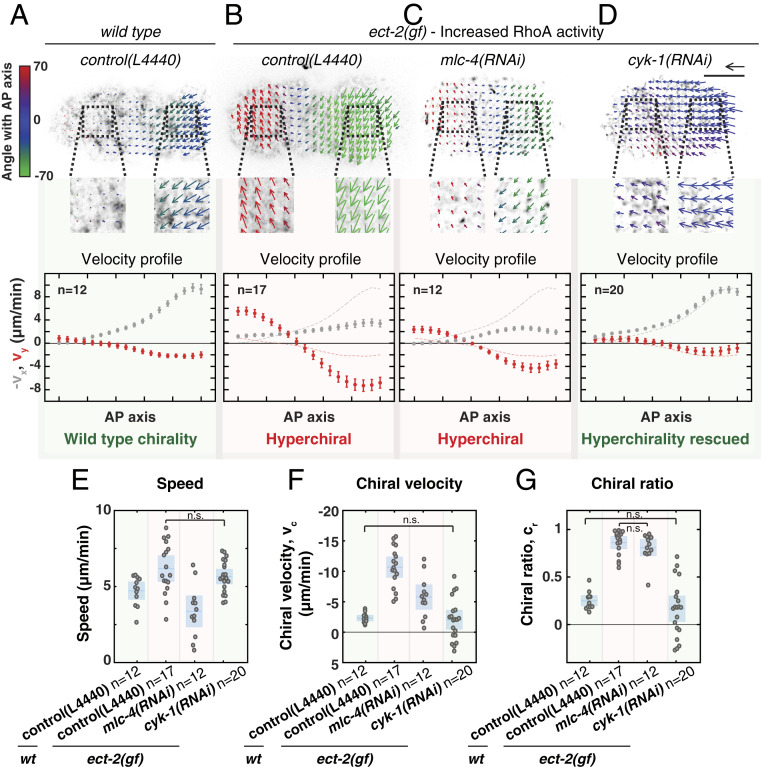
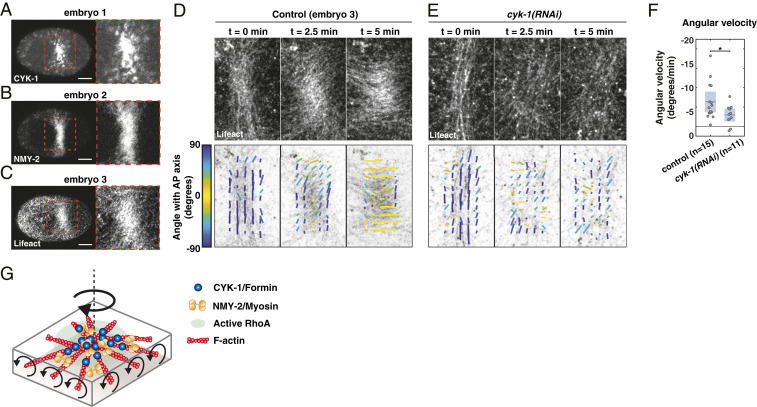
Proper left-right symmetry breaking is essential for animal development, and in many cases, this process is actomyosin-dependent. In Caenorhabditis elegans embryos active torque generation in the actomyosin layer promotes left-right symmetry breaking by driving chiral counterrotating cortical flows. While both Formins and Myosins have been implicated in left-right symmetry breaking and both can rotate actin filaments in vitro, it remains unclear whether active torques in the actomyosin cortex are generated by Formins, Myosins, or both. We combined the strength of C. elegans genetics with quantitative imaging and thin film, chiral active fluid theory to show that, while Non-Muscle Myosin II activity drives cortical actomyosin flows, it is permissive for chiral counterrotation and dispensable for chiral symmetry breaking of cortical flows. Instead, we find that CYK-1/Formin activation in RhoA foci is instructive for chiral counterrotation and promotes in-plane, active torque generation in the actomyosin cortex. Notably, we observe that artificially generated large active RhoA patches undergo rotations with consistent handedness in a CYK-1/Formin-dependent manner. Altogether, we conclude that CYK-1/Formin-dependent active torque generation facilitates chiral symmetry breaking of actomyosin flows and drives organismal left-right symmetry breaking in the nematode worm.

Keywords: C. elegans; Formin; RhoA signaling; left–right asymmetry.


Conflict of interest statement

The authors declare no competing interest.

Figures

Fig. 1.
Fig. 1.
CYK-1/Formin is a determinant of actomyosin flow chirality. (A) Schematic of a C. elegans zygote during anteroposterior polarization. Gray: region used to obtain the flow velocity profiles. Blue areas: regions of interest used to calculate the mean flow speed, chiral velocity, and chiral ratio. (B) Time-averaged flow field overlaid on an image of cortical NMY-2::GFP of a control and a cyk-1(lf) mutant embryo. Velocity vectors are color coded for their angle with the anteroposterior axis. (Scale bar, 10 μm.) Velocity scale arrow, 20 μm/min. (C) Mean y velocity in 18 bins along the anteroposterior axis averaged over embryos for control (gray) and for cyk-1(lf) (blue). Light blue areas: bins 3 to 6 and 13 to 16 corresponding to the anterior and posterior regions of interest, respectively. Error bars, SEM. (D) Mean speed per embryo defined as (<|v|>a+<|v|>p)/2, where <|v|>a and <|v|>p are the spatial averages in the anterior and posterior regions of interest, respectively. (E) Mean chiral velocity, vc, per embryo defined as <vy>p<vy>a, where <vy>a and <vy>p are the spatially averaged y velocities in the anterior and posterior regions of interest, respectively. (F) Mean chiral ratio per embryo, defined as vc<|v|>a+<|v|>p. (G) Domain overview of CYK-1/Formin (top) and the constructs generated in this study (middle and bottom). DID, Dia Inhibitory Domain; DD, Dimerization Domain; CC, Coiled Coil; FH, Formin Homology; DAD, Diaphanous Autoregulatory Domain; PH, Pleckstrin Homology; LOV2, Light-Oxygen-Voltage 2 domain. (H) Time-averaged flow field overlaid on an image of cortical Lifeact-mKate2 derived from control (ph-gfp-lov2) injection and ca-cyk-1/Formin injection. (I) Mean y-velocity profile in embryos derived from control injection (gray) and from ca-cyk-1/Formin injection (blue). (J–L) Mean flow speed (J), chiral velocity (K), and chiral ratio (L) in embryos derived from control injection and from ca-cyk-1/Formin injection. Blue in D–F and JL depicts the mean over embryos with 95% confidence interval. Significance testing: *P 0.05; **P 0.01; ***P 0.001 (Wilcoxon rank sum test). n indicates the number of embryos.
Fig. 2.
Fig. 2.
CYK-1/Formin promotes torque generation in the actomyosin cortex. (AC) Representative micrographs of cortical CYK-1/Formin::GFP and NMY-2::mKate2 in (A) control (L4440), (B) mild cyk-1(RNAi) (12 to 16 h), and (C) strong cyk-1(RNAi) (22 to 24 h) during polarizing flows. (Scale bar, 10 μm.) (D–F) Mean y-velocity profile in 18 bins along the anteroposterior axis. Conditions are as in A–C. Circles with error bars are the experimentally measured y velocities averaged over embryos, with SEM. Solid line shows the mean y velocities derived from fitting the hydrodynamic model to 100 bootstrap samples with replacement. Shaded region: standard deviation of the mean, derived from bootstrapping. n indicates the number of embryos. (G and H) Chiral ratio (G) and speed (H) of the cortical flow plotted over the measured cortical CYK-1/Formin::GFP fluorescence in control (L4440, gray) and upon increasing strength of cyk-1(RNAi) (blue). Data points represent individual embryos (control, n = 17; cyk-1(RNAi), n = 41). Red line with shaded region shows a linear fit with 95% confidence bounds. Chiral ratio, but not flow speed, correlates with cortical CYK-1/Formin::GFP (Spearman’s ρ = 0.54, P < 0.00002). (I) Chirality index plotted over the measured cortical CYK-1/Formin::GFP fluorescence in control (L4440, gray), mild cyk-1(RNAi) (12 to 16 h, dark blue), and strong cyk-1(RNAi) (22 to 24 h, light blue). Chirality index was obtained by fitting the hydrodynamic model to the mean of individual bootstrap samples with replacement. Simultaneously, in each bootstrap sample the mean cortical CYK-1/Formin::GFP fluorescence was calculated. Gray and blue data points represent individual bootstrap samples. Black points with error bars display the mean over all bootstrap samples with standard deviation.
Fig. 3.
Fig. 3.
CYK-1/Formin is a RhoA target during polarizing flows. (A) Representative micrographs of cortical CYK-1/Formin::GFP in control (L4440, Left) and upon rga-3(RNAi) (Right). (B) Left, mean cortical CYK-1/Formin::GFP fluorescence in 18 bins along the anteroposterior axis in control (L4440, gray) and upon rga-3(RNAi) (red). Fluorescence levels were normalized to the mean levels in bins 9 to 11 (red rectangle). Error bars, SEM. Right, mean cortical CYK-1/Formin::GFP fluorescence measured in bins 9 to 11. Error bars, 95% confidence interval. Significance testing: **P < 0.01 (Wilcoxon rank sum test). n indicates the number of embryos. (C) Cortical CYK-1/Formin::GFP (Top), mCherry::ANI-1(AHPH) (Middle), and merged (Bottom). Asterisk marks the polar body. (Bottom Right) Regions of colocalization in black (Pearson’s correlation coefficient > 0.1). Black line: masked region. (D) Pearson’s correlation coefficient computed in cyk-1::GFP; mCherry::ani-1(AHPH) (n = 13 embryos) and N2 wild type (n = 4 embryos) to control for correlation of autofluorescence. Data points represent individual frames (15 frames per embryo), and box plot is overlaid. As a negative control the correlation was computed after scrambling the pixels in one channel, 100 times independently. Violin plots display the distribution of these negative controls. (E and F) CYK-1/Formin::GFP speckle arrival rate (E) and residence time (F) in control (L4440; gray, n = 23 embryos) and upon rga-3(RNAi) (red, n = 25 embryos). Data points represent individual embryos. Boxes indicate mean with 95% confidence interval. (Scale bars, 10 μm.)
Fig. 4.
Fig. 4.
RhoA promotes chiral counterrotating actomyosin flow via CYK-1/Formin activation. (A–D) (Top) Time-averaged flow fields overlaid on a still image of cortical NMY-2::GFP of (A) a wild-type embryo on RNAi control (L4440), (B) an ect-2(gf) mutant on RNAi control (L4440), (C) ect-2(gf); mlc-4(RNAi), and (D) ect-2(gf); cyk-1(RNAi). Mean velocity vectors are color coded for their angle with the anteroposterior axis. (Scale bar, 10 μm.) Velocity scale arrow, 20 μm/min. (Bottom) Mean x velocity (gray) and y velocity (red) in 18 bins along the anteroposterior axis. Dashed lines in the plots in B–D display the mean x- and y-velocity profiles in wild type. Error bars, SEM. n indicates the number of embryos. (EG) Mean speed (E), chiral velocity vc (F), and chiral ratio cr (G) per embryo. Data points represent individual embryos. Blue stripe and area represent the mean with 95% confidence interval. Significance testing: Only conditions that are not significantly different are indicated in the diagrams (n.s., P > 0.05, Wilcoxon rank sum test). The flow hyperchirality (red background in all panels) of ect-2(gf) is rescued in ect-2(gf); cyk-1(RNAi) (green background in all panels), but not in ect-2(gf); mlc-4(RNAi) (red background in all panels).
Fig. 5.
Fig. 5.
CYK-1/Formin activity in a compression-induced RhoA patch promotes clockwise reorientation of cortical F-actin. (A–C) Micrographs of compressed embryos in which the cytokinetic ring collapsed, resulting in a region enriched in (A) CYK-1/Formin, (B) NMY-2, and (C) F-actin. Note that the three images are derived from three different embryos. (Scale bars, 10 μm.) (D and E) Fluorescent micrographs of cortical Lifeact-mKate2 (Top), overlaid with the local filament order in small templates (Bottom) of a (D) control and (E) cyk-1(RNAi) embryo, at the onset of patch formation (t = 0 min), during patch rotation (t = 2.5 min), and at the end of patch rotation (t = 5 min). Both examples shown in D and E display an embryo with strong clockwise reorientation, relative to the mean of the condition. Local directors are color coded for the angle with the anteroposterior axis. (F) Mean angular velocity in a time window of 5 min during reorientation of the patch in control and cyk-1(RNAi). Because the timing of rotation with respect to the onset of patch formation varied among embryos, the start of the 5-min time window was chosen such that the clockwise angular velocity was maximal (Materials and Methods). Mean with 95% confidence interval is indicated in blue. Significance testing: *P < 0.05 (Wilcoxon rank sum test). n indicates the number of embryos. (G) Schematic of an active RhoA patch in which F-actin, NMY-2, and CYK-1/Formin are enriched. If Formins in the RhoA patch are constrained and elongate filaments in opposite directions, opposing filaments will counterrotate, which we hypothesize drives clockwise rotation of the patch as a whole.

References

    1. Brown N. A., Wolpert L., The development of handedness in left/right asymmetry. Development 109, 1–9 (1990). - PubMed
    1. Géminard C., González-Morales N., Coutelis J. B., Noselli S., The myosin ID pathway and left-right asymmetry in Drosophila. Genesis 52, 471–480 (2014). - PubMed
    1. Hozumi S., et al. , An unconventional myosin in Drosophila reverses the default handedness in visceral organs. Nature 440, 798–802 (2006). - PubMed
    1. Inaki M., Sasamura T., Matsuno K., Cell chirality drives left-right asymmetric morphogenesis. Front. Cell. Dev. Biol. 6, 34 (2018). - PMC - PubMed
    1. Sato K., et al. , Left-right asymmetric cell intercalation drives directional collective cell movement in epithelial morphogenesis. Nat. Commun. 6, 10074 (2015). - PMC - PubMed

Publication types

MeSH terms

LinkOut - more resources