

Spontaneous functional changes in specific cerebral regions in patients with hypertensive retinopathy: a resting-state functional magnetic resonance imaging study
- PMID: 33972462
- PMCID: PMC8148467
- DOI: 10.18632/aging.202999
Spontaneous functional changes in specific cerebral regions in patients with hypertensive retinopathy: a resting-state functional magnetic resonance imaging study
Abstract
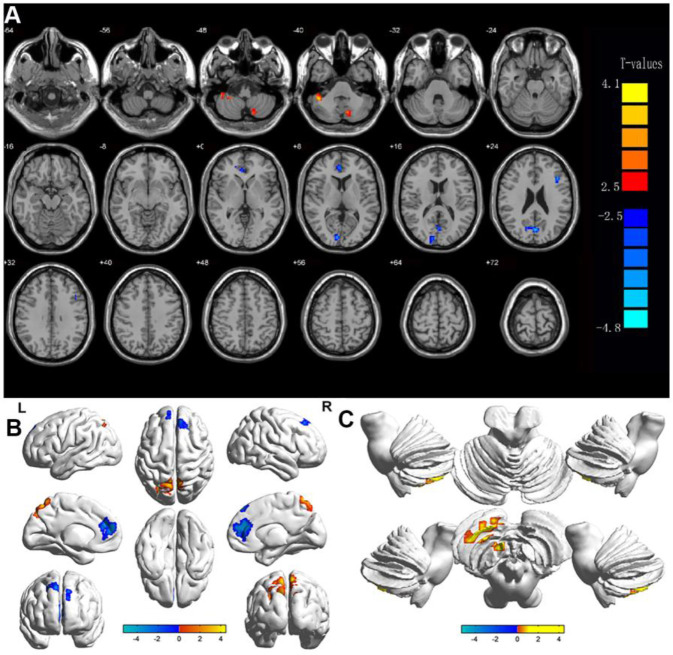
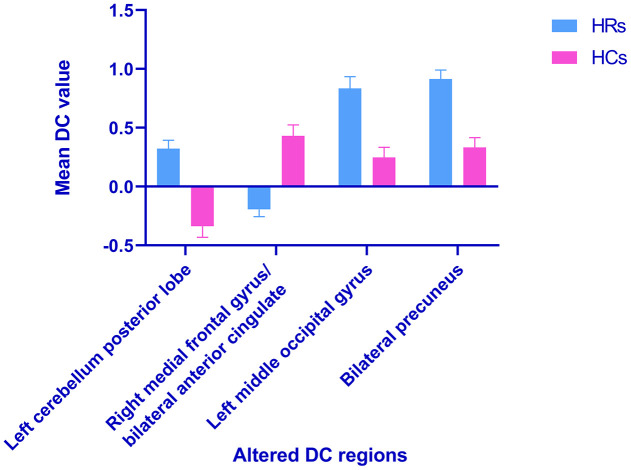
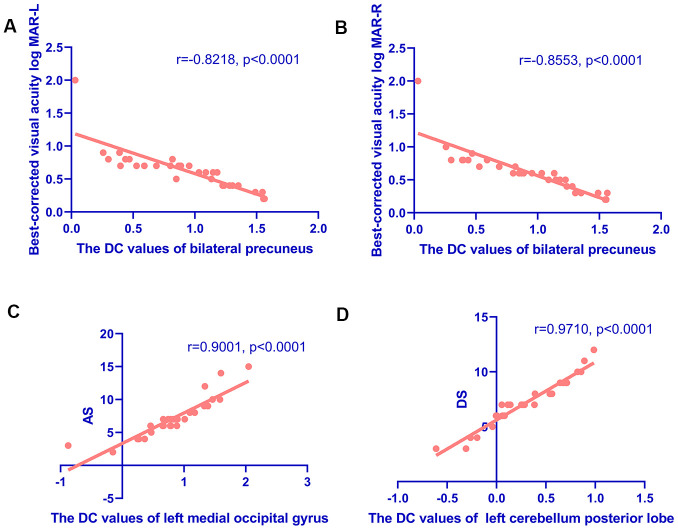
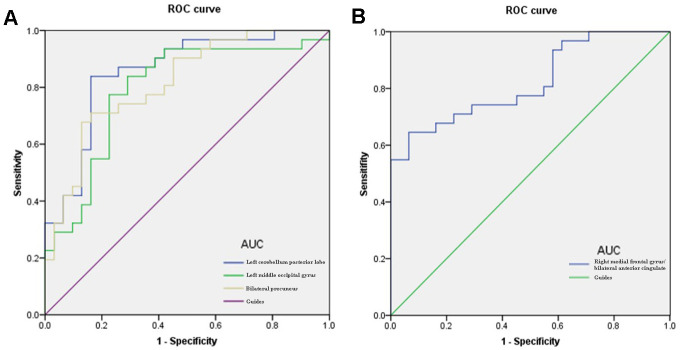
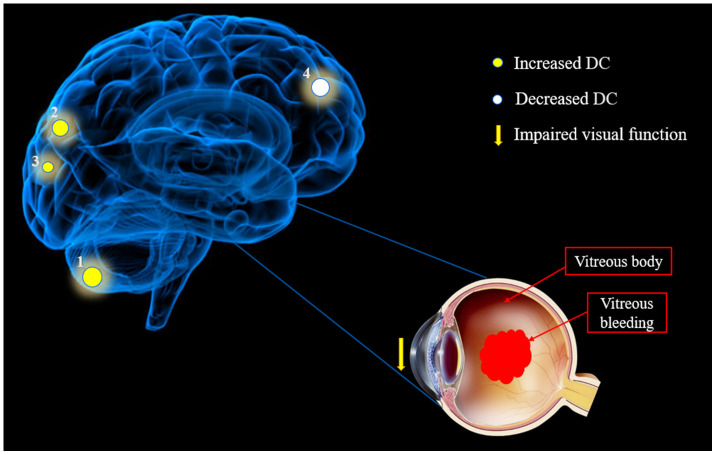
This study investigated functional alterations in the cerebral network of patients with hypertensive retinopathy (HR) by resting-state functional magnetic resonance imaging (rs-fMRI) and degree centrality (DC) methods. 31 patients with HR along with 31 healthy controls (HC) closely matched in gender and age were enrolled for the research. All participants were examined by rs-fMRI, and the DC method was applied to evaluate alterations in spontaneous cerebral activity between the 2 groups. We used the independent samples t test to evaluate demographic and general information differences between HR patients and HCs. The 2-sample t test was used to compare the DC values of different cerebral regions between the 2 groups. The accuracy of differential diagnostic HR was analyzed by receiver operating characteristic (ROC) curve method for rs-fMRI DC values changes. Pearson's correlation coefficient was applied to determine the correlation between differences in DC in specific cerebral areas and clinical manifestation. Results showed that DC values were higher in the left cerebellum posterior lobe (LCPL), left medial occipital gyrus (LMOG), and bilateral precuneus (BP) of HR patients compared to HCs. Mean DC values were lower in the right medial frontal gyrus/bilateral anterior cingulate cortex of HR patients. Anxiety and depression scores were positively correlated with DC values of LMOG and LCPL, respectively. Bilateral best-corrected visual acuity in HR patients was negatively correlated with the DC value of BP. Hence, changes in DC in specific cerebral areas of patients with HR reflect functional alterations that provide insight into the pathophysiologic mechanisms of HR.
Keywords: functional MRI; hypertensive retinopathy; neuroimaging; spontaneous cerebral activity; voxel-wise degree centrality.
Conflict of interest statement
Figures
Similar articles
-
Alternation of brain intrinsic activity in patients with hypertensive retinopathy: a resting-state fMRI study.Aging (Albany NY). 2021 Sep 13;13(17):21659-21670. doi: 10.18632/aging.203510. Epub 2021 Sep 13. Aging (Albany NY). 2021. PMID: 34516404 Free PMC article.
-
Brain Functional Connectivity Changes in Patients with Acute Eye Pain: A Resting-State Functional Magnetic Resonance Imaging (fMRI) Study.Med Sci Monit. 2021 Aug 13;27:e930588. doi: 10.12659/MSM.930588. Med Sci Monit. 2021. PMID: 34388144 Free PMC article.
-
Altered brain network centrality in patients with adult comitant exotropia strabismus: A resting-state fMRI study.J Int Med Res. 2018 Jan;46(1):392-402. doi: 10.1177/0300060517715340. Epub 2017 Jul 6. J Int Med Res. 2018. PMID: 28679330 Free PMC article.
-
Alterations in degree centrality and functional connectivity in tension-type headache: a resting-state fMRI study.Brain Imaging Behav. 2024 Aug;18(4):819-829. doi: 10.1007/s11682-024-00875-w. Epub 2024 Mar 21. Brain Imaging Behav. 2024. PMID: 38512647 Review.
-
Common and distinct patterns of intrinsic brain activity alterations in major depression and bipolar disorder: voxel-based meta-analysis.Transl Psychiatry. 2020 Oct 19;10(1):353. doi: 10.1038/s41398-020-01036-5. Transl Psychiatry. 2020. PMID: 33077728 Free PMC article. Review.
Cited by
-
The amplitude of low frequency fluctuation and spontaneous brain activity alterations in age-related macular degeneration.Front Med (Lausanne). 2025 Jan 22;11:1507971. doi: 10.3389/fmed.2024.1507971. eCollection 2024. Front Med (Lausanne). 2025. PMID: 39911676 Free PMC article.
-
Altered spontaneous brain activity patterns in hypertensive retinopathy using fractional amplitude of low-frequency fluctuations: a functional magnetic resonance imaging study.Int J Ophthalmol. 2024 Sep 18;17(9):1665-1674. doi: 10.18240/ijo.2024.09.14. eCollection 2024. Int J Ophthalmol. 2024. PMID: 39296557 Free PMC article.
-
Alterations of interhemispheric functional connectivity in patients with hypertensive retinopathy using voxel-mirrored homotopic connectivity: a resting state fMRI study.Int J Ophthalmol. 2025 Feb 18;18(2):297-307. doi: 10.18240/ijo.2025.02.14. eCollection 2025. Int J Ophthalmol. 2025. PMID: 39967983 Free PMC article.
References
-
- Modi P, Arsiwalla T. Hypertensive Retinopathy. In: StatPearls. Treasure Island (FL): StatPearls Publishing. 2020. https://www.ncbi.nlm.nih.gov/books/NBK525980/ - PubMed
Publication types
MeSH terms
LinkOut - more resources
Full Text Sources
Other Literature Sources
Medical
