Comparative Study
. 2021 May 10;12(1):2609.
doi: 10.1038/s41467-021-22457-w.

Predictive performance of international COVID-19 mortality forecasting models

Affiliations
Comparative Study

Predictive performance of international COVID-19 mortality forecasting models

Joseph Friedman et al. Nat Commun. .

Abstract

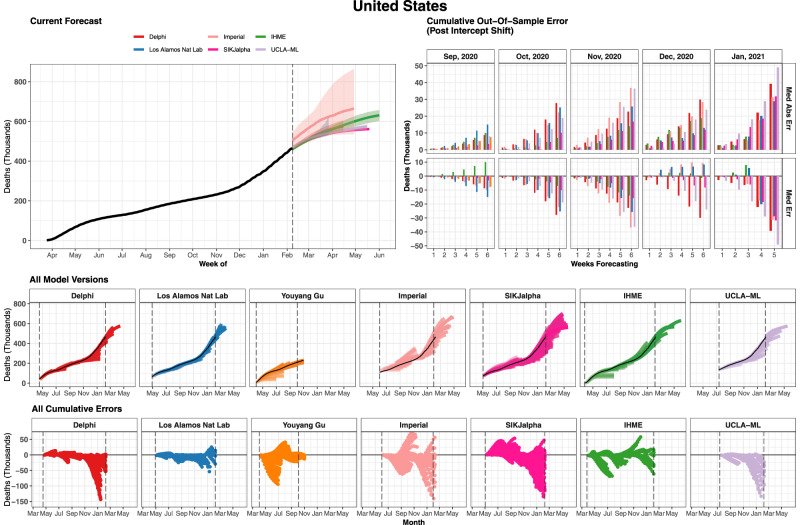
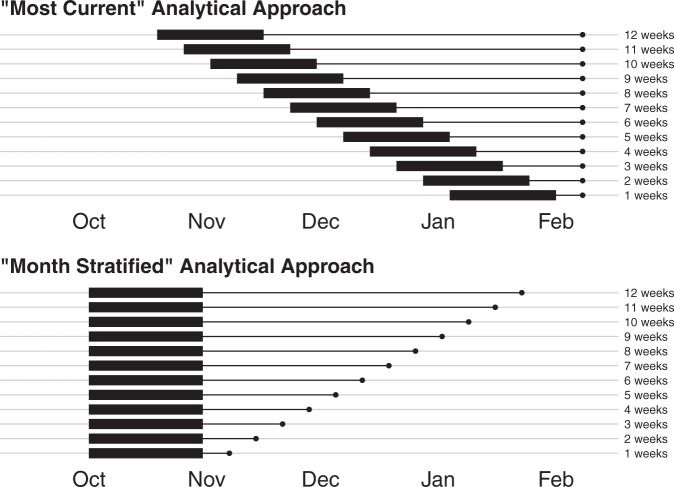
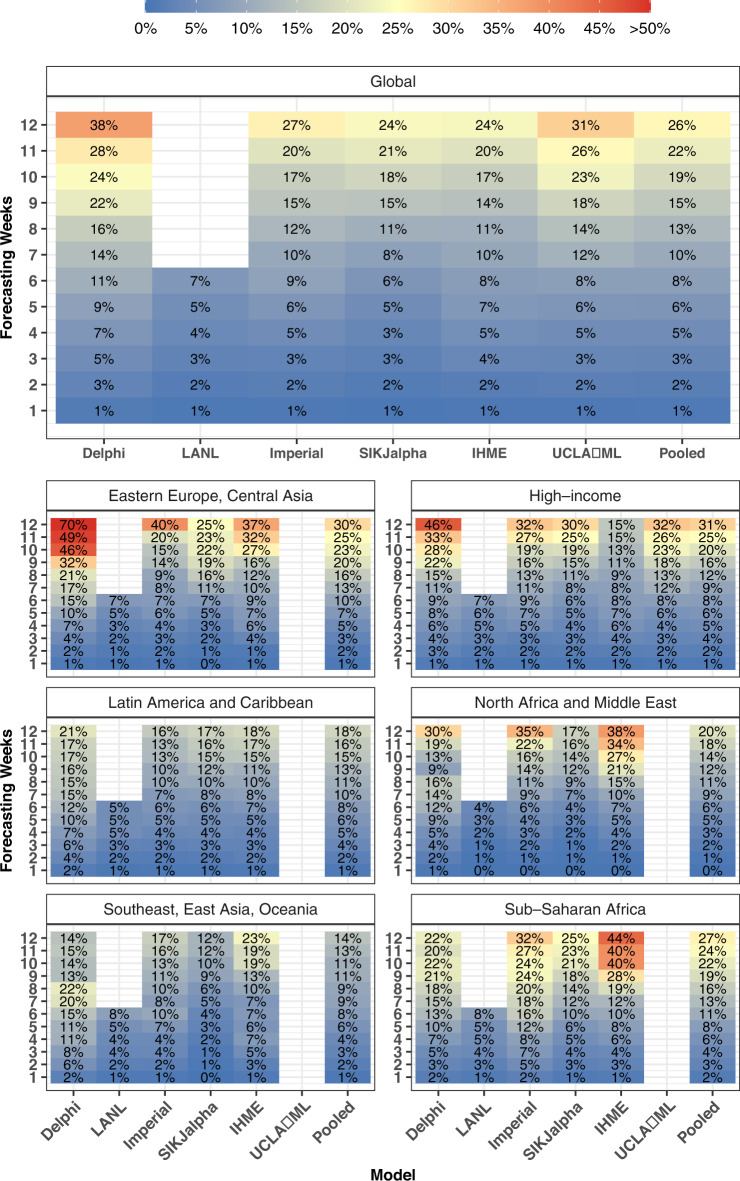
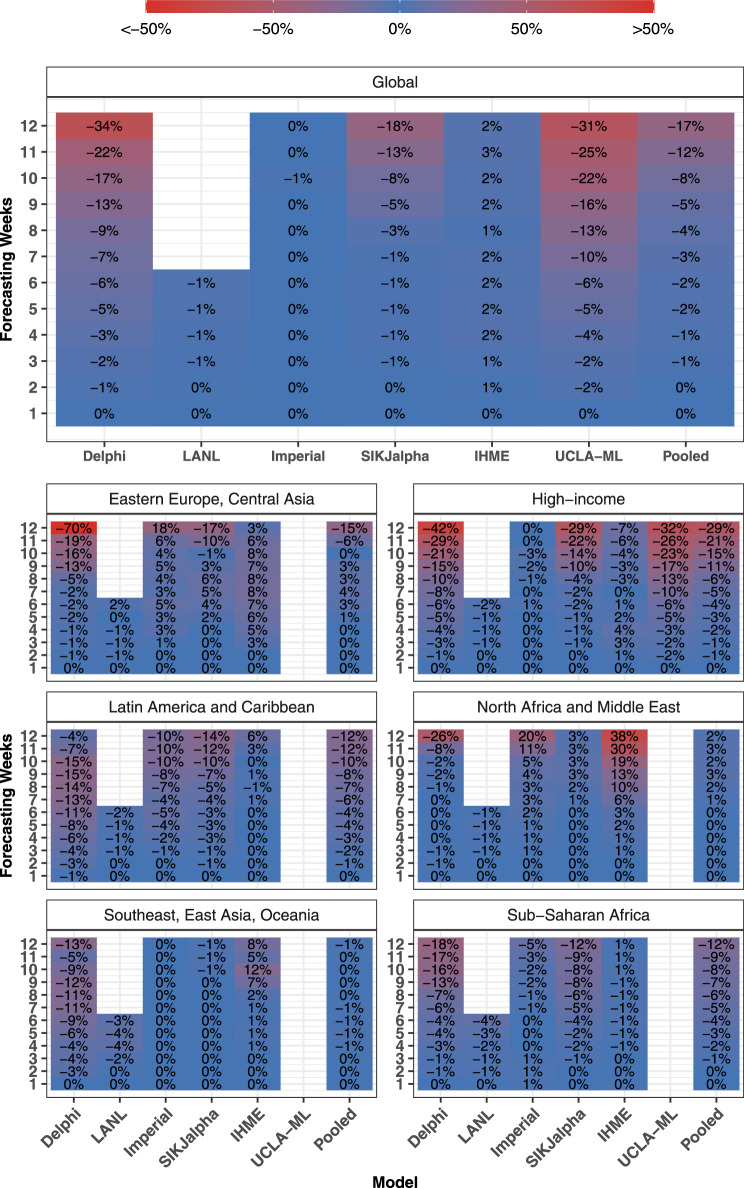
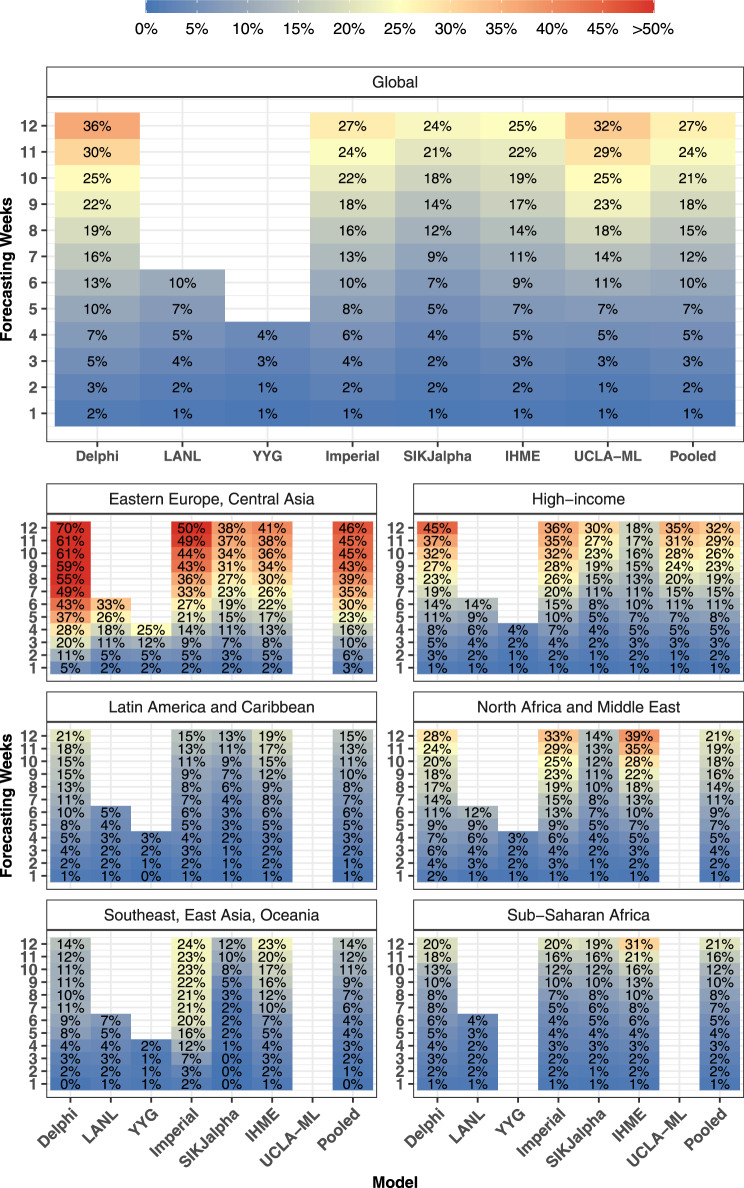
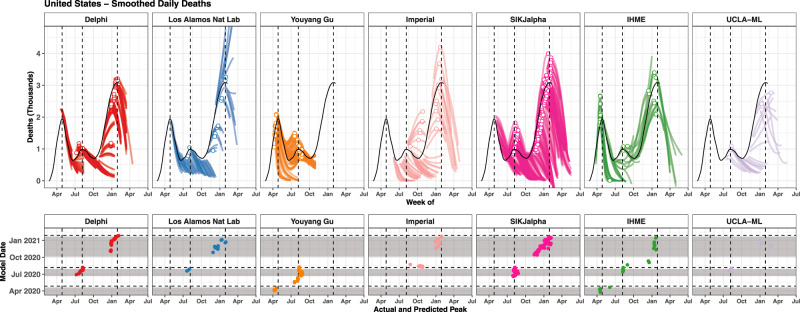
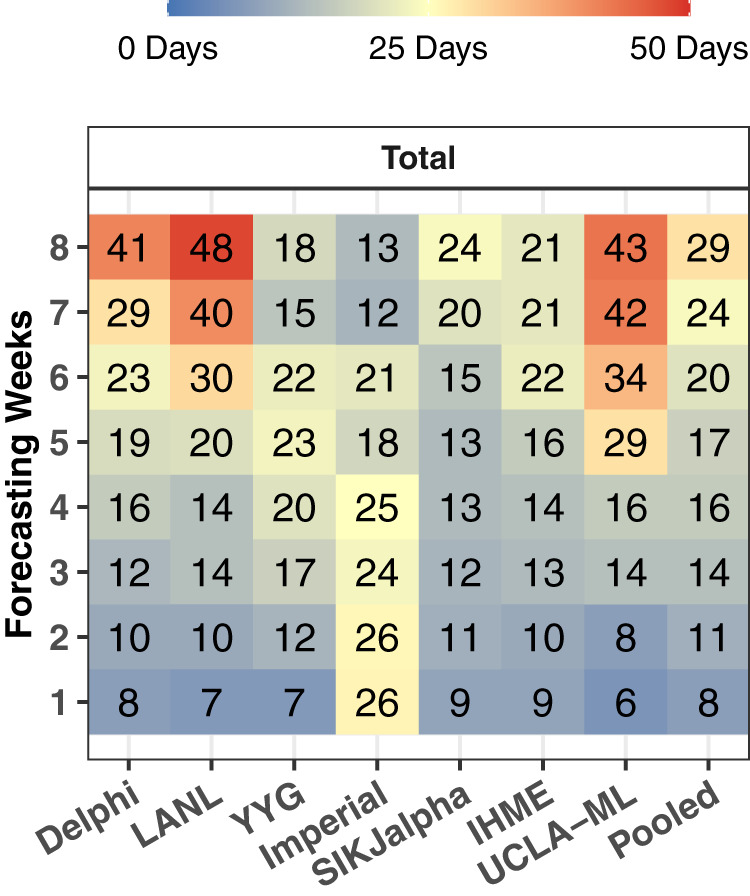
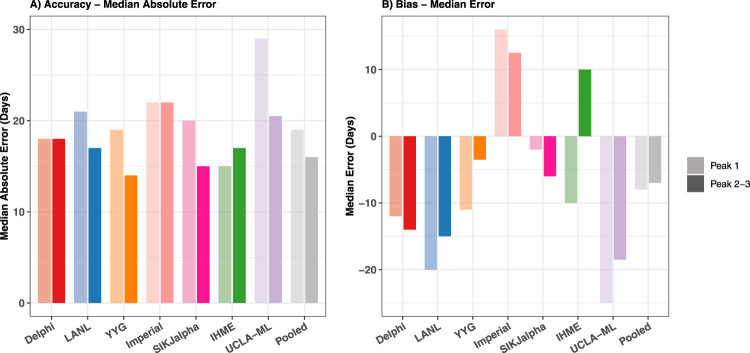
Forecasts and alternative scenarios of COVID-19 mortality have been critical inputs for pandemic response efforts, and decision-makers need information about predictive performance. We screen n = 386 public COVID-19 forecasting models, identifying n = 7 that are global in scope and provide public, date-versioned forecasts. We examine their predictive performance for mortality by weeks of extrapolation, world region, and estimation month. We additionally assess prediction of the timing of peak daily mortality. Globally, models released in October show a median absolute percent error (MAPE) of 7 to 13% at six weeks, reflecting surprisingly good performance despite the complexities of modelling human behavioural responses and government interventions. Median absolute error for peak timing increased from 8 days at one week of forecasting to 29 days at eight weeks and is similar for first and subsequent peaks. The framework and public codebase ( https://github.com/pyliu47/covidcompare ) can be used to compare predictions and evaluate predictive performance going forward.


Conflict of interest statement

The authors declare no competing interests.

Figures

Fig. 1
Fig. 1. Cumulative mortality forecasts and prediction errors by model—example for the United States.
The most recent version of each model is shown on the top left, as well as 95% prediction intervals when available. The middle row shows all iterations of each model as separate lines. The vertical dashed lines indicate the first and last model release date for each model. The bottom row shows all errors calculated at weekly intervals (circles). The top right panel summarises all observed errors, using median error (top) and median absolute error (bottom), by weeks of forecasting and month of model estimation. Errors incorporate an intercept shift to account for differences in each model’s input data. This figure represents an example for the United States of country-specific plots made for all locations examined in this study. Graphs for all geographies can be found in the Supplementary Information. Note that while certain models use different input data source than the other modelling groups causing apparently discordant past trends in the top-left panel. We plot raw estimates on the top-left panel; however, we implement an intercept shift to account for this issue in the calculation of errors. Delphi DELPHI-MIT (red), Los Alamos Nat Lab Los Alamos National Laboratory (blue), Youyang Gu (orange), Imperial   Imperial College London (peach), SIKjalpha USC SIKJ-alpha (pink), IHME Institute for Health Metrics and Evaluation (green), UCLA-ML UCLA Statistical Machine Learning Lab (purple).
Fig. 2
Fig. 2. Illustration of the analytical framework.
This figure highlights the analytical framework presented in the main text. Part A highlights the “most current” approach, which is used to select the data shown in Fig. 3. Part B highlights the “month stratified” approach used for Figs. 4 and 5. The Y axis shows the number of weeks of extrapolation for each scenario, while the x axis shows a range of model date—the date on which a model was released. The thick band in each plot highlights the 4-week window of model dates used for each extrapolation week value. The thin line shows the period for which each set of models is extrapolating before errors are calculated. In the top panel, the most recent 4 weeks of model dates are used for each extrapolation length. Therefore, for 1-week errors, models from January and February 2021 were used, whereas for 12-week errors, models from October and November 2020 were used. In the bottom panel, models from October are used in all cases. The analytic strategy highlighted in the top panel provides the most recent evidence possible for each extrapolation length. The strategy at the bottom allows for a more reliable assessment of how errors grow with increased extrapolation time.
Fig. 3
Fig. 3. Most current—cumulative mortality accuracy—median absolute percent error.
Median absolute percent error values, a measure of accuracy, were calculated across all observed errors at weekly intervals, for each model by weeks of forecasting and geographic region. Values that represent fewer than five locations are masked due to the small sample size. Models were included in the global average when they included at least five locations in each region. Pooled summary statistics reflect values calculated across all errors from all models, in order to comment on aggregate trends by time or geography. Results are shown here for the most recent 4-week window allowing for the calculation of errors at each point of extrapolation (see Fig. 2 and “Methods”). Results from other months are shown in the Supplementary Information. The colour reflects 50 for values above 50 to prevent extreme values obscuring the scale.
Fig. 4
Fig. 4. Month stratified October models—cumulative mortality bias—median percent error.
Median percent error values, a measure of bias, were calculated across all observed errors at weekly intervals, for each model, by weeks of forecasting and geographic region. Values that represent fewer than five locations are masked due to small sample size. Models were included in the global average when they included at least five locations in each region. Pooled summary statistics reflect values calculated across all errors from all models, in order to comment on aggregate trends by time or geography. Results are shown here for models released in October, and results from other months are shown in the Supplementary. The colour reflects 50 for values above 50, and −50 for values below −50, to prevent extreme values obscuring the scale.
Fig. 5
Fig. 5. Month stratified october models—cumulative mortality accuracy—median absolute percent error.
Median absolute percent error values, a measure of accuracy, were calculated across all observed errors at weekly intervals, for each model by weeks of forecasting and geographic region. Values that represent fewer than five locations are masked due to the small sample size. Models were included in the global average when they included at least five locations in each region. Pooled summary statistics reflect values calculated across all errors from all models, in order to comment on aggregate trends by time or geography. Results are shown here for models released in October, and results from other months are shown in the Supplementary Information. The colour reflects 50 for values above 50 to prevent extreme values obscuring the scale.
Fig. 6
Fig. 6. Observed vs predicted to peak in daily deaths—example for the United States.
Observed daily deaths, smoothed using a loess smoother, are shown as a black line (top). The observed peak in daily deaths is shown with a vertical dashed line (top and bottom). All versions of each model are shown (top), and each model version that was released at least one week prior to the observed peaks has its estimated peak shown with a point (top and bottom). Estimated peaks are shown in the bottom panel (circles) with respect to their predicted peak date (X axis) and model date (Y axis). The grey bands represent the windows prior to each peak within which forecasted peaks were considered, which extend from when the time series began to increase, to 1 week prior to each peak. Values are shown for the United States, and similar graphs for all other locations are available in the Supplementary. Delphi DELPHI-MIT (red), Los Alamos Nat Lab   Los Alamos National Laboratory (blue), Youyang Gu (orange), Imperial   Imperial College London (peach), SIKjalpha   USC SIKJ-alpha (pink), IHME   Institute for Health Metrics and Evaluation (green), UCLA-ML   UCLA Statistical Machine Learning Lab (purple).
Fig. 7
Fig. 7. Peak timing accuracy—median absolute error in days.
The median absolute error in days is shown by the model and the number of weeks of forecasting. Errors only reflect models released at least 7 days before each observed peak in daily mortality. One week of forecasting refers to errors occurring from 7 to 13 days in advance of the observed peak, while 2 weeks refers to those occurring from 14 to 20 days prior, and so on, up to 8 weeks, which refers to 56–62 days prior.
Fig. 8
Fig. 8. Peak timing accuracy by first or subsequent peak.
Median absolute error (A) and median error (B) in days is shown by model and type of peak, either first or subsequent (second or third). Errors only reflect models released at least 7 days before each observed peak in daily mortality. Lighter bars reflect first peaks and darker bars reflect subsequent peaks. Illustrations of first and subsequent peaks can be seen for all locations in the supplementary daily death smoothing figures.

Update of

References

    1. Team, I. C.-19 health service utilization forecasting & Murray, C. J. Forecasting COVID-19 impact on hospital bed-days, ICU-days, ventilator-days and deaths by US state in the next 4 months. Preprint at medRxiv10.1101/2020.03.27.20043752 (2020).
    1. Lu, F. S., Nguyen, A. T., Link, N. B., Lipsitch, M. & Santillana, M. Estimating the early outbreak cumulative incidence of COVID-19 in the United States: three complementary approaches. Preprint at medRxiv10.1101/2020.04.18.20070821 (2020).
    1. Weinberger, D.M. et al. Estimation of Excess Deaths Associated With the COVID-19 Pandemic in the United States, March to May 2020. JAMA Intern Med. 180, 1336–1344 (2020). - PMC - PubMed
    1. Difan, Z. et al. Epidemic model guided machine learning for COVID-19 forecasts in the United States. Preprint at medRxivhttps://www.medrxiv.org/content/10.1101/2020.05.24.20111989v1 (2020). - DOI
    1. Ranney, M. L., Griffeth, V. & Jha, A. K. Critical supply shortages—the need for ventilators and personal protective equipment during the Covid-19 pandemic. N. Engl. J. Med. 382, e41 (2020). - PubMed

Publication types