

Genetic analysis in European ancestry individuals identifies 517 loci associated with liver enzymes
- PMID: 33972514
- PMCID: PMC8110798
- DOI: 10.1038/s41467-021-22338-2
Genetic analysis in European ancestry individuals identifies 517 loci associated with liver enzymes
Abstract
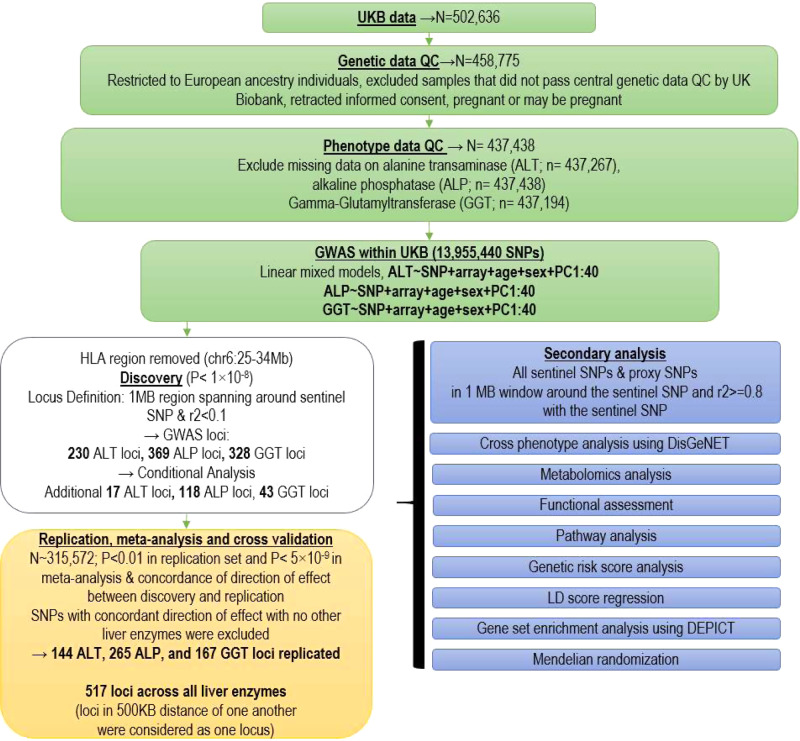
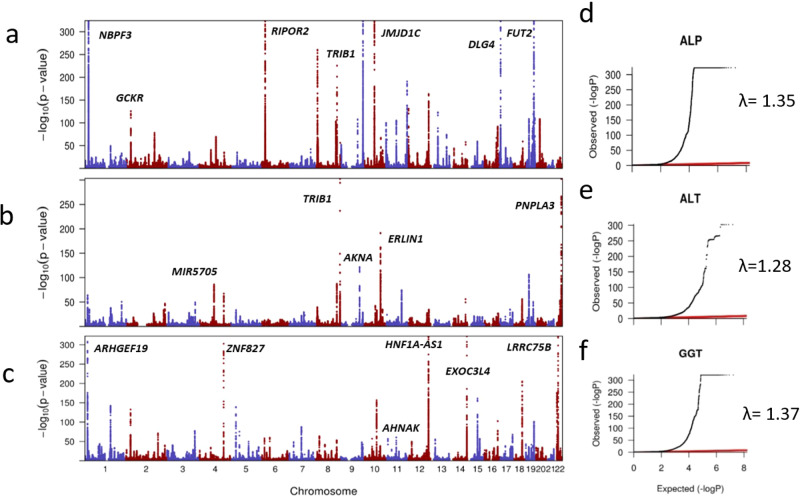
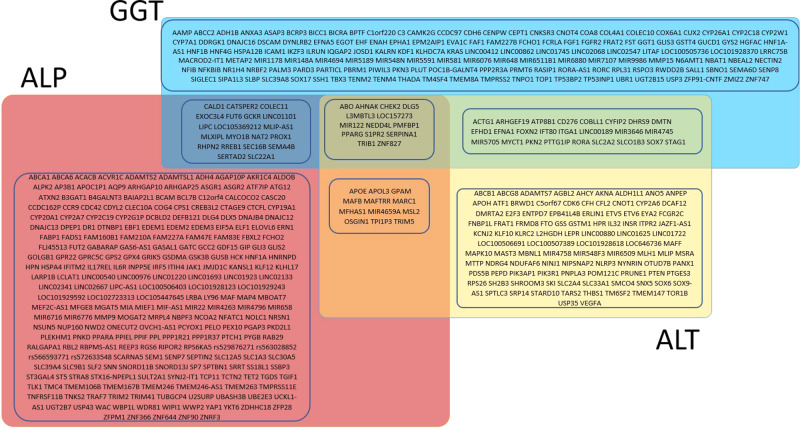
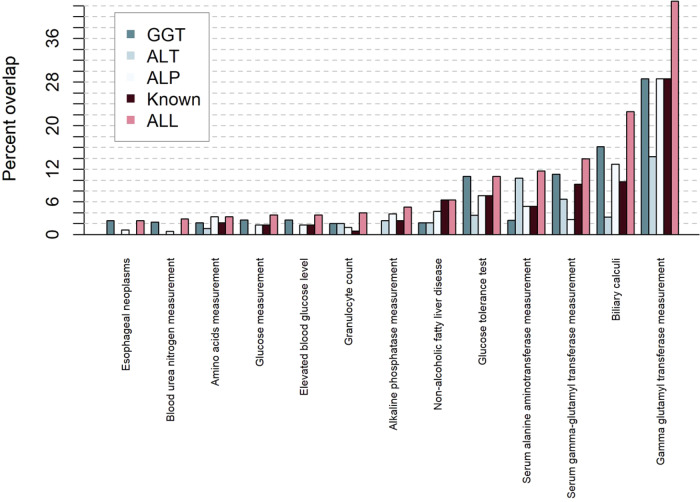
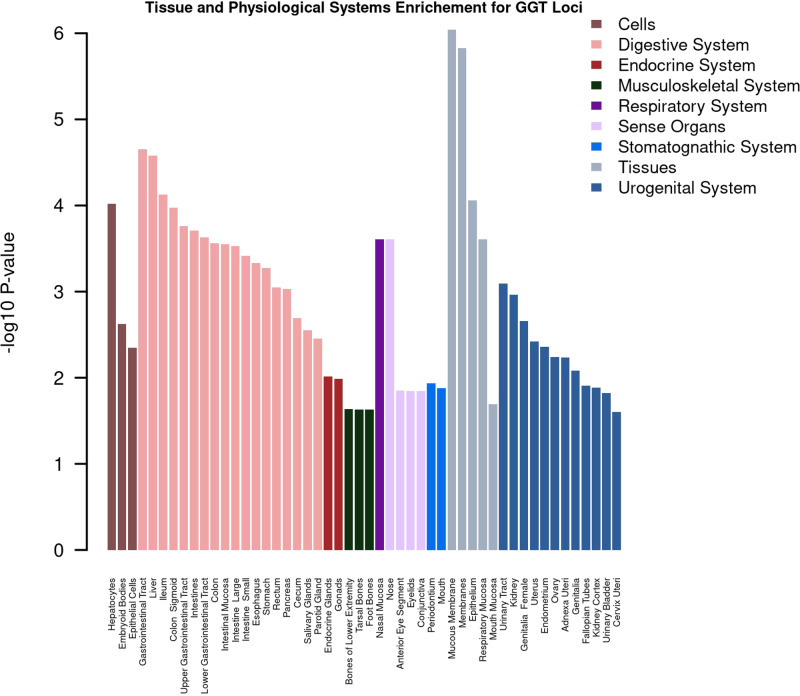
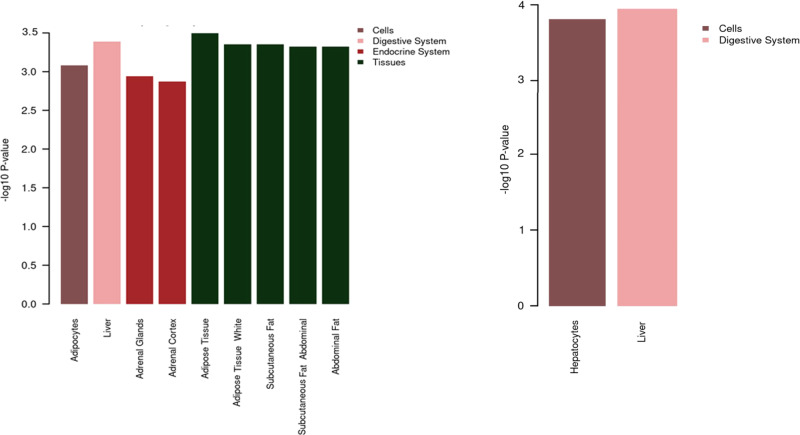
Serum concentration of hepatic enzymes are linked to liver dysfunction, metabolic and cardiovascular diseases. We perform genetic analysis on serum levels of alanine transaminase (ALT), alkaline phosphatase (ALP) and gamma-glutamyl transferase (GGT) using data on 437,438 UK Biobank participants. Replication in 315,572 individuals from European descent from the Million Veteran Program, Rotterdam Study and Lifeline study confirms 517 liver enzyme SNPs. Genetic risk score analysis using the identified SNPs is strongly associated with serum activity of liver enzymes in two independent European descent studies (The Airwave Health Monitoring study and the Northern Finland Birth Cohort 1966). Gene-set enrichment analysis using the identified SNPs highlights involvement in liver development and function, lipid metabolism, insulin resistance, and vascular formation. Mendelian randomization analysis shows association of liver enzyme variants with coronary heart disease and ischemic stroke. Genetic risk score for elevated serum activity of liver enzymes is associated with higher fat percentage of body, trunk, and liver and body mass index. Our study highlights the role of molecular pathways regulated by the liver in metabolic disorders and cardiovascular disease.
Conflict of interest statement
D.G. declares part-time employment by Novo Nordisk. The other authors declare no competing interests.
Figures
References
-
- Harris R, Harman DJ, Card TR, Aithal GP, Guha IN. Prevalence of clinically significant liver disease within the general population, as defined by non-invasive markers of liver fibrosis: a systematic review. Lancet Gastroenterol. Hepatol. 2017;2:288–297. doi: 10.1016/S2468-1253(16)30205-9. - DOI - PubMed
-
- Tilg, H. & Effenberger, M. From NAFLD to MAFLD: when pathophysiology succeeds. Nat. Rev. Gastroenterol. Hepatol. 17, 387–388 (2020). - PubMed
Publication types
MeSH terms
Substances
Grants and funding
- MR/L01341X/1/MRC_/Medical Research Council/United Kingdom
- R01 AA026302/AA/NIAAA NIH HHS/United States
- MR/R026505/2/MRC_/Medical Research Council/United Kingdom
- R56 DK101478/DK/NIDDK NIH HHS/United States
- MC_QA137853/MRC_/Medical Research Council/United Kingdom
- K23 DK115897/DK/NIDDK NIH HHS/United States
- DH_/Department of Health/United Kingdom
- MR/S019669/1/MRC_/Medical Research Council/United Kingdom
- I01 BX003362/BX/BLRD VA/United States
- R01 HG010067/HG/NHGRI NIH HHS/United States
- MR/R023484/1/MRC_/Medical Research Council/United Kingdom
- R01 HL087679/HL/NHLBI NIH HHS/United States
- MR/R0265051/1/MRC_/Medical Research Council/United Kingdom
- SP/13/2/30111/BHF_/British Heart Foundation/United Kingdom
- R01 DK101478/DK/NIDDK NIH HHS/United States
- MC_PC_17228/MRC_/Medical Research Council/United Kingdom
- RL1 MH083268/MH/NIMH NIH HHS/United States
- MR/S03658X/1/MRC_/Medical Research Council/United Kingdom
- MR/L01632X/1/MRC_/Medical Research Council/United Kingdom
LinkOut - more resources
Full Text Sources
Other Literature Sources
Medical
Miscellaneous
