. 2021 May 10;12(1):2605.
doi: 10.1038/s41467-021-22798-6.

Breathing-driven prefrontal oscillations regulate maintenance of conditioned-fear evoked freezing independently of initiation

Affiliations

Breathing-driven prefrontal oscillations regulate maintenance of conditioned-fear evoked freezing independently of initiation

Sophie Bagur et al. Nat Commun. .

Abstract

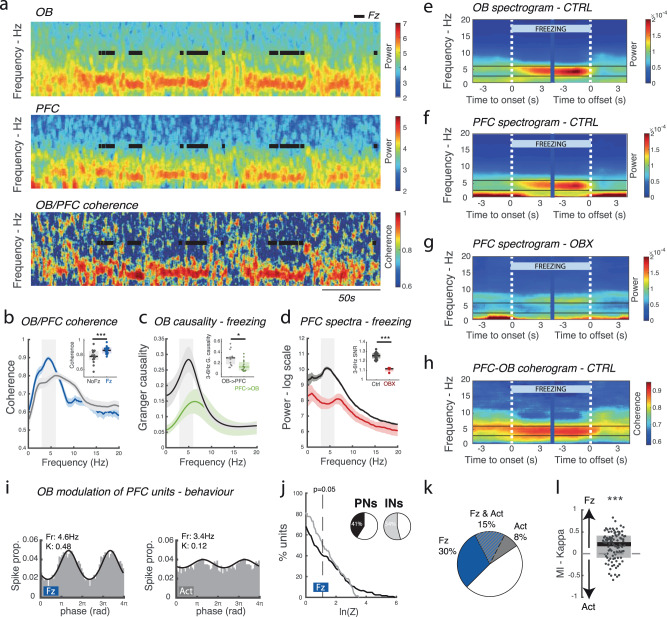
Brain-body interactions are thought to be essential in emotions but their physiological basis remains poorly understood. In mice, regular 4 Hz breathing appears during freezing after cue-fear conditioning. Here we show that the olfactory bulb (OB) transmits this rhythm to the dorsomedial prefrontal cortex (dmPFC) where it organizes neural activity. Reduction of the respiratory-related 4 Hz oscillation, via bulbectomy or optogenetic perturbation of the OB, reduces freezing. Behavioural modelling shows that this is due to a specific reduction in freezing maintenance without impacting its initiation, thus dissociating these two phenomena. dmPFC LFP and firing patterns support the region's specific function in freezing maintenance. In particular, population analysis reveals that network activity tracks 4 Hz power dynamics during freezing and reaches a stable state at 4 Hz peak that lasts until freezing termination. These results provide a potential mechanism and a functional role for bodily feedback in emotions and therefore shed light on the historical James-Cannon debate.


Conflict of interest statement

The authors declare no competing interests.

Figures

Fig. 1
Fig. 1. During freezing, regular 4 Hz breathing entrains the olfactory bulb.
a Experimental protocol and behavioural results: median percentage of time spent freezing for all mice during the CS− and CS+, grouped as blocks of four sounds (4CS− followed by 12 CS+). Sound block significantly affected freezing rates (Friedman test: X2(3) = 19.6, p = 2.01e−4). Post-hoc analysis revealed significant differences of the CS+ blocks compared to the CS− block (Wilcoxon signed-rank test: Signed Rank statistic = 0,14,23; p = 6e−5, 0.0067, 0.0353, n = 15). b Illustrative example of breathing activity as recorded in the plethysmograph and OB and dmPFC LFPs during exploratory and freezing periods. Note the striking regularity and synchronicity in the 3–6 Hz range in all three time courses during freezing. c Distribution of breathing frequencies recorded in the plethysmograph during freezing and non-freezing periods. (n = 6). d Mean breathing tidal volume during freezing and non-freezing periods. (Paired Wilcoxon signed-rank test: Signed Rank statistic = 0, p = 0.0312, n = 6). e, f Variability of breathing frequency and tidal volume during freezing and non-freezing periods. (Paired Wilcoxon signed-rank test: Signed Rank statistic = 0,0; p = 0.0312, 0.0312, n = 6). g Averaged OB LFP power spectra during freezing (blue) and non-freezing (grey) periods. Error bars are SEM. Inset: average signal-to-noise ratio of 3–6 Hz band during freezing and non-freezing periods. The signal to noise ratio is defined as the ratio between power in the band of interest to the power in the rest of the spectrum. (Paired Wilcoxon signed-rank test: Signed Rank statistic = 0, p = 6.10e−4, n = 15). h Averaged coherence between breathing and the OB during freezing (blue) and non-freezing (grey) periods. Error bars are SEM. Inset: average coherence of 3–6 Hz band during freezing and non-freezing periods. (Paired Wilcoxon signed-rank test: Signed Rank statistic = 0, p = 0.0312, n = 6). In all panels, boxplots show the median and interquartile.
Fig. 2
Fig. 2. Breathing-related OB 4 Hz organizes neural firing in the dorsomedial prefrontal cortex during freezing.
a Representative spectrogram of OB and dmPFC activity and associated coherogram during a test session. Note the prominent 4 Hz oscillation in both structures during freezing epochs (black lines). b Averaged coherence between the OB and dmPFC during freezing (blue) and non-freezing (grey) periods. Error bars are SEM. Inset: average coherence of 3–6 Hz band. (Paired Wilcoxon signed-rank test: Signed Rank statistic = 1, p = 6.1e−5, n = 15). c Averaged Granger causality during freezing from OB to dmPFC (black) and from dmPFC to OB (green). Error bars are SEM. Inset: mean Granger causality in the 3–6 Hz band. (Paired Wilcoxon signed-rank test: Signed Rank statistic = 97, p = 0.0353, n = 15). d Averaged power spectra during freezing in sham (black) and bulbectomized (OBX) (red) mice. Error bars are SEM. Inset: signal-to-noise ratio of 3–6 Hz band during freezing periods. (Wilcoxon rank-sum test: Signed Rank statistic = 180, p = 5.1e−4, n = 15 and n = 4). e Averaged OB spectrogram triggered on freezing onset and offset in control mice. Note the appearance of strong activity in the 4 Hz band. f, g As in (e) for the dmPFC in control (f) and bulbectomized (g) mice. Note the appearance of 4 Hz in control but not in bulbectomized mice. h Averaged dmPFC-OB coherogram triggered on freezing onset and offset in control mice. i Phase histograms of an example dmPFC unit modulation by OB LFP showing clear gain in phase locking during freezing (left) relative to active (right) epochs. j Cumulative distribution of log-transformed Rayleigh’s test Z of dmPFC putative principal neurons (PNs) and interneurons (INs) modulation by OB LFP. Inset: percentage of significantly modulated neurons using Rayleigh’s test with p = 0.05. k Percentages of dmPFC units modulated by the OB LFP during active behaviour and during freezing using Rayleigh’s test with p = 0.05. The proportion of OB modulated neurons increases significantly for freezing state. (45% vs 23%, chi2stat = 9.82, p = 0.0017, n = 100 units). l Modulation index of firing rate of all neurons between freezing and active periods. On average units decrease their firing rate during freezing. (One-sample two-sided Wilcoxon signed-rank test with 0: zval = −3.4314, p = 6.0e−04, n = 100 units). In all panels, boxplots show median and interquartile range.
Fig. 3
Fig. 3. 4 Hz respiratory rhythm is specifically involved in the regulation of freezing maintenance.
a Median freezing levels of sham and bulbectomized mice during the test session. (Two-way mixed repeated measures anova: group (p = 0.038, F = 4.73) × CS block (p < 0.0001, F = 23.7), interaction (p = 0.0065, F = 4.83). Post-hoc Wilcoxon rank-sum on each block: zval = 2.28, 2.22, 1.53, 0.33; p = 0.022, 0.026, 0.1239, 0.73, n = 16, 14; effect size for significant differences: 0.77, 0.97). b Median freezing levels of GFP- and ChR2- mice during the test session. (Wilcoxon signed-rank test: Signed Rank statistic = 16, 28, p = 0.813, 0.016, n = 7, 7; effect size for ChR2 with/without stimulation: 2.08; effect size ChR2 vs GFP during stimulation: 1.2). Top: OB LFP raw trace (1, 75 s) at onset of laser stimulation. c Markov model of freezing behaviour. At each time step, depending on the current state (Fz or Act), the next state is randomly selected according to fixed probabilities. d Duration of active and freezing bouts during 13 Hz laser stimulation for ChR2 and GFP mice. (Wilcoxon rank-sum test: rank-sum value = 42, 71,: p = 0.2, 0.017; n = 7, 7). e Number of freezing bouts during 13 Hz laser stimulation in the test session. The number of freezing bouts for ChR2 mice predicted by Markov chain model is obtained using PFz/Fz fitted to laser stimulation data but keeping PAct/Act at the laser-off value. This shows that the change in PFz/Fz is sufficient to predict the increase in freezing bouts. (Wilcoxon rank-sum test GFP vs ChR2: value = 36.5: p = 0.037; n = 7, 7). f Duration of active and freezing bouts and frequency of freezing bout initiation for sham and OBX mice. (Wilcoxon rank-sum test: rank-sum value = 219, 312: p = 0.23, 0.0083; n = 16, 14). g, h Cumulative distribution of active (g) and freezing (h) bout lengths during CS+ presentations during 13 Hz laser stimulation. Note the upwards shift of the freezing bout duration curve for ChR2 relative to GFP mice and the disappearance of episodes longer than 30 s. See Fig. S9C for laser-off distributions. i, j Cumulative distribution of active (i) and freezing (j) bout lengths during the whole test session. As in (g, h) active bout durations are similar but freezing bout duration is reduced. In all panels, boxplots show median and interquartile range.
Fig. 4
Fig. 4. Stronger 4 Hz power is linked to more sustained and stable freezing episodes.
a OB spectrogram (top) and mean power in the 4 Hz band (bottom) triggered on freezing periods of normalized duration for all mice. Note the asymmetric rise and fall of 4 Hz power during the freezing bout with a gradual onset and steep offset. (n = 15 mice). b, d OB 4 Hz power (b) and head acceleration (d) triggered on onset (left, orange) and offset (right, purple) of freezing bouts. Both measures are normalized between 0 and 1. Black bar indicates the standard deviation at the midpoint. (n = 11, 11 mice, only mice with sufficient number of 4 s bouts of freezing are retained). c, e Slope of onset and offset curves of and OB 4 Hz power (c) head acceleration (e) to quantify the difference in transition speed, estimated using a sigmoid fit. (Wilcoxon rank-sum: zval = −3.61, −0.32; p = 3e−3, 0.74, n = 11). f Density of micromovements during freezing periods of normalized duration showing that they decrease throughout the episode, following a similar dynamic to 4 Hz increase. These small head movements are detectable using head accelerometer only but are not readily visible on video measurements and often coincide with the bips of the CS. (n = 11 mice). Error bars are SEM. g The amplitude of the micromovements elicited by CS pips is correlated with the instantaneous 4 Hz power. (Pearson correlation: R = −0.56, p = 2.3e−54, n = 578 movements from 11 mice). Error bars are SEM. h Averaged OB spectra during short (<10 s) and long (>10 s) freezing periods showing stronger 4 Hz during long episodes. Error bars are SEM. Inset: average signal-to-noise ratio of 3–6 Hz band during short and long episodes. (Paired Wilcoxon signed-rank test: Signed Rank statistic = 0, p = 2.44e−4, n = 13). In all panels, boxplots show median and interquartile range.
Fig. 5
Fig. 5. Dorsomedial prefrontal units entrained by olfactory bulb 4 Hz display stronger sustained and offset responses to freezing.
a Z-scored response of dmPFC units to freezing onset and offset ordered by average sustained response. White lines delimit the three groups in (d, e, f) (n = 134 units). b, c First two principal components of dmPFC units response to freezing showing the sustained response (PC1: 17% of variance) and the transition response (PC2: 4% of variance). df: i: Average response of each group of units. ii: Average response at freezing onset and offset. For both groups modulated by freezing, the amplitude of response is stronger at offset than at onset (Wilcoxon signed-rank test: zval statistic = −4.49, −0.65, 2.89, p = 6.9E−6, 0.55, 0.0038, n = 63, 53, 18). Error bars are SEM. iii: Percent of significantly modulated units by OB 4 Hz. The freezing responsive groups of neurons contain a significantly larger proportion of modulated units. (Chi2 test 57% vs 36%, chi2stat = 6.03, p = 0.0140, n = 71 & 63 units, 57%: grouped percentage from group 1 and 3). iv: Phase histogram of preferred OB 4 Hz firing phase showing different preferred phase for the two freezing responsive groups (Non-parametric comparison for equal medians: Circ-stat = 5.8, p = 0.05). g Z-scored response of 4 Hz modulated (black) and non-4Hz modulated (grey) dmPFC units from control animals and of all units from bulbectomized animals (red) during normalized freezing episode. Error bars are SEM. (n = 91, 43, 29). All responses were sign-corrected to allow averaging of amplitude. h Averaged onset, sustained and offset freezing-responses (absolute value) for modulated, non-modulated and bulbectomized units. (Wilcoxon rank-sum test: Onset: Z-val statistic = 0.12, 1.11, 1.46, p = 0.9, 0.26, 0.14; Sustained: Z-val statistic = 2.1, 3.7, 1.68, p = 0.0002, 0.091, 0.03; Offset: Z-val statistic = 1.9, 2, 4.8, p = 7E−6, 0.045, 0.014, n = 91, 43, 29). i Temporal correlation matrix of dmPFC population vector before, throughout and after freezing. j Average correlation of dmPFC population vector with the population vector at onset (orange box in i) and offset (purple box in i) and average 4 Hz power (grey) during a normalized freezing episode. Note that the shift from one type of population activity to another closely parallels the change in 4 Hz power.
Fig. 6
Fig. 6. Proposed model of brain–body–brain feedback loop of emotional initiation and maintenance.
An emotive stimulus evokes responses in the amygdala and periaqueductal grey (PAG) which lead to changes in behaviour (freezing) and somatic physiology (breathing). The 4 Hz breathing entrains the OB which in turn organizes neural firing in the dmPFC which allows to maintain the ongoing behaviour, perhaps via its connections with the amygdala for example. The dotted line between the OB and dmPFC indicates that this connection is unlikely to be monosynaptic and has not been well described. Image credit: Allen Institute.

Similar articles

Cited by

References

    1. Feldman JL, Del Negro CA. Perspectives on respiratory rhythm. Neurosci. 2006;7:232–242. - PMC - PubMed
    1. Homma I, Masaoka Y. Breathing rhythms and emotions. Exp. Physiol. 2008;93:1011–1021. doi: 10.1113/expphysiol.2008.042424. - DOI - PubMed
    1. Dutschmann M, Dick TE. Pontine mechanisms of respiratory control. Compr. Physiol. 2012;2:2443–2469. - PMC - PubMed
    1. Kepecs A, Uchida N, Mainen ZF. Rapid and precise control of sniffing during olfactory discrimination in rats. J. Neurophysiol. 2007;98:205–213. doi: 10.1152/jn.00071.2007. - DOI - PubMed
    1. Subramanian, H. H. & Holstege, G. in Progress in Brain Research, Vol. 212, 351–384 (Elsevier B.V., 2014). - PubMed

Publication types

MeSH terms