. 2021 May 10;12(1):2589.
doi: 10.1038/s41467-021-22770-4.

RHOA signaling defects result in impaired axon guidance in iPSC-derived neurons from patients with tuberous sclerosis complex

Affiliations

RHOA signaling defects result in impaired axon guidance in iPSC-derived neurons from patients with tuberous sclerosis complex

Timothy S Catlett et al. Nat Commun. .

Abstract

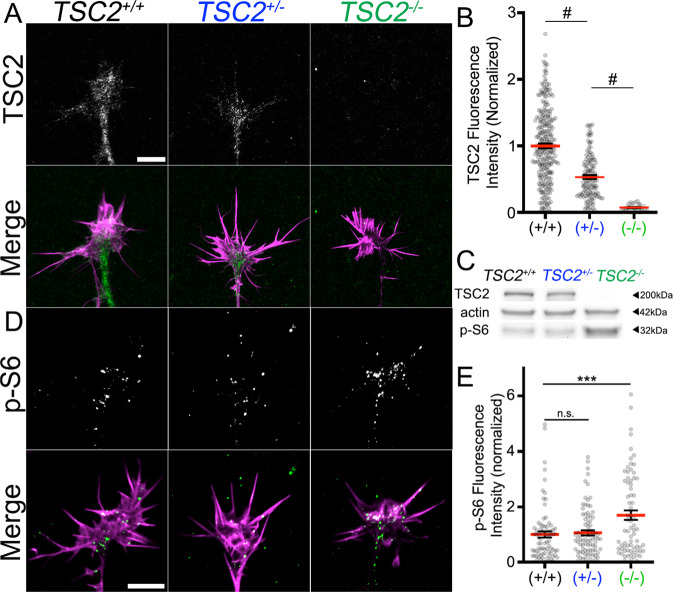
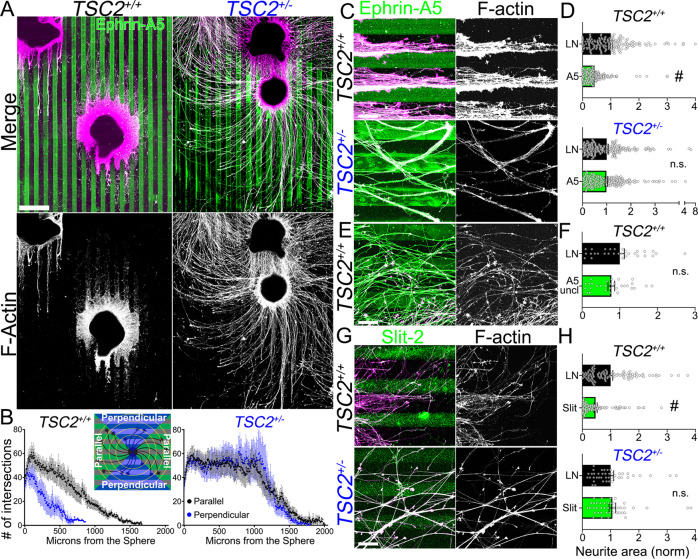
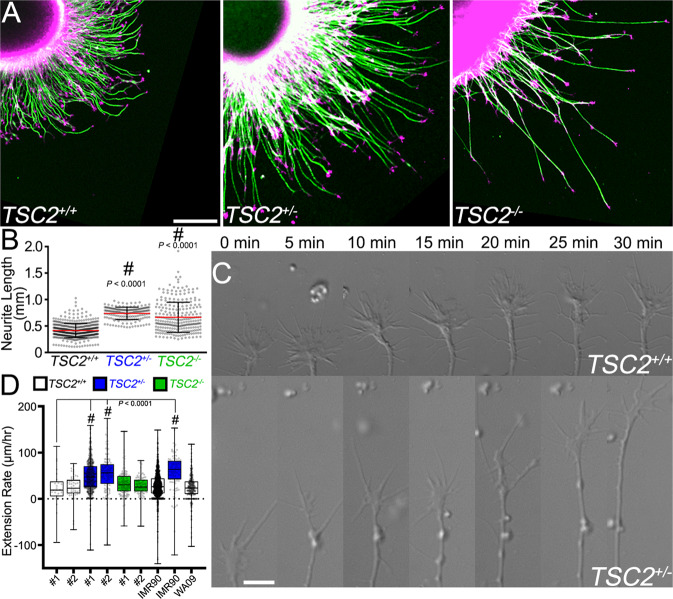
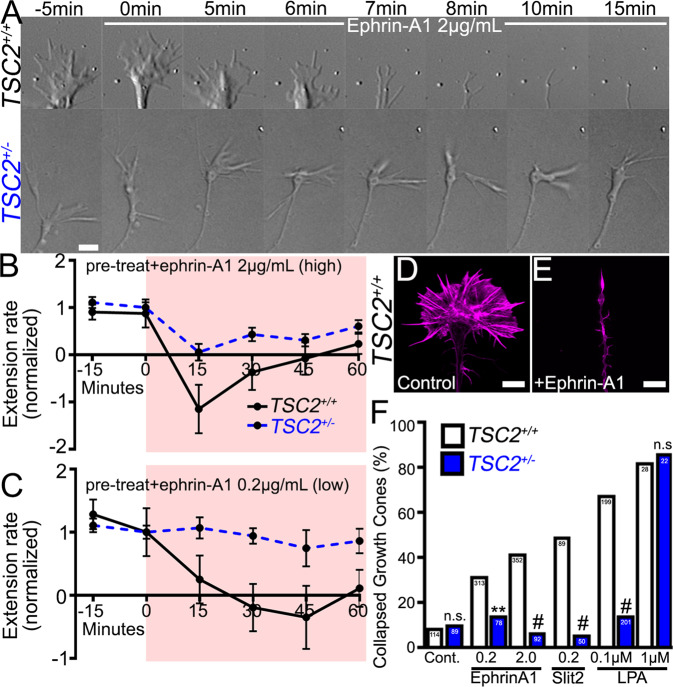
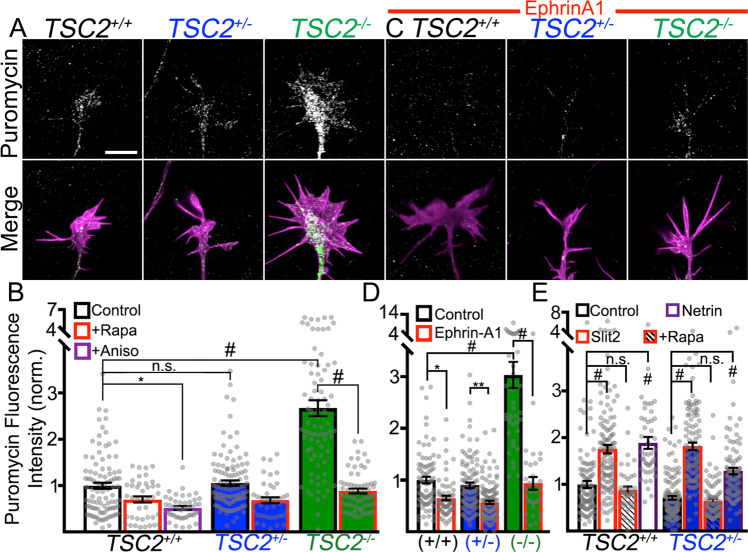
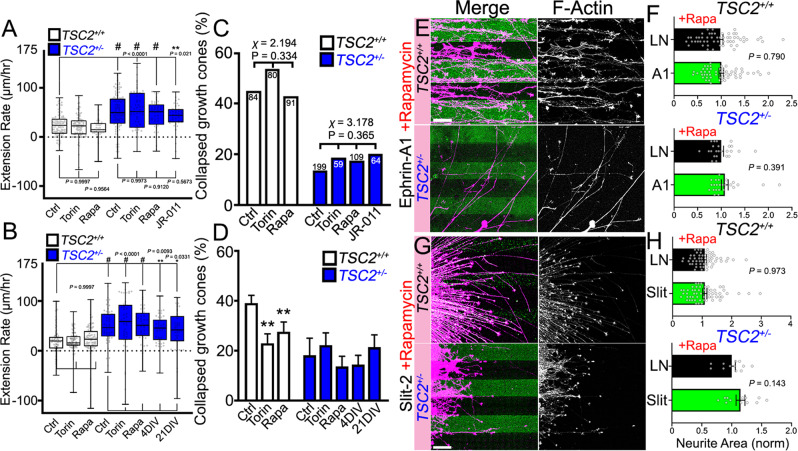
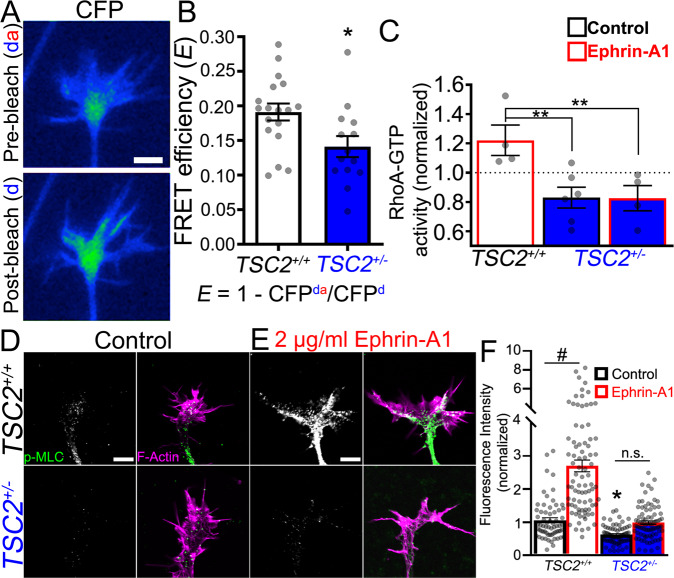
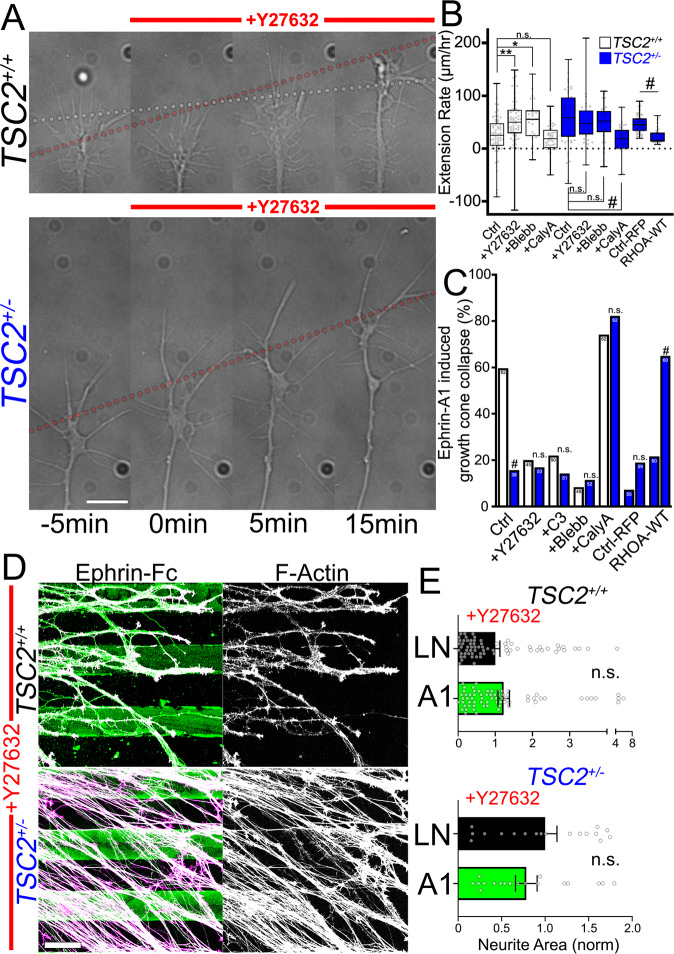
Patients with Tuberous Sclerosis Complex (TSC) show aberrant wiring of neuronal connections formed during development which may contribute to symptoms of TSC, such as intellectual disabilities, autism, and epilepsy. Yet models examining the molecular basis for axonal guidance defects in developing human neurons have not been developed. Here, we generate human induced pluripotent stem cell (hiPSC) lines from a patient with TSC and genetically engineer counterparts and isogenic controls. By differentiating hiPSCs, we show that control neurons respond to canonical guidance cues as predicted. Conversely, neurons with heterozygous loss of TSC2 exhibit reduced responses to several repulsive cues and defective axon guidance. While TSC2 is a known key negative regulator of MTOR-dependent protein synthesis, we find that TSC2 signaled through MTOR-independent RHOA in growth cones. Our results suggest that neural network connectivity defects in patients with TSC may result from defects in RHOA-mediated regulation of cytoskeletal dynamics during neuronal development.


Conflict of interest statement

The authors declare no competing interests.

Figures

Fig. 1
Fig. 1. Growth cones of hFB neurons differentiated and TSC2 patient iPSCs have reduced TSC2 expression and increased MTOR signaling.
A hFB neuronal growth cones of indicated genotype immunolabeled for TSC2 (green) and counter-stained for F-actin (magenta) in the merge. Note the complete absence of TSC2 in the null growth cone. B Average fluorescence intensity values of TSC2 in all measured growth cones. C Western blots from extracted hFB neurospheres of each genotype showed similar reduction and absence of TSC2 in heterozygous and null TSC2 lines, respectively. Western blots also showed increased phospho-S6 (p-S6), a downstream target of mTORC1, only in TSC2−/− neurons, while total S6 was unchanged (repeated with similar results across three independent differentiations). D hFB neuronal growth cones of indicated genotype immunolabeled for p-S6 (green) and counter-stained for F-actin (magenta) in the merge. E Fluorescence intensity values of phospho-S6 immunofluorescence in all measured growth cones. Note that similar to Western blot results, P-S6 was elevated only in TSC2−/− growth cones (TSC2+/+ vs. TSC2+/−, P = 0.94, TSC2+/+ vs. TSC2−/−, P = 0.0004). ***P < 0.001, #P < 0.0001, One-way ANOVA with Tukey’s Multiple Comparison, represented as mean +/− SEM. Scale, 5 µm. Additional data on all experimental groups in Supplementary Information.
Fig. 2
Fig. 2. Pathfinding by control cortical neurons along ephrin-A5 and Slit-2 repulsive stripes is abnormal in TSC2+/− neurons.
A hFB neurospheres were cultured for three days on parallel stripes of Fc-tagged ephrin-A5 and laminin (LN), then fixed and stained for anti-Fc (green in merges) and F-actin (magenta in merges). Note that anti-Fc antibody cross-reacts with neurites, making processes appear white in the merge. Many TSC2+/+ neurites extended upon LN, parallel to the pattern while avoiding the ephrin-A5 stripes. On the other hand, TSC2+/− hFB neurites showed little substratum preference, crossing ephrin-A5 containing lanes repeatedly (repeated in 8 (TSC2+/+) and 10 (TSC2+/−) neurospheres across 4 differentiations; see Supplementary Information for additional data). B Modified Sholl analysis measures neurite crossings of concentric circles every 10 µm away from sphere edge, with data binned by quadrant for neurites extending parallel and perpendicular to stripes (inset). Graphs show mean +/− SEM of 8 and 10 independent TSC2+/+ and TSC2+/− neurospheres, respectively. Note long TSC2+/− neurites extended equally well in all directions from spheres. C, D High magnification images of LN/ephrin-A5 patterns (C) and analysis (D) of the thresholded area occupied by neurites (F-actin channel) on each substratum normalized to the area of neurites growing on laminin only (TSC2+/+ ephrin-A5 vs. laminin, P < 0.0001, TSC2+/− ephrin-A5 vs. laminin, P = 0.85) (see “Methods” section). E, F TSC2+/+ hFB neurites grown on unclustered ephrin-A5 controls were not guided (P = 0.14). G, H. Similar images and analysis for LN/Slit-2 patterns. Note that TSC2+/+ neurites were robustly guided by Slit-2 (P < 0.0001), while TSC2+/− neurites failed to guide (P = 0.69). #P < 0.0001, Two-tailed Student’s t-test, represented as mean +/− SEM. Scale, 500 µm (A), 100 µm (CG).
Fig. 3
Fig. 3. TSC2 patient cortical neurons exhibit enhanced neurite extension compared to isogenic control neurons.
A hFB neurospheres of indicated genotype after one day in vitro immunolabeled for Acetylated-tubulin (green) and counter-stained for F-actin (magenta). Note longer axons extend from both TSC2+/− and TSC2−/−neurospheres compared to isogenic control neurons. B Average neurite lengths of 20 longest axons per neurosphere of each genotype (TSC2+/+ vs. TSC2+/− and TSC2+/+ vs. TSC2−/−, P < 0.0001). C Live cell, differential interference contrast (DIC) imaging of growing axons from TSC2+/+ and TSC2+/− hFB neurons at 5 min time intervals. D Average axon extension rates show that TSC2+/− hFB neurites grew markedly faster compared to isogenic control neurons and TSC2 null neurons, as well as hFB neurons differentiated from unrelated control iPSCs (IMR90) and ESCs (WA09). CRISPR-Cas9-generated IMR90TSC2+/− neurites also grew at similar rates as patient-derived neurites (TSC2+/+ clone 1 vs. TSC2+/− clone 1, TSC2+/+ clone 1 vs. TSC+/− clone 2, TSC2+/+ clone 1 vs. IMR90TSC2+/−, IMR90TSC2+/− vs. IMR90TSC2+/+, IMR90TSC2+/− vs. WA09, P < 0.0001). #P < 0.0001, One-way ANOVA with Tukey’s Multiple Comparison, represented as mean +/− SEM (B), and min, max, median, and IQR (D). Scale, 100 µm (A), 5 µm (C).
Fig. 4
Fig. 4. TSC2+/− neurites are less sensitive to inhibitory guidance factors.
A TSC2+/+ and TSC2+/− hFB neurons were acutely treated with ephrin-A1 (2 µg/mL) over indicated time. Note the rapid collapse of the TSC2+/+ growth cone, but only pausing of the TSC2+/− growth cone. B, C. Neurite extension rates normalized to pre-application extension rates for high (B) and low dose ephrin-A1 (C). In response to 2 µg/ml ephrin-A1, TSC2+/+ neurites retracted within minutes and rarely restored outgrowth, while TSC2+/− neurites only transiently paused extension. In response to 0.2 µg/ml ephrin-A1, TSC2+/+ neurites slowly retracted while TSC2+/− neurites showed little effect. D, E F-actin labeled TSC2+/+ hFB growth cones fixed 15 min after control treatment (D) or 2 µg/ml ephrin-A1 (E). F Analysis of percent growth cone collapse by TSC2+/+ and TSC2+/− hFB neurons in response to ephrin-A1 (media control: TSC2+/+ vs. TSC2+/−, P = 0.811; low dose: TSC2+/+ vs. TSC2+/−, P = 0.018; high dose: TSC2+/+ vs. TSC2−/−, P < 0.0001) and Slit-2 (in µg/ml) (TSC2+/+ vs. TSC2−/−, P < 0.0001), as well as LPA (in µM) (low dose: TSC2+/+ vs. TSC2+/−, P < 0.0001; high dose: TSC2+/+ vs. TSC2−/−, P = 0.999). Control growth cones collapsed as in (E) approximately 40% of the time (352 growth cones imaged across 26 neurospheres). TSC2+/− growth cones failed to collapse in response to the repulsive cue Slit-2 or to a low dose of the GPCR ligand and RHOA pathway activator lysophosphatidic acid (LPA) (100 nM). A higher dose of LPA (1 µM) induced collapse in TSC2+/− growth cones. **P < 0.01, #P < 0.0001, Two-tailed Fisher’s Exact Test. Scale, 5 µm.
Fig. 5
Fig. 5. TSC2+/+ and TSC2+/− cortical growth cones modulate protein synthesis in response to cues.
A Puromycin labeled growth cones (green in merges) of indicated genotypes counter-stained for F-actin (magenta in merges). Puromycin-labeled proteins were detected with anti-puromycin antibodies (see “Methods” section). B Normalized fluorescence intensities (to untreated control growth cones) show that basal local protein synthesis (LPS) rates were not significantly different between TSC2+/+ and TSC2+/− hFB growth cones (P = 0.999), while TSC2−/− growth cones show a marked increase in LPS (TSC2+/+ vs. TSC2−/−, P < 0.0001). LPS was inhibited with 30 min pre-incubation of anisomycin (40 nM) (P = 0.015), and rapamycin incubation restored the rate of LPS by TSC2−/− neurons down to control levels (Rapa groups: TSC2+/+, P = 0.40; TSC2+/−, P = 0.08; TSC2−/−, P < 0.0001). C, D LPS within the growth cones was significantly reduced by EphrinA1 (2 µg/mL) treatment in all genotypes (Ephrin-A1: TSC2+/+, P = 0.028; TSC2+/−, P = 0.007; TSC2−/−, P < 0.0001). E Ten min. treatment with Slit-2 (200 ng/mL) and netrin-1 (100 ng/mL) increased PS in TSC2+/+ and TSC2+/− hFB growth cones (control vs. Slit-2: TSC2+/+, P < 0.0001; TSC2+/−, P < 0.0001; control vs. netrin-1: TSC2+/+, P < 0.0001; TSC2+/−, P < 0.0001). Slit-2-mediated LPS was sensitive to rapamycin in both TSC2+/+ and TSC2+/− hFB growth cones (control vs. Slit-2 + rapamycin: TSC2+/+, P = 0.985; TSC2+/−, P = 0.999). One-way ANOVA with Tukey’s Multiple Comparison, represented as mean +/− SEM. *P < 0.05, **P < 0.001, #P < 0.0001. Scale, 5 µm.
Fig. 6
Fig. 6. The effects of TSC2 loss of function are independent of mTORC1 and mTORC2.
A, B Axon extension rates of TSC2+/+ and TSC2+/− hFB neurons were not significantly affected by mTORC1 or mTORC2 inhibitors that were applied acutely (A, 1 h) (control vs. torin-1: TSC2+/+ P = 0.999; TSC2+/− P = 0.997; control vs. rapamycin: TSC2+/+ P = 0.956; TSC2+/− P = 0.913; control vs. JR-AB2-011: TSC2+/− P = 0.561) or chronically (B, 24 h or as indicated) (control vs. torin-1: TSC2+/+ P = 0.999; TSC2+/− P = 0.999; control vs. rapamycin: TSC2+/+ P = 0.993; TSC2+/− P = 0.999; control vs. rapamycin 4DIV: TSC2+/− P = 0.978, control vs. rapamycin 21DIV: TSC2+/− P = 0.840). mTORC1 was specifically inhibited with acute rapamycin (40 nM), mTORC1/C2 were both inhibited with torin-1 (100 nM), and mTORC2 was specifically inhibited with JR-AB2-011 (1 µM). C Acute MTOR modulation with 30 min pre-incubation had no effect on collapse response of TSC2+/+ growth cones (P = 0.334, χ2 = 2.194, df = 2) and failed to rescue cue response in TSC2+/− growth cones (P = 0.365, χ2 = 3.178, df = 3). D Chronic (24 h) mTOR inhibition with rapamycin (40 nM) or torin-1 (100 nM) reduced the sensitivity of TSC2+/+ growth cones to ephrin-A1 (P = 0.012, χ2 = 8.801, df = 2) but did not rescue desensitized TSC2+/− growth cones. Long-term treatment with low dose rapamycin (5 nM) throughout differentiation also failed to modulate the collapse response of TSC2+/− neurons (P = 0.536, χ2 = 3.131, df = 4). EH Analysis of thresholded area occupied by neurites (F-actin channel) normalized to the area of neurites growing on laminin only for ephrin-A1 (E, F) and Slit-2 patterns (G, H), as described previously. Inhibition of MTOR with rapamycin (40 nM) blocked guidance of TSC2+/+ neurites on patterned ephrin-A1 (10 µg/mL) (P = 0.790) and failed to rescue TSC2+/− misguidance (P = 0.391) (E, F). Guidance of TSC2+/+ on patterned Slit-2 was blocked by chronic MTOR inhibition with rapamycin (P = 0.973) and rapamycin failed to rescue TSC2+/− misguidance (P = 0.143) (G, H). One-way ANOVA with Tukey’s Multiple Comparison (AB), chi-squared test (CD), or Two-tailed Student’s t-test (F and H), data represented as min, max, median, and IQR (A, B), and mean +/− SEM (F, H). *P < 0.01, **P < 0.01, #P < 0.0001. Scale, 100 µm.
Fig. 7
Fig. 7. TSC2+/− neurons have reduced RHOA-ROCK-MLC signaling.
A CFP (donor) fluorescent images of RHOA FRET sensor-expressing control hFB growth cone before (above) and after YFP (acceptor) bleaching. B Analysis of FRET efficiency in TSC+/+ compared to TSC+/− growth cones (P = 0.0148). C Analysis of RHOA activity by G-LISA in whole TSC2+/+ and TSC2+/− neurospheres treated with Ephrin-A1. RHOA activity was normalized to untreated control neurons. Active RHOA was significantly increased in TSC2+/+ neurons in response to Ephrin-A1 (2 µg/mL) compared to TSC2+/− neurons (ephrin-A1 vs. ephrin-A1: P = 0.0099, TSC2+/+ ephrin-A1 vs. TSC2+/− control: P = 0.0053) Note that basal RHOA activity also trended 20% lower in TSC2+/− compared to TSC2+/+ neurospheres (control vs. control, P = 0.254). n = 6 independent sets of 30 neurospheres of each genotype for each control group and 4 independent sets of 30 neurospheres for each ephrin-A1 treated group. D, E hFB neuronal growth cones of indicated genotype immunolabeled for p-MLC (green in merge) and counterstained for F-actin (magenta in merge) in control (D) and after ephrin-A1 stimulation (E). Note TSC2+/− growth cones show significantly lower basal p-MLC labeling relative to control (P = 0.0452). TSC2+/+ neurons treated for 5 min with ephrin-A1 show a robust increase in p-MLC (P < 0.0001), but TSC2+/− growth cones show little change in p-MLC in response to ephrin-A1 (P = 0.0910). F Fluorescence intensity measurements normalized to untreated control neurons for each condition. One-way ANOVA with Tukey’s Multiple Comparison (C and F) or Two-tailed Student’s t-test (B), represented as mean +/− SEM. *P < 0.05, **P < 0.01, #P < 0.0001. Scale, 5 µm.
Fig. 8
Fig. 8. RHOA pathway modulation phenocopies and rescues TSC2+/− phenotypes.
A DIC images of growing axons from TSC2+/+ and TSC2+/− hFB neurons at 5 min time intervals during treatment with ROCK inhibitor Y-27632 (10 µM). Note that inhibition of ROCK increased TSC2+/+ neurite extension rates to a level similar to TSC2+/− neurites, while TSC2+/− neurites did not respond to ROCK inhibitor. Dashed gray line indicates extension rate of control neurons before treatment, while dashed red lines indicate extension rates for TSC2+/− neurons (before and after treatment) and TSC2+/+ neurons after treatment. B. Neurite extension rate measurements before and after inhibition of ROCK (Y-27632) and myosin-II with blebbistatin (Blebb, 50 µM) in TSC2+/+ and TSC2+/− neurons shows TSC2+/+ neurite outgrowth accelerated upon ROCK (control vs. ROCK: TSC2+/+, P = 0.0035; TSC2+/−, P = 0.995) and myosin-II inhibition (control vs. blebbistatin: TSC2+/+, P = 0.0484; TSC2+/−, P = 0.971). Conversely, activation of MLC with the phosphatase inhibitor CalyculinA (200 pM) slowed neurite extension in TSC2+/− neurons to a rate comparable to basal TSC2+/+ neurons (TSC2+/+ control vs. CalyculinA: P = 0.996; TSC2+/+ control vs. TSC2+/− CalyculinA: P = 0.995; TSC2+/− control vs. TSC2+/− CalyculinA: P < 0.0001). Similarly, TSC2+/− neurons over-expressing RHOA-WT-RFP exhibited reduced axon outgrowth rates vs. control-RFP expression (P < 0.0001). C Ephrin-A1 mediated collapse of TSC2+/+ growth cones was prevented by inhibition of RHOA (C3 transferase, 2 µg/mL) (ephrin-A1: TSC2+/+ vs. TSC2+/−: P < 0.0001, ephrin-A1 + C3: TSC2+/+ vs. TSC2+/−: P < 0.80), myosin-II (Blebb, 50 µM) ephrin-A1 + blebbistatin: TSC2+/+ vs. TSC2+/−: P < 0.31), and ROCK (Y-27632, 10 µM) ephrin-A1 + Y-27632: TSC2+/+ vs. TSC2+/−: P < 0.74). Conversely, activation of MLC with a low dose of calyculinA (200pM) rescued ephrin-A1 induced collapse by TSC2+/− growth cones (ephrin-A1 + CalyculinA: TSC2+/+ vs. TSC2+/−: P < 0.38), as did RHOA-WT over-expression (TSC2+/− control-RFP control vs. ephrin-A1: P = 0.0974; TSC2+/− RHOA-WT control vs. ephrin-A1: P < 0.0001). D Treatment with Y-27632 blocked TSC2+/+ axon guidance on ephrin-A1 stripes (P = 0.259) but had no additional effect on TSC2+/− neurons (P = 0.251). One-way ANOVA with Tukey’s Multiple Comparison (B), Two-tailed Fisher’s Exact Test (C), or Two-tailed Student’s t-test (E), data represented as min, max, median, and IQR (B), and mean +/− SEM (E). *P < 0.05, #P < 0.0001. Scale, 5 µm (A) and 100 µm (D).

Similar articles

Cited by

References

    1. Gallo G, Letourneau PC. Regulation of growth cone actin filaments by guidance cues. J. Neurobiol. 2004;58:92–102. doi: 10.1002/neu.10282. - DOI - PubMed
    1. Lowery, L. A. & Vactor, D. Van. The trip of the tip: understanding the growth cone machinery. Nat. Rev. Mol. Cell Biol. 10, 332–343 (2009). - PMC - PubMed
    1. Dent EW, Gupton SL, Gertler FB. The growth cone cytoskeleton in axon outgrowth and guidance. Cold Spring Harb. Perspect. Biol. 2011;3:3. doi: 10.1101/cshperspect.a001800. - DOI - PMC - PubMed
    1. Hall A, Lalli G. Rho and ras GTPases in axon growth, guidance, and branching. Cold Spring Harb. Perspect. Biol. 2010;2:2. doi: 10.1101/cshperspect.a001818. - DOI - PMC - PubMed
    1. Jung H, Yoon BC, Holt CE. Axonal mRNA localization and local protein synthesis in nervous system assembly, maintenance and repair. Nat. Rev. Neurosci. 2012;13:308–324. doi: 10.1038/nrn3210. - DOI - PMC - PubMed

Publication types

MeSH terms