. 2021 May 10;12(1):2594.
doi: 10.1038/s41467-021-22813-w.

LRIG1 is a gatekeeper to exit from quiescence in adult neural stem cells

Affiliations

LRIG1 is a gatekeeper to exit from quiescence in adult neural stem cells

María Ángeles Marqués-Torrejón et al. Nat Commun. .

Abstract

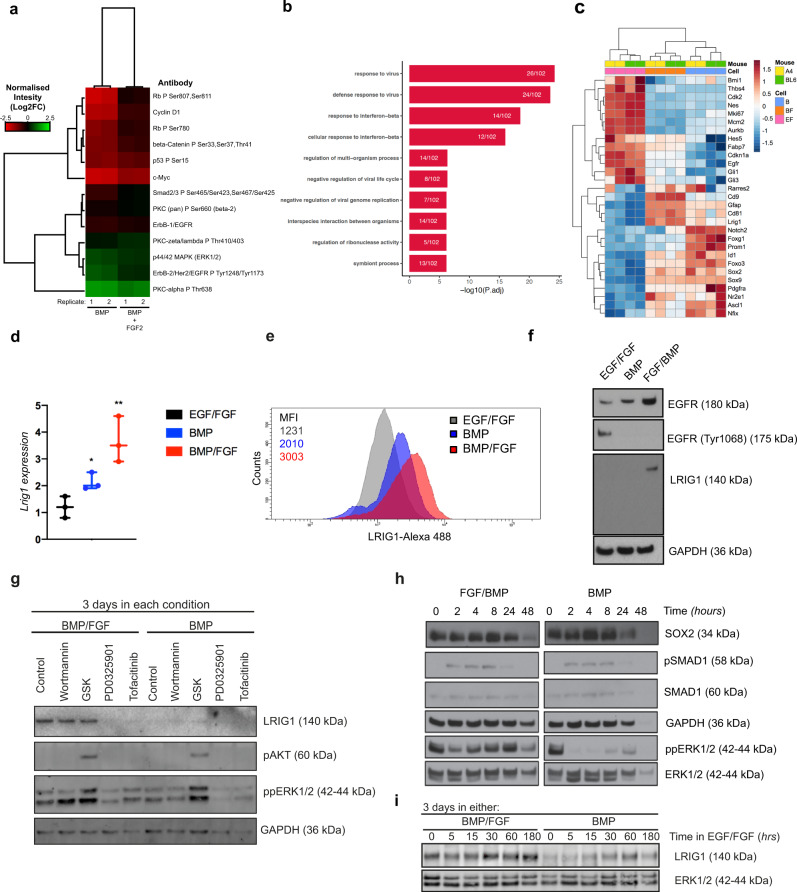
Adult neural stem cells (NSCs) must tightly regulate quiescence and proliferation. Single-cell analysis has suggested a continuum of cell states as NSCs exit quiescence. Here we capture and characterize in vitro primed quiescent NSCs and identify LRIG1 as an important regulator. We show that BMP-4 signaling induces a dormant non-cycling quiescent state (d-qNSCs), whereas combined BMP-4/FGF-2 signaling induces a distinct primed quiescent state poised for cell cycle re-entry. Primed quiescent NSCs (p-qNSCs) are defined by high levels of LRIG1 and CD9, as well as an interferon response signature, and can efficiently engraft into the adult subventricular zone (SVZ) niche. Genetic disruption of Lrig1 in vivo within the SVZ NSCs leads an enhanced proliferation. Mechanistically, LRIG1 primes quiescent NSCs for cell cycle re-entry and EGFR responsiveness by enabling EGFR protein levels to increase but limiting signaling activation. LRIG1 is therefore an important functional regulator of NSC exit from quiescence.


Conflict of interest statement

S.M.P. is a founder and shareholder of Cellinta Ltd., a biotechnology startup that is developing cancer therapeutics, including glioblastoma. The other authors declare no competing interests.

Figures

Fig. 1
Fig. 1. Quiescence NSCs express high levels of the Cdt1 red Fucci reporter in vivo.
a Immunohistochemistry for GFAP (green) in the SVZ. mCherry Fucci reporter (red) and nuclear counterstaining with DAPI (blue). Right, detail of GFAP positive cells expressing different levels of Fucci red reporter and quantification (n = 3 independent mice). b Immunohistochemistry for GFAP (yellow), CD9 (green), mCHERRY Fucci reporter (red), and nuclear counterstaining DAPI (blue). Right, detail of GFAP positive cells with different levels of CD9 and mCherry Fucci reporter. Nuclear counterstaining with DAPI (blue). c Live imaging of the Fucci NSCs treated with EGF/FGF, BMP and BMP/FGF showing mCHERRY (red) and VENUS (green) reporters. d Flow cytometry Fucci quantification of the percentage of cells positive for Cdt1-mCherry (red) and VENUS (green), negative or low levels of fluorescence (pale pink) and double positives for both reporters (yellow) (n = 3). e qPCR for different markers (Egfr, Hes5, Mmc2, Sox2, Gfap, Id1) in the different conditions (data relative to EGF/FGF) (n = 3). f Immunocytochemistry for CD9 (yellow) in Fucci NSC line, mCherry (red) and nuclear counterstaining with DAPI (blue) (n = 3 independent NSC lines). g Quantification of the CD9 mean intensity in NSCs treated for EGF/FGF2, BMP4, and BMP/FGF2 for 3 days. Quantification by Fiji (n = 3 independent experiments per condition, average intensity of min 500 cells per group). h Number of colonies in the sorted population of Fucci cell cycle reporter based high levels of CD9 and mCHERRY levels (h-high, l-low) (n = 3). Data are shown as mean ± SEM of the indicated number of the experiments (n) (*p < 0.05; **p < 0.01; ***p < 0.001). St:striatum, LV: Lateral Ventricle. Scale bar in (a, b) is 20 μm, (c, f) is 50 μm. Scale in details:10 μm. Source data are provided as a Source Data File.
Fig. 2
Fig. 2. BMP and FGF2 condition drives a quiescence reversible state in NSCs.
a Histogram of cytometry quantification of CD9 in the different conditions MFI (median fluorescence intensity) (n = 4). b Immunostaining of NSCs treated with EGF/FGF, BMP, and BMP/FGF for 3 days. OLIG2 (red), SOX2 (green), GFAP (green) NESTIN (green) KI67 (red) and ID1 (red). Nuclear counterstaining in blue with DRAQ5. Images showing ICC in group of cells to appreciate staining (n = 5). c Quantification of the DNA content using DAPI and flow cytometry (n = 3). d Cytometry analysis of double knock-in mCherry-p27 and eGFP-PCNA NSC line in the different conditions (n = 4). e Quantification of the relative expression of different genes in the cells treated with BMP and BMP/FGF2 (n = 3). f EdU incorporation images (yellow) in the NSCs in presence of EGF/FGF. Nuclear counterstaining with DAPI (blue). Quantification of percentage of EdU positive cells, during the treatment (left), and after to re-exposure to mitogens (right) (n = 3). g (top) Phase contrast images of the colony-forming assay of the cells treated with BMP and BMP/FGF (bottom). Quantification of the number of colonies after to re-exposure to mitogens (n = 5). Scale bar in (b, f, g) is 50 μm. Mean is indicated in the box and whiskers plots from minimum to maximum. Data are shown as mean ± SEM of the indicated number of the experiments (n) (∗p < 0.05; ∗∗p < 0.01; ∗∗∗p < 0.001). Source data are provided as a Data Source File.
Fig. 3
Fig. 3. Quiescence NSCs allow long term regeneration.
a Schematics of the experiments. NSCs derived from mouse, after several months of expansion in vitro are transplanted in the SVZ for 1 month. b Panoramic pictures of the NSCs (GFP, green) in the SVZ after 1 month. NSCs were treated with EGF/FGF, BMP-4, and FGF/BMP-4 previously to be transplanted. c Immunostaining for GFP (green), GFAP (yellow), Ki67 (red) nuclear counterstaining with DAPI (blue). d Immunostaining for GFP (green), BIII TUBULIN (red), DAPI (blue) showing neurons arriving to the OB. e Immunostaining for GFP (green), BIII tubulin (magenta) and GAD65/67 (red) and nuclear counterstaining with DAPI (blue). LV: Lateral Ventricle. OB: Olfactory Bulb. Detail of co-staining GFP and BIII TUBULIN (red). Scale bar in (b) is 100 μm, (c, d) is 50 μm and in (e) is 20 μm. Scale bar in detail is 20 μm (n = 3 analyzed transplanted mice per condition). Schematics in (a) were generated using BioRender software.
Fig. 4
Fig. 4. Dormant and primed quiescent NSCs have distinct signaling pathways and transcriptional programs.
a RPPA data analysis of the NSCs in BMP and BMP/FGF (n = 3). b The top biological GO terms in biological process enriched genes in BMP/FGF condition. c Heatmap showing the top significant genes. d Lrig1 expression by QPCR in the different conditions (n = 3). e Histogram of LRIG1 expression by cytometry (n = 3). Quantifications show mean fluorescent intensity (MFI). f Immunoblot of LRIG1, EGFR (total), and EGFR-P. Loading control GAPDH. g Immunoblot for LRIG1, pAKT, ppERK1/2, GAPDH in NSCs treated with BMP and BMP + FGF for 3 days (n = 3). Different kinases inhibitors were used (Wortmannin, GSK, PD0325901, Tofacitinib) (n = 3). h Immunoblot for SOX2, pSMAD1, SMAD1, GAPDH, ppERK1/2, ERK in NSCs treated with BMP and BMP/FGF for 3 days and re-exposure to EGF + FGF, different time exposures (n = 3). i Immunoblot for Lrig1 in NSCs treated with BMP/FGF and BMP and re-exposure to EGF/FGF in a time course. Loading control, ERK1/2 (n = 3). Data are shown as mean ± SEM of the indicated number of the experiments (n) (∗p < 0.05; ∗∗p < 0.01). Source data are provided as a Source Data File.
Fig. 5
Fig. 5. LRIG1 is necessary to enter in quiescence state.
a Schematics of Lrig1 gene disruption. b PCR confirming CRISPR-Cas9 (control and parental line). c Flow cytometry plots with the transfected NSCs. d ICC for LRIG1(red) and nuclear counterstaining with DAPI (blue) in sorted populations after transfection. e EdU quantification of the WT and Lrig1 KO NSCs in the different conditions (EGF/FGF2, BMP, and BMP/FGF2) (n = 3). f Quantification of the single-cell colony formation in the WT and Lrig1 KO cells in EGF/FGF2 (n = 3). g Quantification of the number of colonies of deficient and WT NSCs after the treatment with BMP and BMP/FGF2, after to re-exposure to mitogens (n = 3). h Lrig1 KO cells maintain high levels of pEGFR; WB of EGFR total and EGFR-p in WT and Lrig1 KO cells in the different conditions (EGF/FGF2, BMP and BMP/FGF2). Loading control GAPDH. i Quantification of the EdU positive cells in KO and control cells in the different conditions using Gefitinib (n = 3 per condition). j Single-cell colony-forming assay of the deficient and control NSCs using Gefitinib (n = 3 per genotype and condition, 48 single cells plated in each group each time). k Quantification of the colony formation of the WT and Lrig1 KO NSCs in each condition (BMP and BMP/FGF2) using EGFR inhibitor (Gefitinib) (n = 3 per condition). Scale bar in d = 50um. Data are shown as mean ± SEM of the indicated number of the experiments (n) (∗p < 0.05; ∗∗p < 0.01; ∗∗∗p < 0.001). Source data are provided as Source Data File.
Fig. 6
Fig. 6. Lrig1 overexpression in NSCs induces cell cycle exit.
a IHC for FLAG (green), and GFAP (red). Detection of EdU (magenta) and nuclear counterstaining in blue (DAPI) with NSC overexpressing Lrig1 in different concentrations of mitogens (10, 1, and 0.1 ng/ml of both EGF/FGF). b Quantification of EdU positive cells after 2 h of pulse in the FLAG + and FLAG- populations. c IHC for CD9 (red) and FLAG (green). Detection of EdU in magenta and nuclear counterstaining with DAPI (blue). d IHC of FLAG (green), active CASPASE-3 (red). Detection of EdU (magenta) and nuclear counterstaining with DAPI (blue). Cells analyzed 48 and 96 h after transfection. e Quantification of EdU positive cells in the FLAG + and FLAG- population after 48 h and 96 h of transfection. f Quantification of active CASPASE-3 after 48 h and 96 h of transfection in FLAG + and FLAG- populations (n = 3 independent transfections, minimal number of 500 cells per condition). Scale bar in (a) is 50 μm, (c) is 10 μm and (d) is 30 μm. Data are shown as mean ± SEM of the indicated number of the experiments (n). Source data are provided as Source Data File.
Fig. 7
Fig. 7. LRIG1 control proliferation in the SVZ.
a Schematics of the in vivo electroporation procedure. b IHC for GFAP (green), Hes5 tomato (red) and DAPI counterstain in mice electroporated with Control plasmid and Lrig1 guide RNA. c IHC for LRC (light blue), GFAP (green), and HES5 tomato (red). Nuclear counterstaining with DAPI (blue). d IHC for KI67 (green), HES5 TOMATO (red) and nuclear counterstaining with DAPI (blue). e Quantification of the number of HES5 tomato positive cells relative to the total ones (DAPI). f Quantification of the number of GFAP positive cells in the Hes5 TOMATO population. g Quantification of the LRC + in GFAP/HES5 TOMATO population (h) Quantification of the percentage of KI67 positive cells in HES5 TOMATO population. i Graphical schematics of the results. Scale bar in (b, c, and d) is 10 μm. LV: Lateral Ventricle, ST: Striatum. BV: Blood Vessel (N = 4 mice per condition). Mean is indicated in the box and whiskers plots from minimum to maximum. Data are shown as mean ± SEM of the indicated number of the experiments (n) (∗p < 0.05; ∗∗p < 0.01). Schematics in (a) are done using BioRender software (original photo of the SVZ). Source data are provided as Source Data File.

References

    1. Cheung TH, Rando TA. Molecular regulation of stem cell quiescence. Nat. Rev. Mol. Cell Biol. 2013;14:329–340. doi: 10.1038/nrm3591. - DOI - PMC - PubMed
    1. Rumman M, Dhawan J, Kassem M. Concise review: quiescence in adult stem cells: biological significance and relevance to tissue regeneration. STEM CELLS. 2015;33:2903–2912. doi: 10.1002/stem.2056. - DOI - PubMed
    1. Gonçalves JT, Schafer ST, Gage FH. Adult neurogenesis in the hippocampus: from stem cells to behavior. Cell. 2016;167:897–914. doi: 10.1016/j.cell.2016.10.021. - DOI - PubMed
    1. Obernier K, Alvarez-Buylla A. Neural stem cells: origin, heterogeneity and regulation in the adult mammalian brain. Development. 2019;146:dev156059. doi: 10.1242/dev.156059. - DOI - PMC - PubMed
    1. Maslov AY, Barone TA, Plunkett RJ, Pruitt SC. Neural stem cell detection, characterization, and age-related changes in the subventricular zone of mice. J. Neurosci. 2004;24:1726–1733. doi: 10.1523/JNEUROSCI.4608-03.2004. - DOI - PMC - PubMed

Publication types

MeSH terms