. 2021 May 10;12(1):2580.
doi: 10.1038/s41467-021-22648-5.

Genoppi is an open-source software for robust and standardized integration of proteomic and genetic data

Affiliations

Genoppi is an open-source software for robust and standardized integration of proteomic and genetic data

Greta Pintacuda et al. Nat Commun. .

Abstract

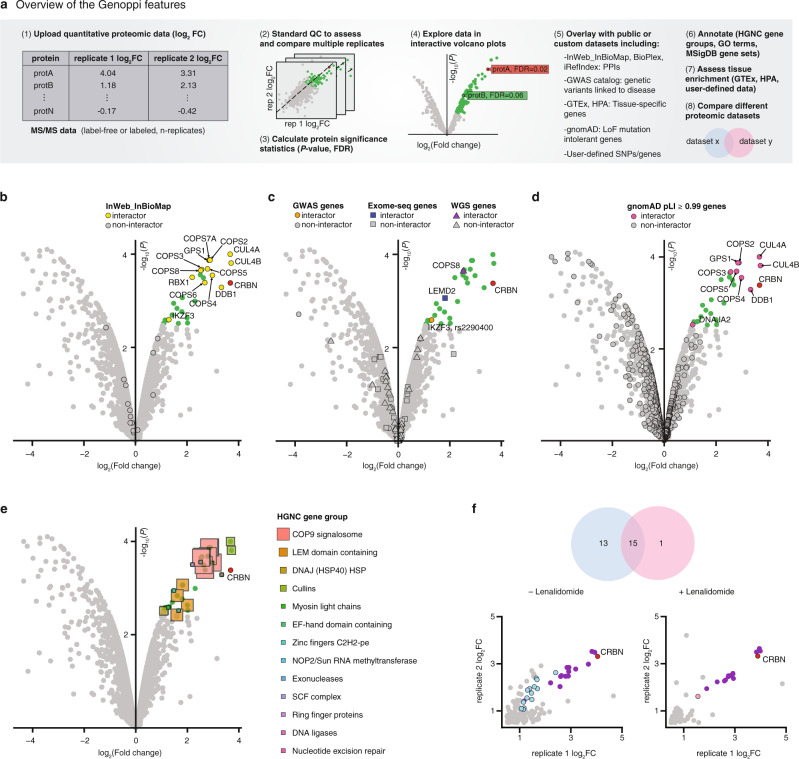
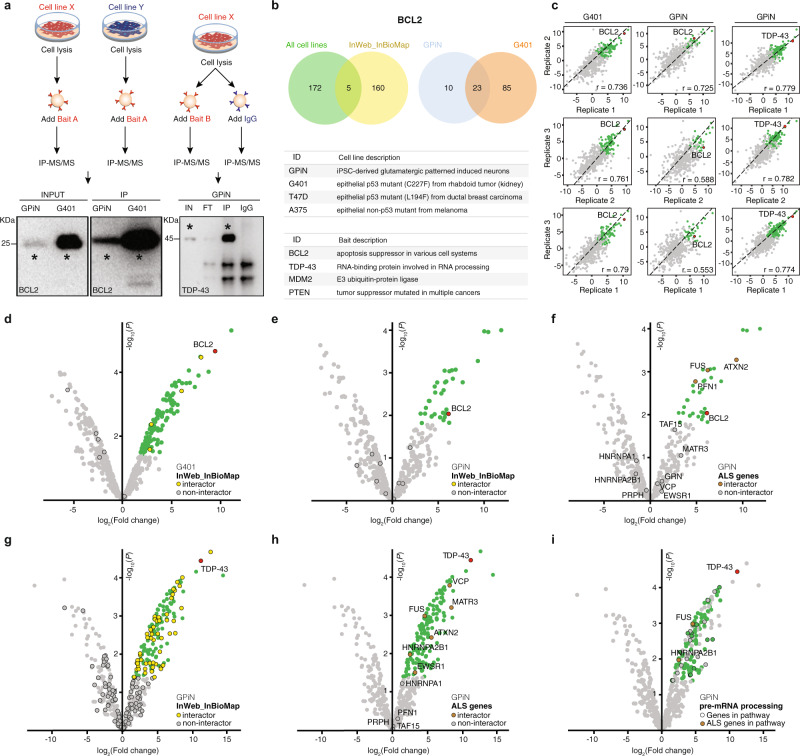
Combining genetic and cell-type-specific proteomic datasets can generate biological insights and therapeutic hypotheses, but a technical and statistical framework for such analyses is lacking. Here, we present an open-source computational tool called Genoppi (lagelab.org/genoppi) that enables robust, standardized, and intuitive integration of quantitative proteomic results with genetic data. We use Genoppi to analyze 16 cell-type-specific protein interaction datasets of four proteins (BCL2, TDP-43, MDM2, PTEN) involved in cancer and neurological disease. Through systematic quality control of the data and integration with published protein interactions, we show a general pattern of both cell-type-independent and cell-type-specific interactions across three cancer cell types and one human iPSC-derived neuronal cell type. Furthermore, through the integration of proteomic and genetic datasets in Genoppi, our results suggest that the neuron-specific interactions of these proteins are mediating their genetic involvement in neurodegenerative diseases. Importantly, our analyses suggest that human iPSC-derived neurons are a relevant model system for studying the involvement of BCL2 and TDP-43 in amyotrophic lateral sclerosis.


Conflict of interest statement

K.C.E. is a co-founder of Q-State Biosciences, Quralis, and Enclear, and currently employed at BioMarin Pharmaceutical. All the other authors declare no competing interests.

Figures

Fig. 1
Fig. 1. Overview of Genoppi.
a Overview of the Genoppi features. b Volcano plot of published CRBN interaction data in MM1S multiple myeloma cells versus control samples. The x-axis shows the log2 FC of each identified protein and the y-axis the corresponding −log10 P value. The bait protein (CRBN) is marked in red; statistically significant interactors with log2 FC > 0 and FDR ≤ 0.1 are in green; non-interactors that do not pass this threshold are in gray. Known interactors of CRBN in InWeb_InBioMap are marked by black border circles; those significant in the experimental data are highlighted in yellow (overlap enrichment P = 1.1e − 21, from one-tailed hypergeometric test). c The volcano plot from (b) is overlaid with genetic data. Proteins encoded by genes mapped from acute lymphoblastic leukemia GWAS SNPs (GWAS genes), significantly mutated genes identified through exome sequencing in multiple myeloma (Exome-seq genes), or recurrently mutated cis-regulatory elements identified via whole-genome sequencing in multiple myeloma (WGS genes) are marked by black border circles, squares, or triangles, respectively; those significant in the experimental data are highlighted in orange, blue, or purple, respectively. Overlap enrichment was not calculated since part of this gene list was mapped from GWAS SNPs using linkage disequilibrium information. d The volcano plot from (b) is overlaid with proteins intolerant of LoF mutations in gnomAD. Proteins encoded by genes with pLI scores ≥ 0.99 are marked by black border circles; those significant in the experimental data are highlighted in magenta (overlap enrichment P = 0.087, from one-tailed hypergeometric test). e The volcano plot from (b) is overlaid with HGNC gene group annotations (square markers) for the significant interactors. Marker size scales with the number of interactors assigned to each group. f Illustration of Genoppi’s ability to make comparisons between proteomic experiments under different genetic or pharmaceutical perturbations; in this case, the comparison of CRBN interactors in untreated (−Lenalidomide) versus lenalidomide-treated (+Lenalidomide) MM1S cells. Top: Venn diagram representing the overlap of significant (log2 FC > 0 and FDR ≤ 0.1) interactors between the two conditions. Bottom: scatter plots showing log2 FC of identified proteins in two replicates (x- and y-axis, respectively) for each condition. Interactors shared between conditions are shown in purple; interactors unique to each condition are in blue or pink, respectively. FC fold change, MS mass spectrometry, QC quality control, FDR false discovery rate, PPI protein–protein interaction, LoF loss-of-function, SNP single-nucleotide polymorphism. Source data are provided as a Source Data file.
Fig. 2
Fig. 2. IP-MS/MS analysis through Genoppi.
a Experimental design and representative western blots of immunoprecipitations prepared for MS/MS analysis. The schematic to the left shows how Bait A (BCL2 as an example) was pulled down in two distinct cell lines (GPiN and G401) and detected in western blots carried out on cell lysate input and IP material from both cell lines. The schematic to the right exemplifies the immunoprecipitation of Bait B (TDP-43 as an example) and the parallel addition of nonspecific IgG control to GPiN lysates; a TDP-43 western blot was then performed on the cell lysate input, IP flow-through, IP, and IgG control. Each blot is representative of three IP replicates. Asterisks (*) indicate the band corresponding to each bait (BCL2 or TDP-43). b Top: Venn diagrams representing the overlap between BCL2 interactors identified in all cell lines and known InWeb_InBioMap interactors, and the overlap of interactors identified in neurons (GPiN) and a cancer cell line (G401). Bottom: complete list of cell lines and baits used for the experiments. c Scatter plots showing the reproducibility of three IP replicates in terms of log2 FC correlation for three sets of experiments: BCL2 versus IgG control in G401 cells or GPiNs, and TDP-43 versus IgG control in GPiNs. Pearson’s correlation (r) is reported in each plot. d BCL2 versus IgG control IP results in G401 cells. The volcano plot is overlaid with known BCL2 interactors in InWeb_InBioMap (overlap enrichment P = 0.15). e, f BCL2 versus IgG control IP results in GPiNs. The volcano plot is overlaid with known BCL2 interactors in InWeb_InBioMap (e; overlap enrichment P = 1.0) or proteins encoded by ALS genes (f; overlap enrichment P = 0.041). g, h TDP-43 versus IgG control IP results in GPiNs. The volcano plot is overlaid with known TDP-43 interactors in InWeb_InBioMap (g; overlap enrichment P = 0.085) or proteins encoded by ALS genes (h; overlap enrichment P = 0.046). In plots (ch), the bait (BCL2 or TDP-43), interactors (log2 FC > 0 and FDR ≤ 0.1), and non-interactors are shown in red, green, and gray, respectively; overlaid proteins are marked by black border circles, and their overlap enrichment P values were calculated using one-tailed hypergeometric tests. i TDP-43 versus IgG control IP results in GPiNs shown as volcano plot, with the bait (TDP-43) shown in red, interactors (log2 FC > 0 and FDR ≤ 0.1) that are GPiN-specific (i.e., not interactors in G401) in green, and other detected proteins in gray. Black border circles indicate interactors in the MSigDB Reactome “processing of capped intron-containing pre-mRNA” pathway; two GPiN-specific interactors in the pathway, FUS and HNRNPA2B1, have been linked to ALS and are highlighted in brown. IN input, FT flow-through, IP immunoprecipitation, IgG Immunoglobulin G isotype control. Source data are provided as a Source Data file.

Similar articles

Cited by

References

    1. Lundby A, et al. Annotation of loci from genome-wide association studies using tissue-specific quantitative interaction proteomics. Nat. Methods. 2014;11:868–874. doi: 10.1038/nmeth.2997. - DOI - PMC - PubMed
    1. Lage K. Protein-protein interactions and genetic diseases: The interactome. Biochim. Biophys. Acta. 2014;1842:1971–1980. doi: 10.1016/j.bbadis.2014.05.028. - DOI - PMC - PubMed
    1. Ahmad Y, Lamond AI. A perspective on proteomics in cell biology. Trends Cell Biol. 2014;24:257–264. doi: 10.1016/j.tcb.2013.10.010. - DOI - PMC - PubMed
    1. Viswanathan SR, et al. Genome-scale analysis identifies paralog lethality as a vulnerability of chromosome 1p loss in cancer. Nat. Genet. 2018;50:937–943. doi: 10.1038/s41588-018-0155-3. - DOI - PMC - PubMed
    1. Pintacuda, G. et al. Genoppi is an open-source software for robust and standardized integration of proteomic and genetic data. lagelab/Genoppi: Genoppi v1.0.0. 10.5281/zenodo.4532375 (2021). - PMC - PubMed

Publication types

MeSH terms