. 2021 May 10;12(1):2593.
doi: 10.1038/s41467-021-22811-y.

Identification and characterization of a SARS-CoV-2 specific CD8+ T cell response with immunodominant features

Affiliations

Identification and characterization of a SARS-CoV-2 specific CD8+ T cell response with immunodominant features

Anastasia Gangaev et al. Nat Commun. .

Abstract

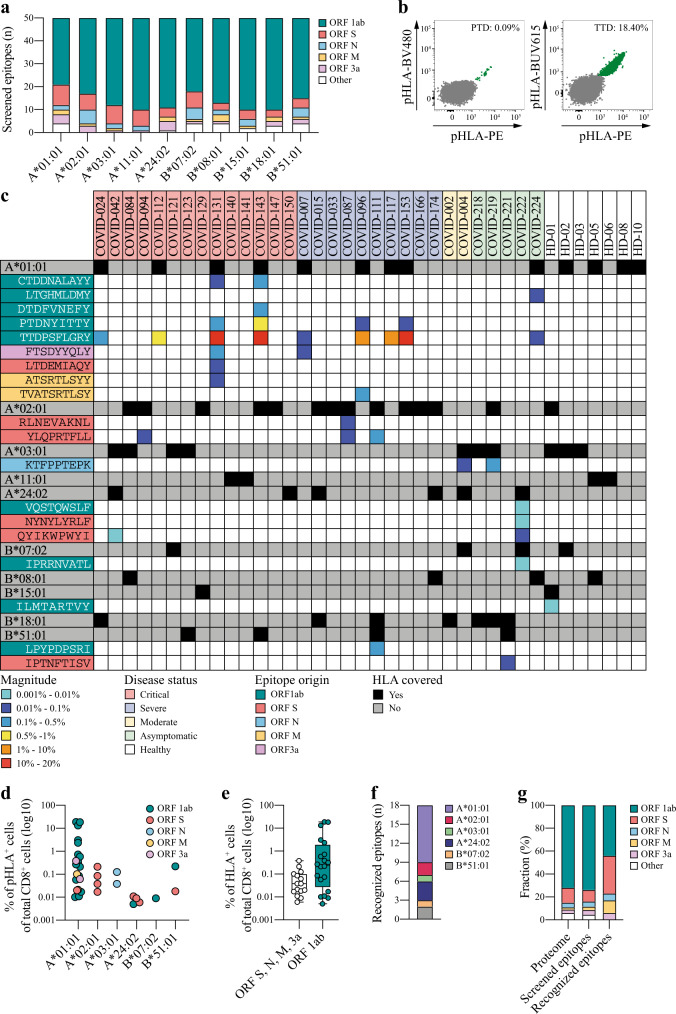
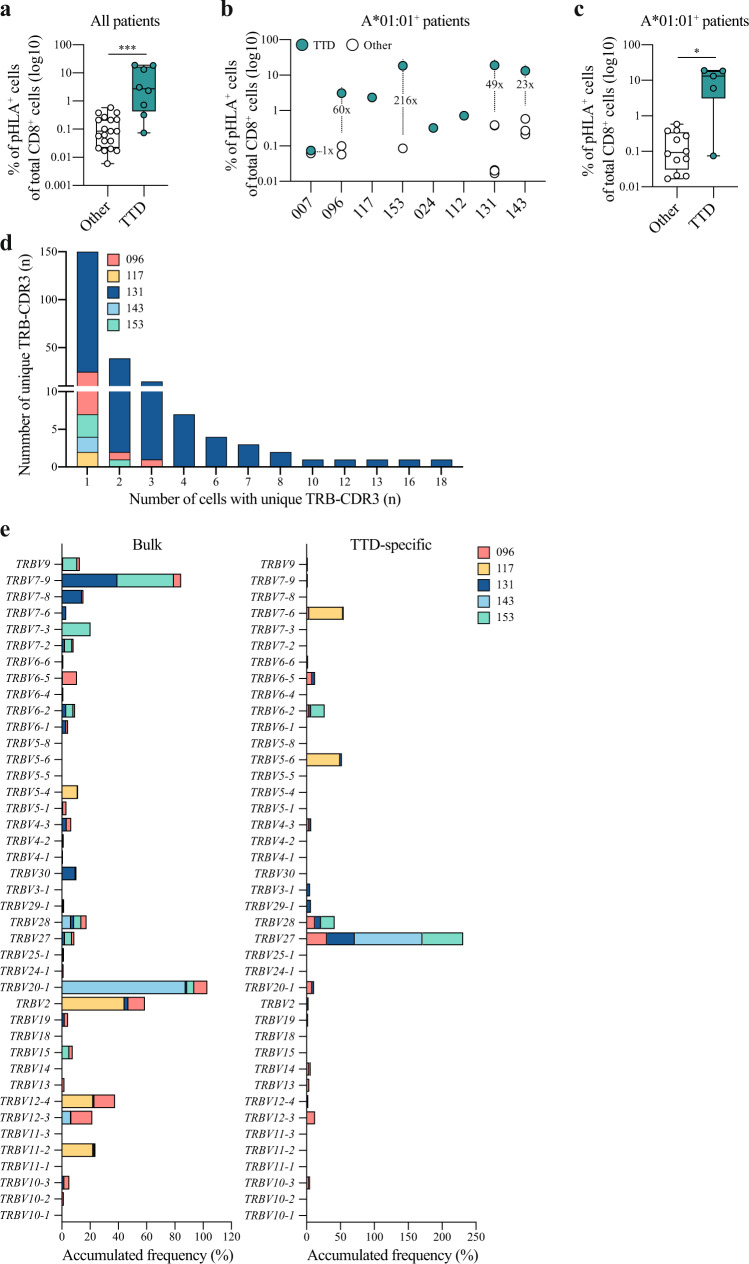
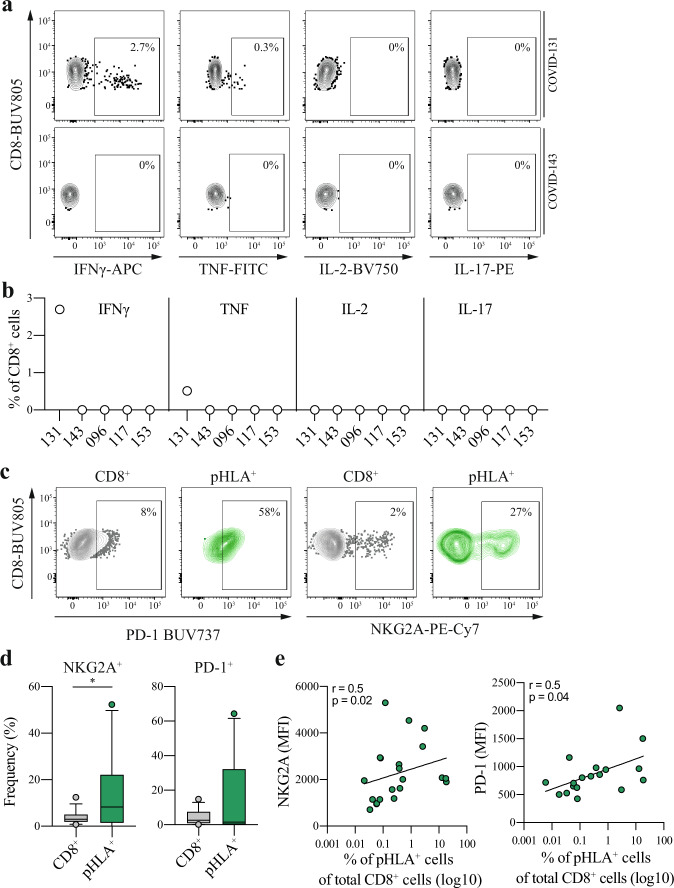
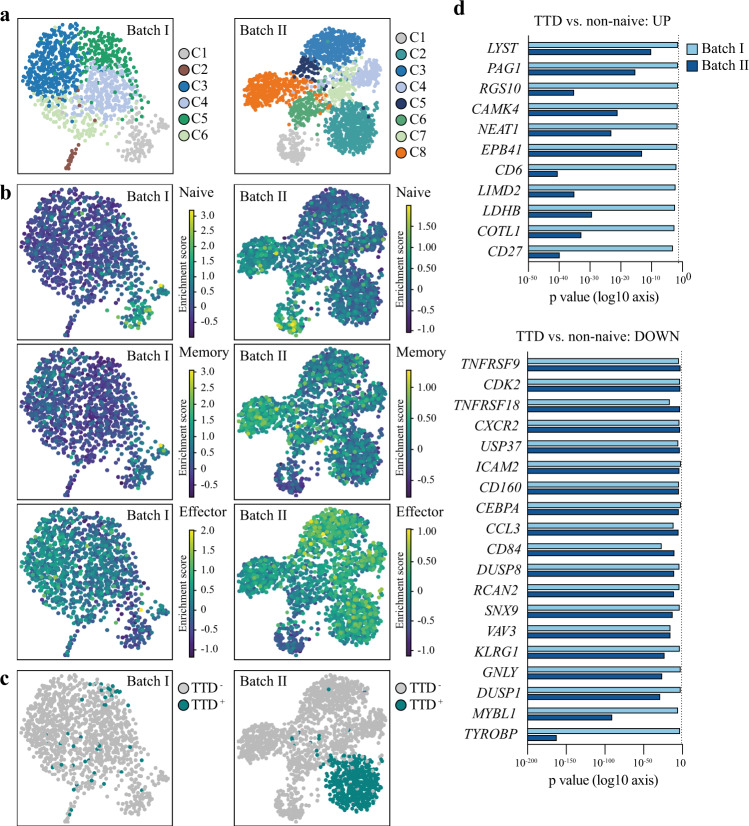
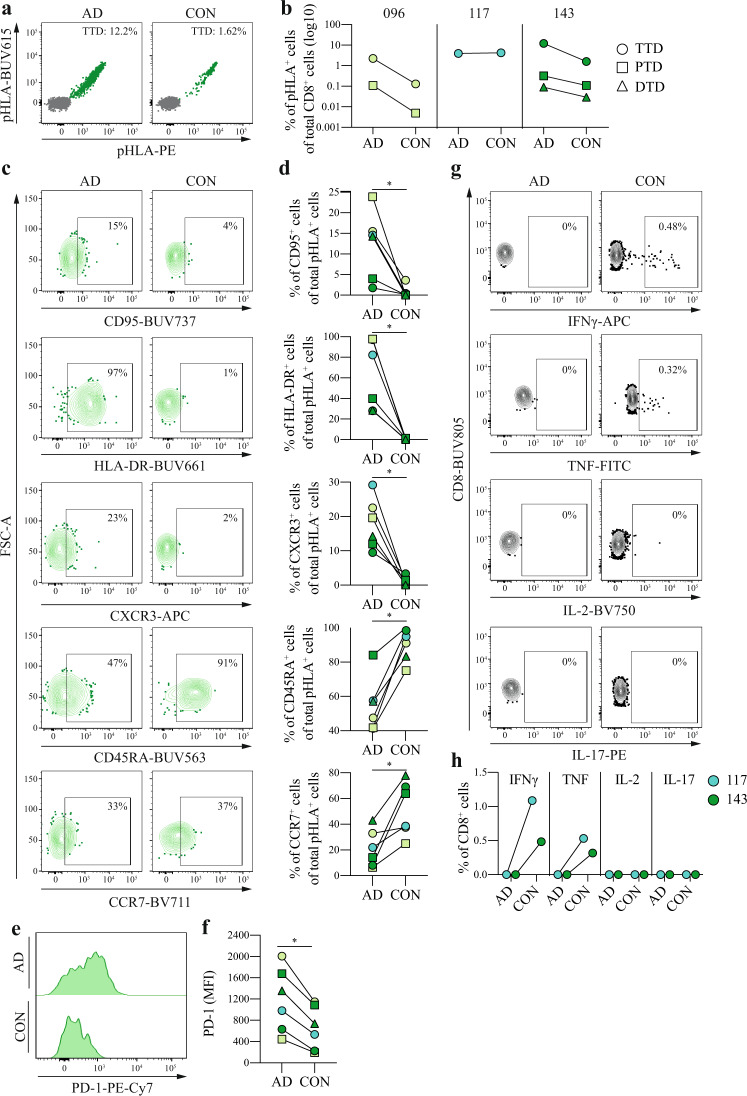
The COVID-19 pandemic caused by SARS-CoV-2 is a continuous challenge worldwide, and there is an urgent need to map the landscape of immunogenic and immunodominant epitopes recognized by CD8+ T cells. Here, we analyze samples from 31 patients with COVID-19 for CD8+ T cell recognition of 500 peptide-HLA class I complexes, restricted by 10 common HLA alleles. We identify 18 CD8+ T cell recognized SARS-CoV-2 epitopes, including an epitope with immunodominant features derived from ORF1ab and restricted by HLA-A*01:01. In-depth characterization of SARS-CoV-2-specific CD8+ T cell responses of patients with acute critical and severe disease reveals high expression of NKG2A, lack of cytokine production and a gene expression profile inhibiting T cell re-activation and migration while sustaining survival. SARS-CoV-2-specific CD8+ T cell responses are detectable up to 5 months after recovery from critical and severe disease, and these responses convert from dysfunctional effector to functional memory CD8+ T cells during convalescence.


Conflict of interest statement

The authors declare no competing interests.

Figures

Fig. 1
Fig. 1. Identification of SARS-CoV-2-specific CD8 T cell responses.
a Overview of the selected SARS-CoV-2 epitopes derived from the different SARS-CoV-2 ORFs for each of the 5 HLA-A and 5 HLA-B alleles included in this study. b Representative flow cytometric plots of two different SARS-CoV-2-specific CD8 T cell responses detected in patient COVID-153. Magnitude of the response (percentage of double-positive pHLA+ cells [green] of total CD8+ cells [gray]) is indicated. Representative gating strategy is provided in Supplementary Fig. 1. c Heatmap of detected SARS-CoV-2-specific CD8 T cell responses (n = 35) including information about CD8 T cell-recognized SARS-CoV-2 epitopes (n = 18) and their viral protein origin, the magnitude of the response (pHLA+ cells of total CD8+ cells), and HLA coverage as well as the disease status for each COVID-19 patient (n = 31) and healthy donor (n = 7). Confirmation of identified responses was done for patients COVID-004, 087, 096, 121, 127, 143, and 153 with similar results. d Overview of the magnitude, target epitope origin, and number of detected SARS-CoV-2-specific CD8 T cell responses (n = 35) across the included HLA alleles. Source data are provided as a Source data file. e Difference in the magnitude of SARS-CoV-2-specific CD8 T cell responses targeting epitopes derived from ORF1ab (n = 20) compared to CD8 T cell responses targeting epitopes derived from all other SARS-CoV-2 proteins (n = 15) combined. All detected responses are included. Box plots indicate the median (line), 25th and 75th percentile (box), min and max (whiskers), and all data points (single circles). Statistical significance was tested with a two-tailed Mann–Whitney U test, P = 0.0309. Source data are provided as a Source data file. f Number of SARS-CoV-2 epitopes (n = 18) that were recognized by CD8 T cells across different HLA alleles. g Bar graphs illustrating the contribution of each ORF to the SARS-CoV-2 proteome (left) in comparison to the fraction of the selected epitopes per ORF based on our predictions (middle) and the contribution of each ORF to the CD8 T cell-recognized epitopes (right). ORF open reading frame, S spike, N nucleoprotein, M membrane, pHLA peptide human leukocyte antigen, PTD PTDNYITTY, TTD TTDPSFLGRY.
Fig. 2
Fig. 2. Characterization of the TTD-specific CD8 T cell response.
a Difference in the magnitude of SARS-CoV-2-specific CD8 T cell responses specific for the TTD epitope (n = 8) compared to CD8 T cell responses specific for all other epitopes (n = 27). Responses included in this analysis were detected in COVID-19 patients with acute disease. Box plots indicate the median (line), 25th and 75th percentile (box), min and max (whiskers), and all data points (single circles). Statistical significance was tested with a two-tailed Mann–Whitney U test, P = 0.0003. Source data are provided as a Source data file. b SARS-CoV-2-specific CD8 T cell responses specific for the TTD epitope (green) and other epitopes (white) detected in HLA-A*01:01+ patients with acute critical and severe disease (n = 8). The fold difference in magnitude between the TTD-specific CD8 T cell response and the second-highest detected SARS-CoV-2-specific CD8 T cell response is shown if present. c Difference in the magnitude of TTD-specific CD8 T cell responses (n = 5) compared to responses specific for other HLA-A*01:01-restricted epitopes (n = 12) that were detected in HLA-A*01:01+ patients. Box plots indicate the median (line), 25th and 75th percentile (box), min and max (whiskers), and all data points (single circles). Statistical significance was tested with a two-tailed Mann–Whitney U test, P = 0.0136. Source data are provided as a Source data file. d Quantity of unique TRB-CDR3 chains present in TTD-specific CD8 T cells (n = 431) of COVID-19 patients (n = 5). The number of single cells expressing unique TRB-CDR3 chains is indicated on the x-axis. TRB-CDR3 T cell receptor beta-complementarity-determining region 3. e Frequency of cells expressing different TRBV segments that were found in bulk CD8 T cells (left panel, n = 1860) compared to TTD-specific CD8 T cells (right panel, n = 431) of COVID-19 patients (n = 5). Accumulated (stacked) frequencies for each individual patient are shown. TTD TTDPSFLGRY, pHLA peptide human leukocyte antigen. *** P < 0.001, * P < 0.05.
Fig. 3
Fig. 3. Characterization and functional assessment of SARS-CoV-2-specific CD8 T cells.
a Representative gating used to assess the functional capacity of TTD-specific CD8 T cells of 2 COVID-19 patients. Functionality was assessed based on production of IFNγ, TNF, IL-2, and IL-17 after 12 h peptide stimulation with TTD. Percentages represent the frequency of cytokine-producing cells. Full gating strategy is shown in Supplementary Fig. 3a–c. b Expression of IFNγ, TNF, IL-2, and IL-17 in CD8 T cells of COVID-19 patients (n = 5) with acute disease after 12 h peptide stimulation with TTD. DMSO control-subtracted percentages are shown. Two independent experiments were performed for patient COVID-143 and COVID-153 with similar results. c Representative flow cytometric plots illustrating the gating strategy used to quantify the fraction and expression levels of PD-1 and NKG2A on total CD8 T cells (CD8+, gray) and SARS-CoV-2-specific CD8 T cells (pHLA+, green) in COVID-112. The gates applied for detected SARS-CoV-2-specific CD8 T cell responses were based on total CD8 T cells. d Differences in the fraction of NKG2A+ or PD-1+ cells of SARS-CoV-2-specific CD8 T cells (pHLA+, n = 27) compared to bulk CD8 T cells (CD8+, n = 32) of COVID-19 patients with acute disease. Box plots indicate the median (line), 25th and 75th percentile (box), 5th and 95th percentile (whiskers), and outliers (single circles). Statistical significance was tested with a two-tailed Mann–Whitney U test, NKG2A: P = 0.0427, PD-1: P = 0.7651. Source data are provided as a Source data file. e Correlation analysis between the expression levels (MFI) of NKG2A+ (pHLA+, n = 21) or PD-1+ (pHLA+, n = 18) on SARS-CoV-2-specific CD8 T cells and the magnitude of SARS-CoV-2-specific CD8 T cell responses. Two-tailed Spearman correlation analysis was performed, NKG2A: P = 0.0199, r = 0.5, PD-1: P = 0.0361, r = 0.5. TTD TTDPSFLGRY, pHLA peptide human leukocyte antigen. * P < 0.05. Source data are provided as a Source data file.
Fig. 4
Fig. 4. Single-cell transcriptome analysis of SARS-CoV-2-specific CD8 T cells.
a UMAP representations of cell clusters (batch I: n = 6 and batch II: n = 8) of the single-cell gene expression data of CD8 T cells (batch I: n = 1180 and batch II: n = 1884) isolated from COVID-19 patients (batch I: n = 5 and batch II: n = 1). Clusters were identified using the Louvain algorithm. Full list of differentially expressed genes for each cluster is provided in Supplementary Data 2. b UMAP representations of enriched gene signatures (Supplementary Data 3) used to identify naive, memory, and effector CD8 T cells in batch I and batch II. c UMAP representations of single-cell gene expression data of TTD-specific CD8 T cells (batch I: n = 48 and batch II: n = 494) isolated from COVID-19 patients (batch I: n = 4 and batch II: n = 1). d Differentially expressed genes that were found to be significantly (FDR < 0.05) upregulated (ln fold change of >1) or downregulated (ln fold change <−1) in TTD-specific CD8 T cell compared to non-naive CD8 T cells in batch I and batch II. The full list of genes is provided in Supplementary Data 5. Statistical significance was tested with a two-tailed t test; multiple correction was performed with the Benjamini–Hochberg procedure. Original P values are displayed on a log10 x-axis. TTD TTDPSFLGRY.
Fig. 5
Fig. 5. Characterization of SARS-CoV-2-specific CD8 T cells during acute disease and convalescence.
a Representative dot plots of the TTD-specific CD8 T cell response detected in patient COVID-143. Magnitude of the response (percentage of double-positive pHLA+ cells [green] of total CD8+ cells [gray]) is indicated. Representative gating strategy is shown in Supplementary Fig. 5. b Magnitude of SARS-CoV-2-specific CD8 T cell responses (n = 6) detected in COVID-19 patients (n = 3). Source data are provided as a Source data file. c Representative gating strategy used to quantify the fraction of CD95+, CXCR3+, HLA-DR+, CD45RA+, and CCR7+ TTD-specific CD8 T cells in COVID-096. Gates were set based on bulk CD8 T cells (representative gating strategy is shown in Supplementary Fig. 5). d Fraction of CD95+, CXCR3+, HLA-DR+, CD45RA+, and CCR7+ SARS-CoV-2-specific CD8 T cell responses (n = 6) detected in COVID-19 patients (n = 3). Individual points are annotated according to CD8 T cell specificity for individual patients as shown in Fig. 5b. Statistical significance was tested with a two-tailed Wilcoxon signed-rank test, P = 0.0312. Source data are provided as a Source data file. e Representative histogram of the expression levels (MFI) of PD-1 on SARS-CoV-2-specific CD8 T cells in COVID-096. f Expression levels (MFI) of PD-1 on SARS-CoV-2-specific CD8 T cell responses (n = 6) detected in COVID-19 patients (n = 3). Individual points are annotated according to CD8 T cell specificity for individual patients as shown in Fig. 5b. Statistical significance was tested with a two-tailed Wilcoxon signed-rank test, P = 0.0312. Source data are provided as a Source data file. g Representative gating used to assess the expression of IFNγ, TNF, IL-2, and IL-17 in CD8 T cells in patient COVID-143 after 12-h peptide stimulation with TTD. Percentages of cytokine-producing cells are indicated. Full gating strategy is shown in Supplementary Fig. 3a–c. h Functionality of CD8 T cells (n = 2) after 12-h peptide stimulation with TTD. DMSO control-subtracted percentages are shown. Two independent experiments were performed for patient COVID-143 with similar results. AD acute disease, CON convalescence, TTD TTDPSFLGRY, PTD PTDNYITTY, DTD DTDFVNEFY, pHLA peptide human leukocyte antigen. * P < 0.05.

References

    1. Worldometer. https://www.worldometers.info/coronavirus (2020).
    1. Shomuradova AS, et al. SARS-CoV-2 epitopes are recognized by a public and diverse repertoire of human T cell receptors. Immunity. 2020;53:1245–1257. doi: 10.1016/j.immuni.2020.11.004. - DOI - PMC - PubMed
    1. Wajnberg A, et al. Robust neutralizing antibodies to SARS-CoV-2 infection persist for months. Science. 2020;370:1227–1230. doi: 10.1126/science.abd7728. - DOI - PMC - PubMed
    1. Sekine T, et al. Robust T cell immunity in convalescent individuals with asymptomatic or mild COVID-19. Cell. 2020;183:158–168. doi: 10.1016/j.cell.2020.08.017. - DOI - PMC - PubMed
    1. Lau EHY, et al. Neutralizing antibody titres in SARS-CoV-2 infections. Nat. Commun. 2021;12:63. doi: 10.1038/s41467-020-20247-4. - DOI - PMC - PubMed

Publication types

MeSH terms