. 2021 May 10;12(1):2604.
doi: 10.1038/s41467-021-22870-1.

Inner hair cell stereocilia are embedded in the tectorial membrane

Affiliations

Inner hair cell stereocilia are embedded in the tectorial membrane

Pierre Hakizimana et al. Nat Commun. .

Abstract

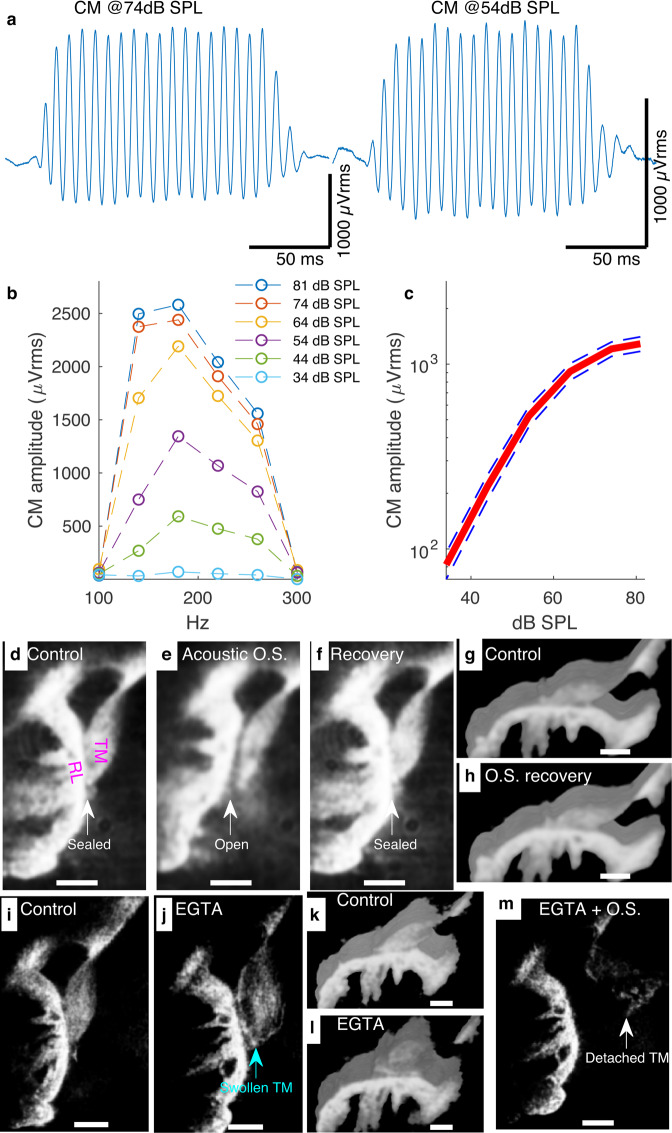
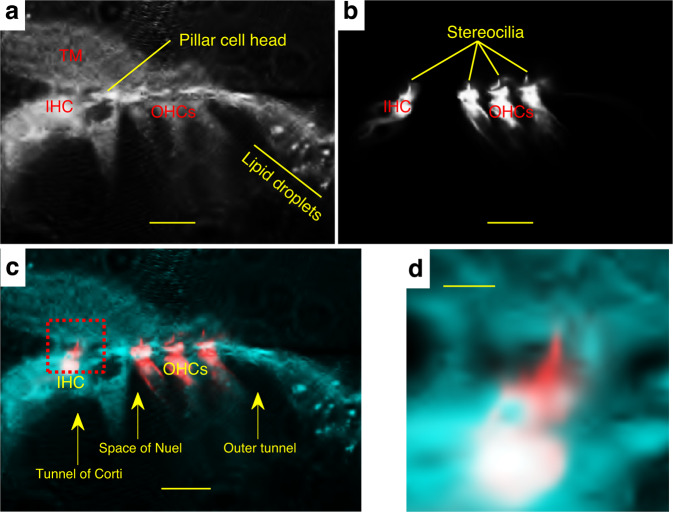
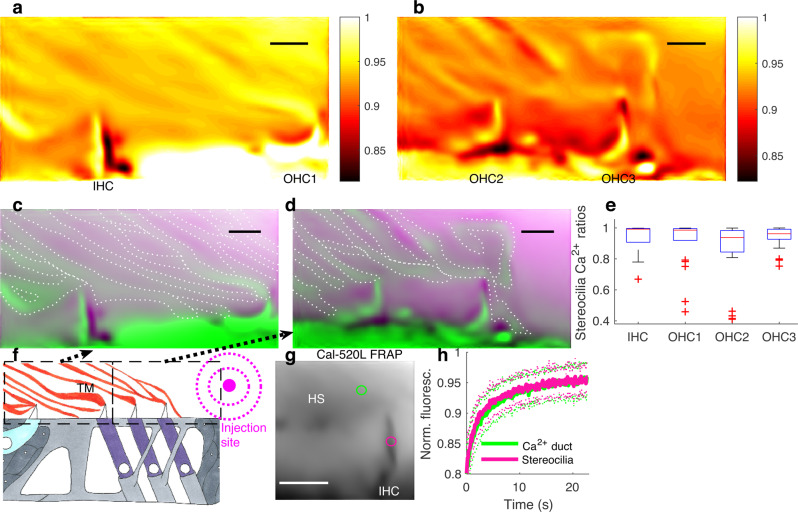
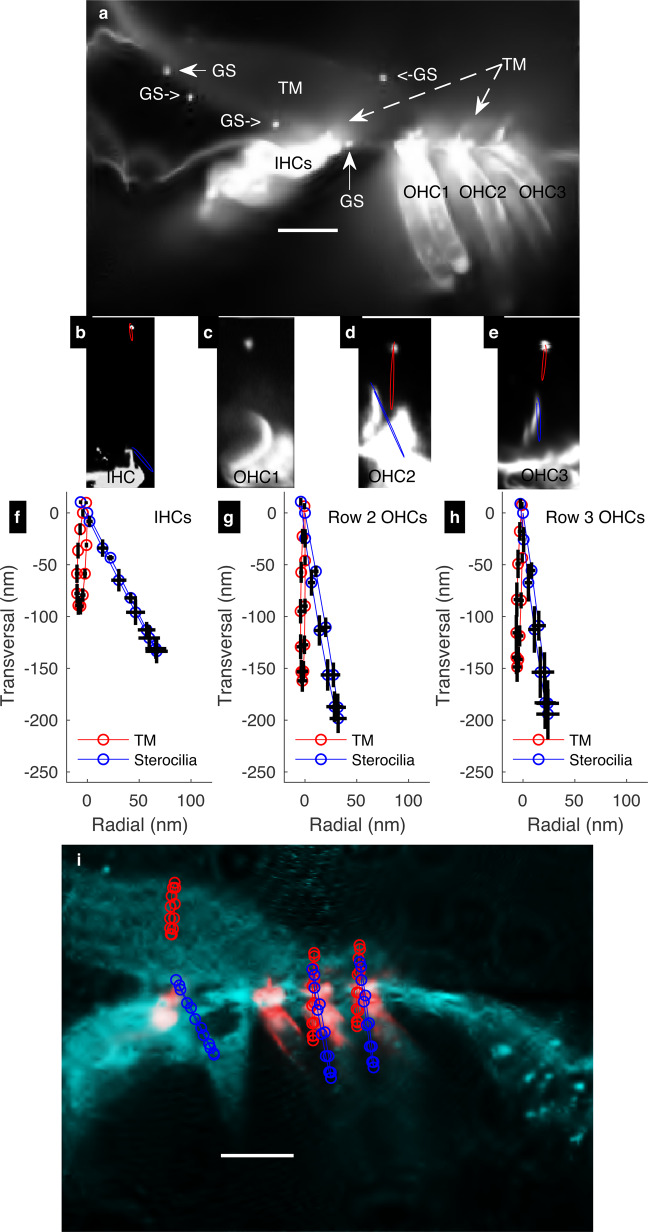
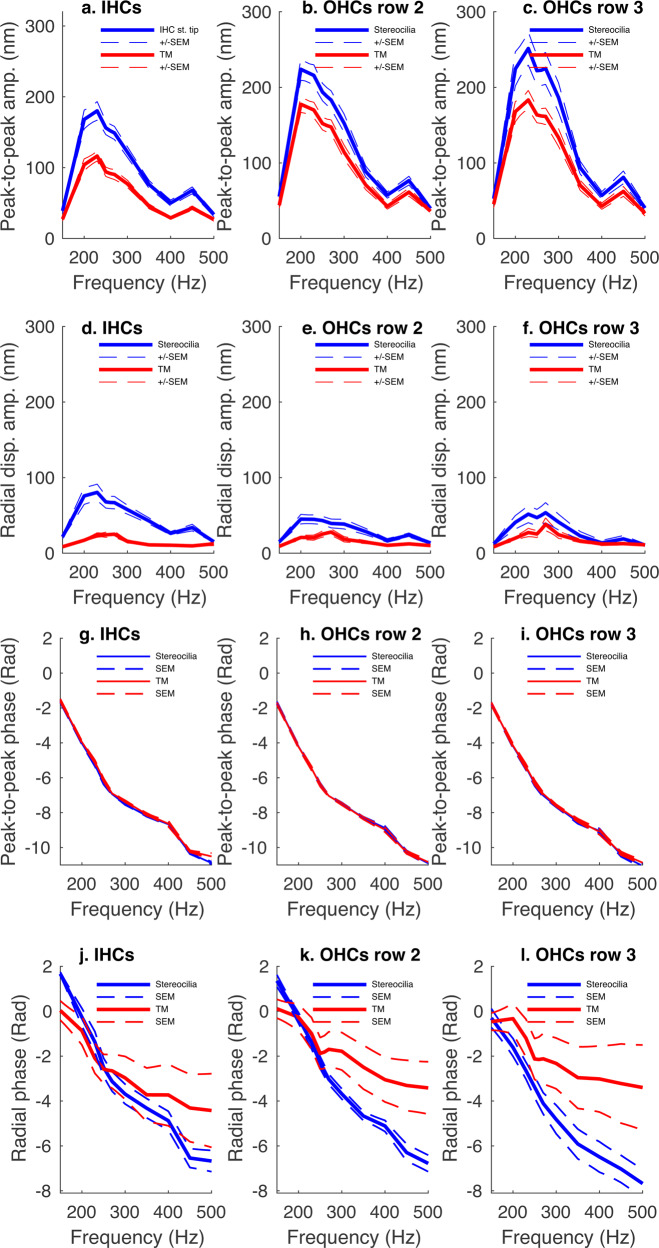
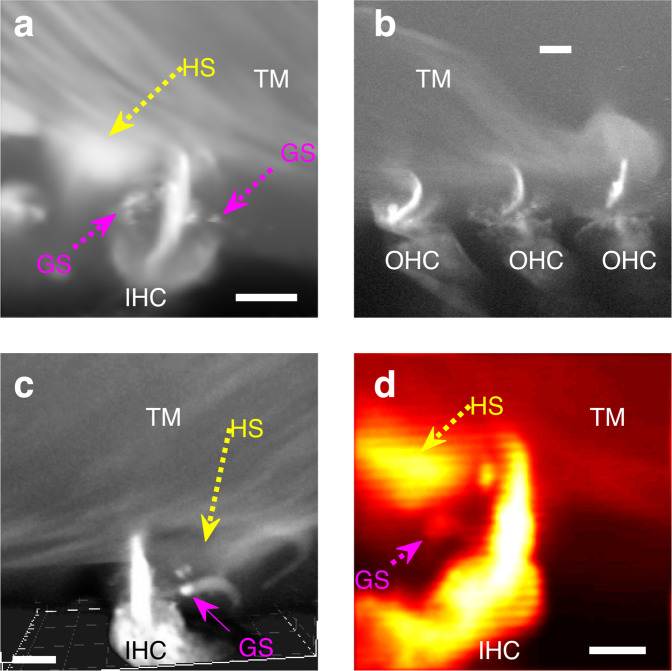
Mammalian hearing depends on sound-evoked displacements of the stereocilia of inner hair cells (IHCs), which cause the endogenous mechanoelectrical transducer channels to conduct inward currents of cations including Ca2+. Due to their presumed lack of contacts with the overlaying tectorial membrane (TM), the putative stimulation mechanism for these stereocilia is by means of the viscous drag of the surrounding endolymph. However, despite numerous efforts to characterize the TM by electron microscopy and other techniques, the exact IHC stereocilia-TM relationship remains elusive. Here we show that Ca2+-rich filamentous structures, that we call Ca2+ ducts, connect the TM to the IHC stereocilia to enable mechanical stimulation by the TM while also ensuring the stereocilia access to TM Ca2+. Our results call for a reassessment of the stimulation mechanism for the IHC stereocilia and the TM role in hearing.


Conflict of interest statement

The authors declare no competing interests.

Figures

Fig. 1
Fig. 1. The TM interacts tightly with the RL including in the IHC region.
ac Effect of sound pressure level (SPL) on CM amplitude in the cochlear apical region in the temporal bone preparation from the guinea pig. When the eardrum is acoustically stimulated by a speaker inserted in the ear canal, the hair cells produce the CM (the individual examples shown in a were recorded in response to a 180-Hz tone burst at 74 and 54 dB SPL respectively). The peak-to-peak amplitudes from the raw CM waveforms were plotted against frequency and for several dB SPL values to generate the frequency-tuning curves shown in b (the individual curves shown in b are from the same preparation as a). The CM peak-to-peak amplitudes associated with the frequency-tuning curves were then averaged for 26 preparations and plotted against dB SPL to produce the plot shown in c (solid line, mean; error bar, s.e.m). Source data are provided as a Source data file. d Reflected light confocal image of the OC. Note the sealed TM-RL interface including within the IHC region. e Acoustic overstimulation (OS)-induced contraction of the OC exposed a TM-RL gap. f When the OS stopped, the TM-RL gap resealed. g 3D reconstruction (29 z-stacks with a spacing of 1 µm) of the OC before acoustic overstimulation. The image was rotated to show the opposite side of the image shown in a. h 3D reconstruction (26 z-stacks with a spacing of 1 µm) of the OC after the preparation was allowed to recover from OS. i Image of the OC showing a tight TM-RL interface before EGTA treatment. j Upon EGTA injection, the TM swelled markedly, which exposed a TM-RL gap. k, l 3D reconstructions of the OC before (k) and after EGTA injection (l) show that the TM swelling associated with Ca2+ removal by EGTA caused the TM to loosen from the RL (both reconstructions were obtained from 41 z-stacks with a spacing of 1 µm). m When the EGTA injection was followed by OS, the TM detached from the RL. All scalebars 50 µm. Data in dh were representative of 37 different preparations. Data in il were representative of six preparations; Data in m are representative of five preparations.
Fig. 2
Fig. 2. IHC and OHC stereocilia bundles alike are TM-embedded.
a Reflected light confocal image of the OC showing tight interaction between the TM and RL. b Fluorescence confocal image of the same focal plane as in a after staining the OC with the membrane dye di-3-aneppdhq. c Overlay of images from a and b revealed that stereocilia of IHCs are TM-embedded in a similar fashion as the OHC stereocilia. d A closeup view on the IHC region (see red square in c) highlights the IHC stereocilia embedment within the TM. Scalebars: 25 µm in a, b, and c; 5 µm in d. Data in ad were representative of ten different preparations.
Fig. 3
Fig. 3. Ca2+ ducts connect the TM to the IHC and OHC stereocilia.
a, b Ca2+ ratios, revealed Ca2+-rich ducts that connect the TM to the stereocilia of IHCs and row 1 OHCs (a); row 2 and 3 OHCs (b), respectively. c Overlay of the Ca2+ ratio image (green) from a with the corresponding reference image (Cy5 signal, violet) to highlight the contacts between the stereocilia of the IHCs and row 1 OHCs with the Ca2+ ducts. Dotted white lines were manually drawn to depict the boundaries of the Ca2+ ducts. d Same as in c, for row 2 and row 3 OHC regions. e Ca2+ ratios in the stereocilia bundles of different hair cell types. OHC1, row 1 OHCs; OHC2, row 2 OHCs; OHC3, row 3 OHCs. For IHCs, n = 19 IHCs from 11 preparations; for OHC1, n = 22 row 1 OHCs from ten preparations; for OHC2, n = 34 row 2 OHCs from eight preparations; for OHC3, n = 33 row 3 OHCs from eight preparations. Box-and-whiskers plot represents the maxima, 75th percentile, median, 25th percentile, and minima. Source data are provided as a Source data file. f OC schematic highlighting the regions confocally imaged to obtain images shown in ad and injection site. g, h Single channel Cal-520L confocal image of the IHC stereocilia and the associated Ca2+ duct-rich TM region. The green and magenta ROIs (g) were used to investigate Ca2+ mobility in the Ca2+ duct-rich region and the IHC stereocilia, respectively by fluorescence recovery after photobleaching (FRAP). Averaged FRAP data associated with the ROIs shown in h (solid lines, means; error bars, s.d.). Source data are provided as a Source data file. For data in g, h, n = 41 same-location TM-IHC stereocilia from five different preparations. Scalebars 5 µm.
Fig. 4
Fig. 4. Sound-evoked movements of same-location TM and stereocilia bundles from IHCS and OHCS.
a A confocal image of di-3-aneppdhq-stained OC revealed bright granular structures (GSs) scattered around the TM. These structures were used to track the sound-evoked movements of the TM. be. Confocal images of same-location TM and stereocilia bundles in IHCs, row 1 OHCs, row 2 OHCs, and row 3 OHCs, respectively. Example of individual sound-evoked motion trajectories associated with these structures at the best frequency (b, d, and e) are shown in red for the TM and blue for the stereocilia. fh Sound-evoked motion trajectories at the best frequency for the TM (red) and same-location stereocilia bundle tip (bleu) in IHCs, row 2 OHCs, and row 3 OHCs, respectively as averaged in several preparations (solid line, mean; error bars, s.e.m.). For IHCs, n = 21 same-location TM and IHCs from nine preparations; for row 2 OHCs, n = 23 same-location TM and row 2 OHCs from 12 preparations; for row 3 OHCs n = 17 same-location TM and row 3 OHCs from 13 preparations. i The mean values for trajectory data from fh (for n values, see the previous sentence) were replotted on the composite image from Fig. 2c (representative of ten different preparations) to highlight the OC regions where the motion measurements were performed. All scalebars 25 µm.
Fig. 5
Fig. 5. Frequency dependency of sound-evoked motion amplitude and phase of the TM and same-location IHC and OHC stereocilia bundles.
ac Peak-to-peak motion amplitude for the TM (red) and same-region stereocilia (blue) computed from the associated trajectories (see Fig. 4f–h) and across frequencies (solid lines, mean; error bars, s.e.m.). Source data are provided as a Source data file. df Radial motion amplitude vs. frequency as computed from the trajectories described above (solid lines, mean; error bars, s.e.m.). Source data are provided as a Source data file. gi Frequency dependency motion phases of the TM (red) and same-location stereocilia (blue) as computed along the major axis of their respective trajectories described above (solid lines, mean; error bars, s.e.m). Source data are provided as a Source data file. jl Same as above except that the phase plotted was the one associated with the radial component of the motion (solid lines, mean; error bar, s.e.m.). Detailed information about the n values is given in the main text. Source data are provided as a Source data file.
Fig. 6
Fig. 6. IHC stereocilia are fully TM-embedded.
a, b The confocal images of the (dextran-conjugated) zFluor-stained OC show that zFluor stained the IHCs and OHCs as well as the TM. In addition, the zFluor fluorescence patterns revealed filamentous structures that contacted the stereocilia in similar fashion as the Ca2+ ducts, suggesting that the Ca2+ ducts had electrical properties that activated zFluor. The dye stained also the granular structures (GSs) as well as the Hensen’s stripe (HS) most likely due to the associated electrical environments. c 3D reconstruction of the IHC and the associated TM region. The 3D structure was rotated to show the opposite side of the view seen in a. Again, the GSs and Ca2+ duct-like structures can easily be visualized. In addition, some GSs surprisingly localized close to the cell’s cuticular plate, which is part of the RL, as seen in Fig. 4a, supporting that the TM-embedded the entire length of the IHC stereocilia bundles. The 3D reconstruction was prepared in Imaris 9.2 from 35 z-stacks with a z-step of 1 µm. d High-speed confocal image of the IHC stereocilia and the associated TM region captured during acoustic stimulation with a 1 kHz-tone, i.e., 5x their best frequency, and at 103 dB SPL. Again, the IHC stereocilia bundle can be seen TM-embedded even when stimulated with such a high frequency tone. The GS captured between the HS and the stereocilia bundle suggests that some GSs could have a connective role that links the HS to the base and tip of the stereocilia bundle. Data in ad were representative of five different preparations. All scalebars 5 µm.

References

    1. Denk W, Holt JR, Shepherd GM, Corey DP. Calcium imaging of single stereocilia in hair cells: localization of transduction channels at both ends of tip links. Neuron. 1995;15:1311–1321. doi: 10.1016/0896-6273(95)90010-1. - DOI - PubMed
    1. Kawashima Y, et al. Mechanotransduction in mouse inner ear hair cells requires transmembrane channel-like genes. J. Clin. Invest. 2011;121:4796–4809. doi: 10.1172/JCI60405. - DOI - PMC - PubMed
    1. Pan B, et al. TMC1 and TMC2 are components of the mechanotransduction channel in hair cells of the mammalian inner ear. Neuron. 2013;79:504–515. doi: 10.1016/j.neuron.2013.06.019. - DOI - PMC - PubMed
    1. Hudspeth AJ, Corey DP. Sensitivity, polarity, and conductance change in the response of vertebrate hair cells to controlled mechanical stimuli. Proc. Natl Acad. Sci. USA. 1977;74:2407–2411. doi: 10.1073/pnas.74.6.2407. - DOI - PMC - PubMed
    1. Corey DP, Hudspeth AJ. Ionic basis of the receptor potential in a vertebrate hair cell. Nature. 1979;281:675–677. doi: 10.1038/281675a0. - DOI - PubMed

Publication types