. 2021 May 10;12(1):2581.
doi: 10.1038/s41467-021-22676-1.

Lung cancer organoids analyzed on microwell arrays predict drug responses of patients within a week

Affiliations

Lung cancer organoids analyzed on microwell arrays predict drug responses of patients within a week

Yawei Hu et al. Nat Commun. .

Abstract

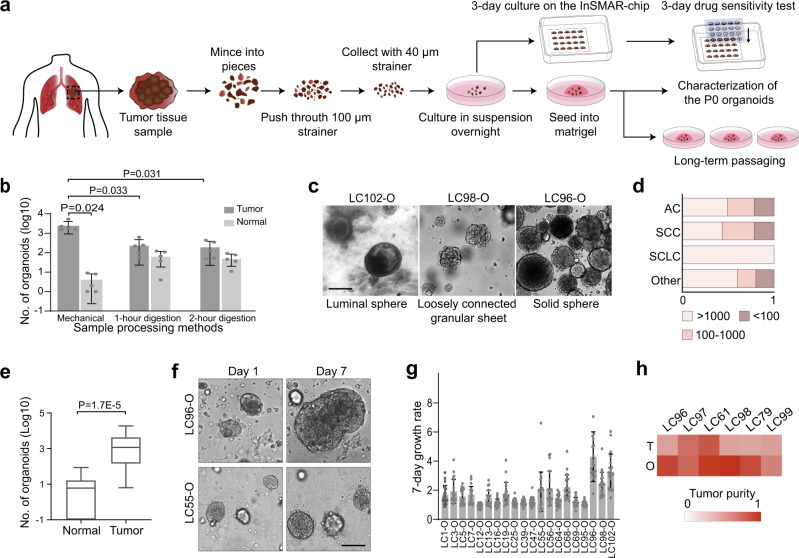
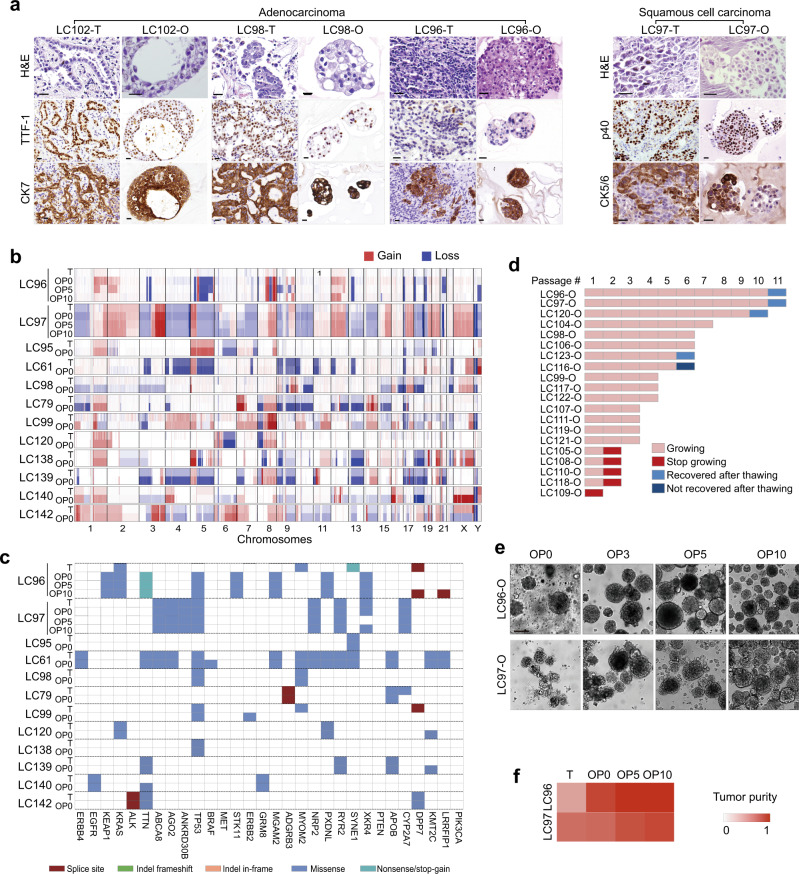
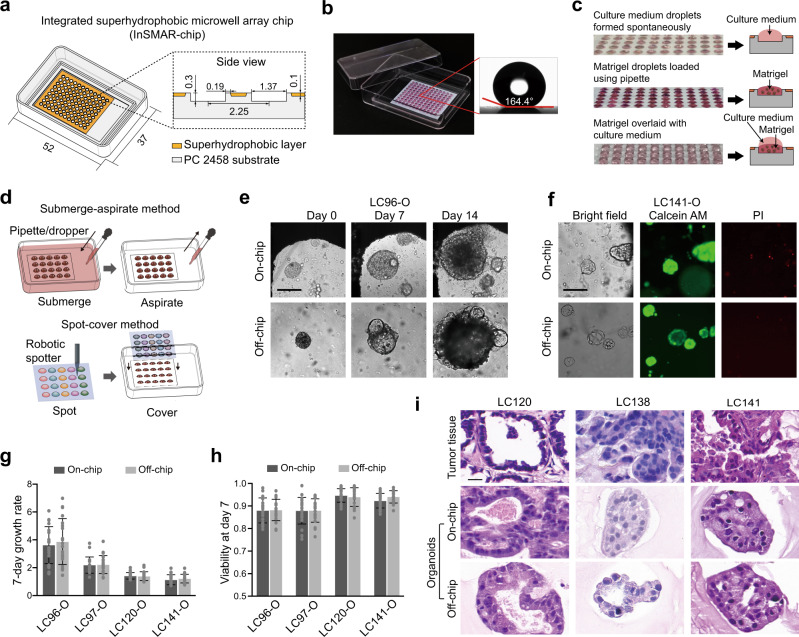
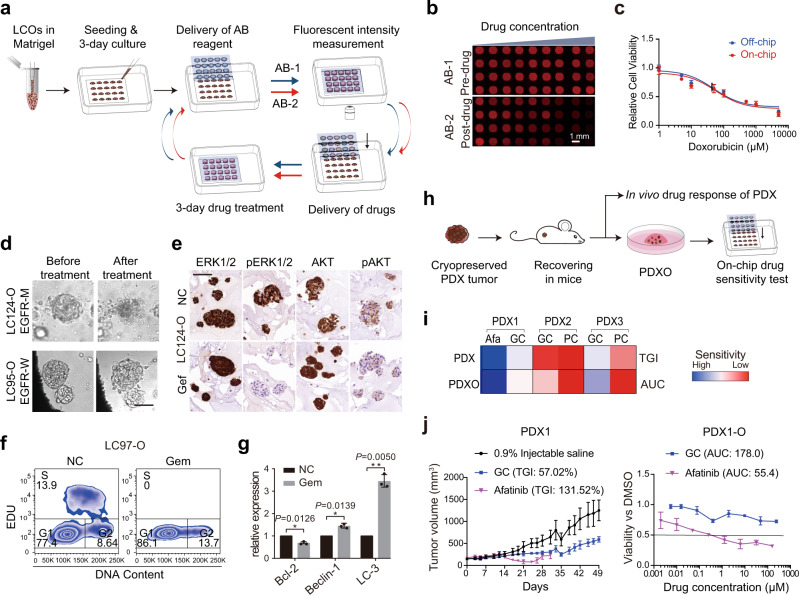
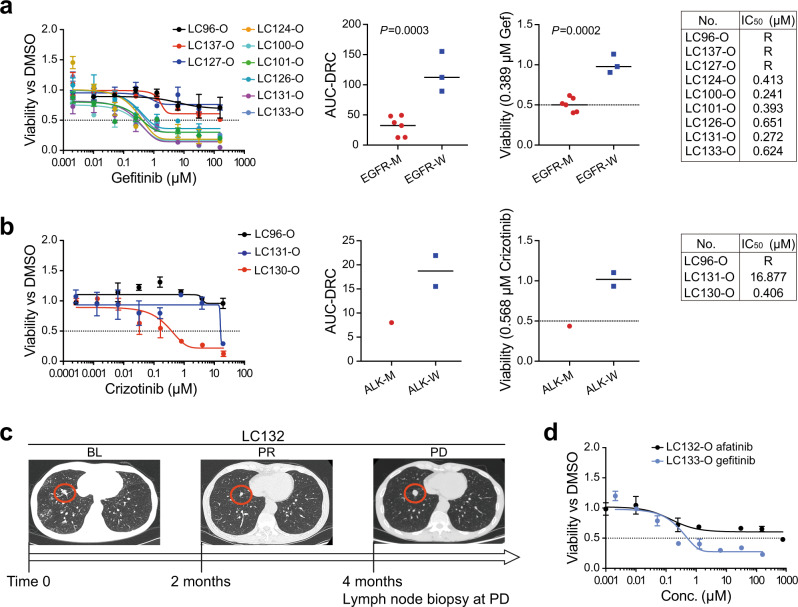
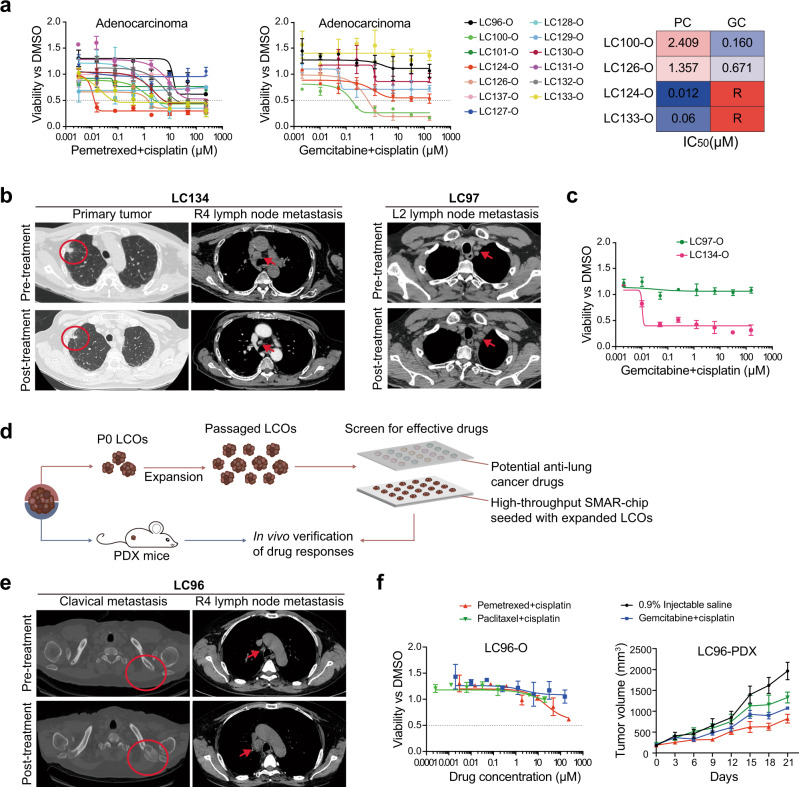
While the potential of patient-derived organoids (PDOs) to predict patients' responses to anti-cancer treatments has been well recognized, the lengthy time and the low efficiency in establishing PDOs hamper the implementation of PDO-based drug sensitivity tests in clinics. We first adapt a mechanical sample processing method to generate lung cancer organoids (LCOs) from surgically resected and biopsy tumor tissues. The LCOs recapitulate the histological and genetic features of the parental tumors and have the potential to expand indefinitely. By employing an integrated superhydrophobic microwell array chip (InSMAR-chip), we demonstrate hundreds of LCOs, a number that can be generated from most of the samples at passage 0, are sufficient to produce clinically meaningful drug responses within a week. The results prove our one-week drug tests are in good agreement with patient-derived xenografts, genetic mutations of tumors, and clinical outcomes. The LCO model coupled with the microwell device provides a technically feasible means for predicting patient-specific drug responses in clinical settings.


Conflict of interest statement

The authors declare no competing interests.

Figures

Fig. 1
Fig. 1. Generation of lung cancer organoids (LCOs) from lung tumor tissues.
a Diagram of the process of establishing LCOs from patient tumors for the subsequent long-term culture and the 1-week drug sensitivity test. b Bar graph comparing the numbers of organoids generated from tumor and normal tissues using the different methods (n = 5 biologically independent samples. Data are presented as mean ± SD. P values are calculated by two-sided Student’s t test). c Bright-field images of the LCOs with typical luminal sphere (left), solid sphere (right), and loosely connected granular sheet morphologies (middle). The experiments are repeated in 142 patient samples. Scale bars, 200 µm. d Stacked bar chart showing the fraction of lung cancer samples that produce <100, 100–1000, and >1000 LCOs by the mechanical processing method. e Comparison of the numbers of LCOs generated from tumor tissues and normal lung spheroids (NLSs) generated from paracancer tissues (n = 42 biologically independent samples, paired Student’s t test. The center line represents the median value. The bounds of box represent the median values of the upper half and the lower half. The bounds of whiskers represent the maxima and the minima. P value is calculated by two-sided Student’s t test). f Bright-filed images of two LCOs (LC55-O and LC96-O) at days 1 and 7 post seeding in the Matrigel. Scale bars, 200 µm. The experiments are repeated in 142 patient samples. g Seven-day growth rates of 20 LCO lines. The 7-day growth rate was calculated by tracking each individual organoid and dividing the area of LCOs at day 7 by that at day 1 (n = 20 biologically independent cells, data are presented as mean ± SD). h Heat map showing the fraction of cancer cells in the patient tissues and the derived organoids. Note the increased purity of cancer cells in the organoids compared to the original tumor tissues.
Fig. 2
Fig. 2. Characterization of lung cancer organoids.
a H&E and immunohistochemical staining images of lung cancer tissues and derived organoids. Shown are representative examples of LAC with acinar (LC102 and LC98) or solid (LC96) subtypes and LSC (LC97). The LCOs retained the tumor cell organizations and the expression patterns of the characteristic markers (TTF-1 and CK7 for LAC, p40, and CK5/6 for LSC). Scale bars, 20 µm. The experiments are repeated three times. b Heat map illustrating genome-wide copy number variations (CNVs) of lung cancer tissue–LCO pairs. DNA copy number gains (red) and losses (blue) found in the original lung cancer tissues are conserved in the corresponding tumor organoids. Signal amplification can be seen in all the LCOs compared to the original tumor tissues (T tissue, O organoids). c Overview of somatic mutations in cancer genes found in the tissue-organoid pairs. Shown is the most severe mutation per gene. d Stacked bar graphs illustrating the numbers of passages and the freeze–thaw status of 20 LCO lines underwent long-term culture. Each block indicates one passage or a freeze–thaw cycle. For example, LC96-O and LC97-O have been passaged more than ten times and successfully thawed after frozen at passage 10. LC116-O has been passaged five times but failed to recover after frozen. LC105-O stopped growing at passage 2. e Bright-field images showing the unchanged morphologies of LC96-O and LC97-O at P0, P3, P5, and P10. Scale bar, 200 µm. The experiments are repeated three times. f Heat map showing the increasing purities of tumor cells with passaging in LC96-O and LC97-O.
Fig. 3
Fig. 3. Characterization of the integrated superhydrophobic microwell array chip (InSMAR-chip).
a Schematics of the InSMAR-chip (left panel) and the cross-section view of the chip (right panel). b Photograph of an InSMAR-chip with a droplet array in the microwells. The contact angle of the superhydrophobic surface is >160°. c Photographs of the droplets in the microwells. (Top) The droplet array of culture medium formed spontaneously when the excess medium was aspirated out from the chip. (Middle) The droplet array of the Matrigel loaded into the microwells with an electronic pipette. (Bottom) The Matrigel droplets are overlaid with the culture medium by the spot-cover method. d Schematics of the reagent delivery methods on the InSMAR-chip: the submerge-aspirate method and the spot-cover method. e Images of LC96-O cultured on the InSMAR-chip (on-chip) and in the conventional microplate (off-chip), showing the continuous growths of LCOs in both conditions from days 0 to 14. Scale bar, 200 µm. The experiments are repeated three times. f Bright-field images of LC141-O at day 7 and fluorescent images showing the viability of organoids (green: live cells; red: dead cells). Scale bar, 200 µm. The experiments are repeated three times. g, h Comparison of the growth rates (g) and the viabilities (h) in four organoid lines indicating no significant difference between the LCOs cultured on-chip and off-chip (n = 20 biologically independent cells. Data are presented as mean ± SD). i H&E stain of the parental tumor tissue and the corresponding LCOs cultured on the InSMAR-chip and in the conventional multiwell plate. Scale bar: 20 µm. The experiments are repeated three times.
Fig. 4
Fig. 4. Validation of the organoid-based, 1-week drug sensitivity test on the InSMAR-chip.
a Diagram illustrating the procedure of the one-week drug sensitivity test performed on the InSMAR-chip. AB-1: cell viability test with alamaBlueTM before drug treatment; AB-2: cell viability test after drug treatment. b Mosaic of the fluorescent images of the microwell array showing the fluorescent signals of the microwells before (upper) and after (lower) the drug treatment. Scale bar, 1 mm. c Overlapped fitted dose–response curves measured on the InSMAR-chip (on-chip) and in the microplate (off-chip) (n = 4 biologically independent cells, data are presented as mean ± SD). d Bright-field images of the LCOs treated with gefitinib, demonstrating the organoids with the EGFR P.G719A mutation were killed while the organoids with the wild-type EGFR kept growing under the same condition. Scale bar, 100 µm. The experiments are repeated three times. e Images of the immunohistochemical staining indicated that gefitinib inhibits the ERK 1/2 and the AKT activities downstream of EGFR. NC, untreated, Gef gefitinib treated. Scale bar, 200 µm. The experiments are repeated three times. f Cell cycle analysis of LCOs cultured on the InSMAR-chip and treated with gemcitabine, showing the elimination of the cells in the S phase by the drug. g qPCR analysis of LCOs illustrating the variations in gene expressions upon the gemcitabine treatment (n = 3 independent experiments, two-sided Student’s t test, data are presented as mean ± SD). h Diagram of the comparison process of the in vitro drug sensitivity test using the PDX-derived organoids (PDXO) with the PDX-based drug test in mice. i Heat map of the drug effects demonstrating the consistency between the TGI (the tumor growth inhibition) of PDX and the AUC (the area under the dose–response curve) of PDXO. j A representative example (PDX1) illustrating that the on-chip drug sensitivity results of PDXO were in good agreement with the responses of PDX mice (n = 3 biologically independent animals in the left panel; n = 3 biologically independent LCOs in the right panel, data are presented as mean ± SD).
Fig. 5
Fig. 5. LCO-based 1-week drug sensitivity tests reflect the response of lung cancers to targeted drugs.
a Responses of LCOs to the TKI inhibitor, gefitinib, in agreement with EGFR mutations. The fitted dose–response curves (DRCs) represent the viabilities of nine LCOs exposed to a concentration gradient of gefitinib (n = 3 biologically independent cells, data are presented as mean ± SD). Three of the LCOs have wild-type EGFR and the other six harbor EGFR activation mutations sensitive to TKI inhibition. For both the area under the dose–response curve (AUC-DRC) and the viability Ctrough, the EGFR mutation (EGFR-M) and the EGFR wild-type (EGFR-W) groups were compared using the unpaired two-tail Student’s t test. The IC50 values listed in the table were interpolated from the fitted dose–response curves. R means IC50 is not available since the viability of the LCO is >50% under all the concentrations. b Responses of LCOs to crizotinib (ALK inhibitor). The organoid with the EML4-ALK rearrangement mutation (ALK-M: LC130-O) shows reduced viabilities, while those with the wild-type type of ALK (ALK-W: LC96-O and LC131-O) have no responses (n = 3 biologically independent cells, data are presented as mean ± SD). c CT scan images showing the lung tumor that developed resistance to afatinib as the primary tumor grew (red circles) and cervical lymph node metastases were developed in the course of the treatment. LCOs were generated from the biopsy of cervical lymph node resected at 4 months post the TKI treatment. d Fitted dose–response curves illustrating the distinct responses of LC132-O and LC133-O to TKIs, consistent with the patients’ responses (n = 3 biologically independent LCOs, data are presented as mean ± SD).
Fig. 6
Fig. 6. One-week drug sensitivity tests represent the response heterogeneity of tumors to chemotherapies.
a Heterogeneous responses of organoids derived from lung adenocarcinomas to the cisplatin-based chemotherapies. The fitted dose–response curves illustrate the responses of the AC organoids to pemetrexed + cisplatin (PC) and gemcitabin + cisplatin (GC) (n = 3 biologically independent cells, data are presented as mean ± SD). The heat map on the right are examples of two organoids sensitive to PC and the other two sensitive to GC. R means the IC50 is not available. b LCO-based on-chip drug sensitivity tests representing the responses of patient tumors to chemotherapies. The CT images on the left are a lung squamous cell carcinoma sensitive to the GC therapy. The red circles indicate the primary tumor and the red arrows point to the metastatic lymph nodes, both of which shrank upon the GC treatment. The CT scan images on the right showed a lung squamous cell carcinoma resists the GC therapy. The red arrows point to the station L2 lymph nodes where new metastasis was discovered after two cycles of adjuvant chemotherapy with GC. c Fitted the dose–response curves of the LCOs representing the diverse responses of the in vivo tumors to the chemotherapy (n = 3 biologically independent cells, data are presented as mean ± SD). d LCO-based on-chip screening of anticancer drugs effective to individual patients. e On-chip drug screening using the organoid line (LC96-O). The CT scan images showed the patient tumor metastasized to bone (red circles) and lymph node (red arrows) during chemotherapy with PC. f Drug–response curves on the left showing the results of the on-chip screening of three chemotherapies (PC, GC, and paclitaxel + cisplatin) using the LC96-O. The line charts on the right represent the tumor volume of the PDX exposed to the same chemotherapies as the LCOs. Both of the results consistently showed that none of the drug combinations could inhibit the growth of the tumor effectively (n = 3 biologically independent LCOs in the left panel; n = 4 biologically independent animals in the right panel, data are presented as mean ± SD).

Similar articles

Cited by

References

    1. Ferlay J, et al. Cancer incidence and mortality worldwide: sources, methods and major patterns in GLOBOCAN 2012. Int. J. Cancer. 2015;136:E359–E386. doi: 10.1002/ijc.29210. - DOI - PubMed
    1. Huang M, Shen A, Ding J, Geng M. Molecularly targeted cancer therapy: some lessons from the past decade. Trends Pharmacol. Sci. 2014;35:41–50. doi: 10.1016/j.tips.2013.11.004. - DOI - PubMed
    1. Masters GA, et al. Systemic therapy for stage IV non-small-cell lung cancer: American Society of Clinical Oncology clinical practice guideline update. J. Clin. Oncol. 2015;33:3488–3515. doi: 10.1200/JCO.2015.62.1342. - DOI - PMC - PubMed
    1. Hidalgo M, et al. Patient-derived xenograft models: an emerging platform for translational cancer research. Cancer Discov. 2014;4:998–1013. doi: 10.1158/2159-8290.CD-14-0001. - DOI - PMC - PubMed
    1. Tuveson D, Clevers H. Cancer modeling meets human organoid technology. Science. 2019;364:952–955. doi: 10.1126/science.aaw6985. - DOI - PubMed

Publication types

MeSH terms