. 2021 May 10;12(1):2606.
doi: 10.1038/s41467-021-22875-w.

Th17 cells contribute to combination MEK inhibitor and anti-PD-L1 therapy resistance in KRAS/p53 mutant lung cancers

Affiliations

Th17 cells contribute to combination MEK inhibitor and anti-PD-L1 therapy resistance in KRAS/p53 mutant lung cancers

David H Peng et al. Nat Commun. .

Abstract

Understanding resistance mechanisms to targeted therapies and immune checkpoint blockade in mutant KRAS lung cancers is critical to developing novel combination therapies and improving patient survival. Here, we show that MEK inhibition enhanced PD-L1 expression while PD-L1 blockade upregulated MAPK signaling in mutant KRAS lung tumors. Combined MEK inhibition with anti-PD-L1 synergistically reduced lung tumor growth and metastasis, but tumors eventually developed resistance to sustained combinatorial therapy. Multi-platform profiling revealed that resistant lung tumors have increased infiltration of Th17 cells, which secrete IL-17 and IL-22 cytokines to promote lung cancer cell invasiveness and MEK inhibitor resistance. Antibody depletion of IL-17A in combination with MEK inhibition and PD-L1 blockade markedly reduced therapy-resistance in vivo. Clinically, increased expression of Th17-associated genes in patients treated with PD-1 blockade predicted poorer overall survival and response in melanoma and predicated poorer response to anti-PD1 in NSCLC patients. Here we show a triple combinatorial therapeutic strategy to overcome resistance to combined MEK inhibitor and PD-L1 blockade.


Conflict of interest statement

D.L.G. declares advisory board work for Janssen, AstraZeneca, GlaxoSmithKline, and Sanofi. D.L.G. receives research grant funding from AstraZeneca, Janssen, Astellas, Ribon Therapeutics, NGM Therapeutics, and Takeda. L.A.B. declares consulting work for AstraZeneca, AbbVie, GenMab, BergenBio, Pharma Mar, SA. L.A.B. receives research grant funding from AbbVie, AstraZeneca, GenMab, Tolero Pharmaceuticals. All other authors declare that they have no competing interests.

Figures

Fig. 1
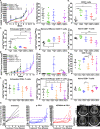
Fig. 1. MEK inhibition increases PD-L1 expression while PD-L1 blockade upregulates MAPK signaling.
A Heatmap of reverse phase protein array (RPPA) profile showing statistically significant (FDR < 0.05) differentially regulated proteins in 344SQ murine KP syngeneic tumors treated with selumetinib (AZD624) MEK inhibitor (black) or vehicle (grey) for 4 weeks. B Western blot of PD-L1 and β-actin in 344SQ tumors treated with vehicle or AZD6244 for 4 weeks. Number indicates tumor replicate. C Western blot of ZEB1, PD-L1, and β-actin in 393P tumors treated with AZD6244 for 4 weeks or 8 weeks when tumors were sensitive (AZD-S) or resistant (AZD-R) to MEK inhibition, respectively. Number indicates tumor replicate. D Top: qPCR analysis of CD274 (PD-L1) expression in 393P (blue) and 344SQ (red) cell lines treated with DMSO or 10 µM AZD6244 for 48 h. Bottom: percent of PD-L1+393P (blue) and 344SQ cells (red) analyzed by flow cytometry following treatment with indicated concentrations of AZD6244 for 48 h. Data are presented as mean values ± SD. n = 3. Data were analyzed using unpaired Students t test. **P < 0.01; ***P < 0.001; ****P < 0.0001. E Western blotting of indicated proteins in 393P and 344SQ cells treated with indicated concentrations of AZD6244 for 48 h. F Heatmap of RPPA profile showing statistically significant (FDR < 0.05) differentially regulated proteins in 344SQ tumors treated with PD-L1 blocking antibody (black) or IgG isotype control (grey) for 7 weeks. G Western blotting of indicated proteins of 344SQ tumors treated with IgG isotype control or PD-L1 blocking antibody for 7 weeks. Number indicates tumor replicate.
Fig. 2
Fig. 2. MEK inhibition in combination with PD-L1 blockade initially reduces lung tumor growth and metastasis, but ultimately develops resistance to therapy.
A Left: in vivo tumor volume measurements at indicated time points for 344SQ subcutaneous tumors in syngeneic wild-type mice after daily treatment with solvent (black), 25 mg/kg AZD6244 (blue), or weekly treatment with 200 µg PD-L1 blocking antibody (green) as single-agents or in combination. Treatment start time denoted by black arrow, combination sensitive group denoted by (S) (red), combination resistant group denoted by (R) (purple). Right: quantification of lung metastatic surface nodules in the indicated experimental groups at the endpoint of treatments. Data are presented as mean values ± SD. N = 10 (Solvent+IgG), n = 10 (Solvent+anti-PD-L1), n = 6 (AZD6244 + IgG), n = 4 (AZD6244 + anti-PD-L1 S), and n = 5 (AZD6244 + anti-PD-L1 R) mice. Data were analyzed using unpaired Students’ t test. **P < 0.01. B Percent of CD45+CD3+ total CD8+ T cells in 344SQ tumors with indicated treatment groups at endpoint of experiment in A. Data are presented as mean values ± SD. N = 3–5 mice per group. Data were analyzed using unpaired Students t test. *P < 0.05; **P < 0.01; ***P < 0.001. C Left: percent of PD1+TIM3+ exhausted CD8+ T cells. Middle: percent of CD44+CD62L− memory/effector CD8+ T cells. Right: percent of CD44+CD62+ naive CD8+ T cells. All populations gated from CD8+ T cells in B. Data are presented as mean values ± SD. N = 3–5 mice per group. Data were analyzed using unpaired Students t test. N.S. not significant; *P < 0.05; **P < 0.01; ***P < 0.001. D Left: in vivo tumor volume measurements at indicated time points for 393P subcutaneous tumors in syngeneic wild-type mice after daily treatment with solvent (black), 25 mg/kg AZD6244 (blue), or weekly treatment with 200 µg PD-L1-blocking antibody (green) as single-agents or in combination. Treatment start time denoted by the black arrow. Treatment start time denoted by black arrow, combination sensitive group denoted by (S) (red), combination resistant group denoted by (R) (purple). Right: quantification of lung metastatic surface nodules in the indicated experimental groups at the endpoint of treatments. Data are presented as mean values ± SD. n = 5 mice per group. Data were analyzed using unpaired Students’ t test. **P < 0.01. E Percent of CD45+CD3+ total CD8+ T cells in 393P tumors with indicated treatment groups at endpoint of experiment in D. Data are presented as mean values ± SD. N = 5 mice per group. Data were analyzed using unpaired Students t test. **P < 0.01; ***P < 0.001. F Left: percent of PD1+TIM3+ exhausted CD8+ T cells. Middle: percent of CD44+ CD62L− memory/effector CD8+ T cells. Right: percent of CD44+CD62+ naive CD8+ T cells. All populations gated from CD8+ T cells in E. Data are presented as mean values ± SD. N = 5 mice per group. Data were analyzed using unpaired Students t test. *P < 0.05. G Left: percent change in overall lung tumor area of age-matched KrasG12D;p53−/− (KP) at indicated time points following weekly treatment with 200 µg PD-L1 blocking antibody monotherapy (blue) or in combination (red) with daily treatments of 25 mg/kg AZD6244, as assessed by micro-CT imaging of mouse lungs. Right: representative cross-sectional micro-CT images of KP mouse lungs before indicated treatment (Week 0) and treatment endpoint (Week 17). Yellow circles outline representative target lesions. Each line represents an individual mouse.
Fig. 3
Fig. 3. Combination therapy-resistant tumors have increased levels of Th17 CD4+ T cells.
A Cytokine qPCR array heatmap of 344SQ tumors from the experiment in Fig. 2A. Solvent + IgG (black), 25 mg/kg AZD6244 (blue) or weekly treatment with 200 µg PD-L1 blocking antibody (green) as single-agents or in combination sensitive group denoted by (S) (red), combination resistant group denoted by (R) (purple). B Cytokine qPCR array heatmap of 393P tumors from the experiment in Fig. 2D. C Top: percent of CCR5+RORγt+ and CCR6+RORγt+Th17 CD4+ T cells in 344SQ tumors from treatment experiment in Fig. 2A. All populations gated from total CD4+ T cells in Supplementary Fig. S3D. Bottom: representative dot plot for CCR5+RORγt+ and CCR6+RORγt+Th17 CD4+ T cells. Data are presented as mean values ± SD. N = 3–5 mice per group. Data were analyzed using unpaired Students’ t test. *P < 0.05; **P < 0.01. D Percent of CCR5+RORγt+ and CCR6+RORγt+Th17 CD4+ T cells in 393P tumors from treatment experiment in Fig. 2D. Data are presented as mean values ± SD. N = 3–5 mice per group. Data were analyzed using unpaired Students’ t test. *P < 0.05; **P < 0.01. E RORγt IHC stains of KP mice lung tumors treated weekly with 200 µg of PD-L1-blocking antibody alone or in combination with 25 mg/kg daily treatments of AZD6244 for 17 weeks from the experiment in Fig. 2G. Scale bar = 50 µm.
Fig. 4
Fig. 4. MEK inhibition contributes to the differentiation of Th17 cells, which secrete IL-17 and IL-22 to promote drug resistance and invasiveness in lung cancer cells.
A QPCR analysis of TGF-β (black), IL-6 (green), and IL-23 (purple) gene expression in 344SQ (left) and 393P (right) murine KP cell lines after treatment with 10 µM AZD6244 for 48 h. Data are presented as mean values ± SD. n = 3. Data were analyzed using unpaired Students’ t test. *P < 0.05; **P < 0.01; ***P < 0.001. B Left: percent of CD4+ T cells gated from CD45+CD3+ cells in total anti-CD3/CD28-activated splenocytes (Sp) co-cultured with 393P (blue) or 344SQ cells (red) and treated with 10 µM AZD6244 for 96 h. Right: percent of CCR5+RORγt+ Th17 cells gated from total CD4+ T-cell population (Left) following co-culture and treatment conditions previously described. Data are presented as mean values ± SD. n = 3–4. Data were analyzed using unpaired Students’ t test. *P < 0.05. C IL-17 concentration as measured by ELISA in conditioned media of 344SQ cells cultured alone or in co-culture with splenocytes (Sp), treated with 10 µM AZD6244 and/or 20 µg/ml PD-L1 blocking antibody for 96 h. Data are presented as mean values ± SD. n = 3–4. Data were analyzed using unpaired Students’ t test. **P < 0.01. D Quantification and representative images of 393P and 344SQ cell invasion through matrigel-coated transwell inserts ± IL-17 and IL-22 cytokine stimulation. Data are presented as mean values ± SD. n = 3. Data were analyzed using unpaired Students’ t test. *P < 0.05; **P < 0.01. Scale bar = 200 µm. E In vitro cell survival response after 72-hour selumetinib (AZD6244) treatment in 393P and 344SQ cells ± IL-17 and IL-22 cytokine stimulation. Data are presented as mean values ± SD. N = 6–8 replicates per concentration. F Western blot of indicated proteins in 393P and 344SQ cells treated with IL-17 and/or IL-22 individually or in combination for 96 h. G QPCR analysis of IL22RA1 expression in panel of murine epithelial cells (grey) or mesenchymal cells (black). Data are presented as mean values ± SD. n = 3 technical triplicates. Data were analyzed using unpaired Students t test. ****P < 0.0001. H Proposed working model. Initial response to combination therapy promotes the release of IL-6, TGF-β, and IL-23 cytokines by resistant tumor cells. The released cytokines promote the CD4+ T-cell differentiation into Th17 cells, which secrete IL-17 and IL-22 to promote resistance to MEK inhibition and PD-L1 blockade.
Fig. 5
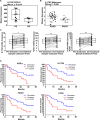
Fig. 5. Th17 gene signatures correlate with decrease in survival in IO-treated melanoma patients.
A IL17RC mRNA levels in NSCLC patients that exhibited progressive disease (PD) versus partial response (PD) to anti-PD-1 therapy (nivolumab). 12 patients defined as a progressive disease and four patients defined as a partial response. Statistics calculated using two-sided Wilcoxon matched pair rank test with significance at P < 0.05. B Pre-treatment IL17RC mRNA levels in melanoma patients that exhibited progressive or stable disease (PD/SD) versus partial or complete response (PR/CR) to anti-PD-1 therapy (nivolumab). 36 patients defined as PD/SD and 10 patients defined as PR/CR. Statistics calculated using two-sided Wilcoxon matched pair rank test with significance at P < 0.05. C Left: IL17RA, middle: TGFb1, and right: CCR5 mRNA expression levels in melanoma patient samples in pre- and on-treatment of nivolumab. Statistical difference was determined using Wilcoxon matched pair rank test. 39 independent patient samples for pre-treatment and on-treatment. Boxplots are shown as the median ± 1 quartile, whiskers extend to an extreme data point. Statistics calculated using two-sided Wilcoxon matched pair rank test with significance at *P < 0.05, **P < 0.01. D Kaplan–Meier curves predicting survival of nivolumab-treated melanoma patients based on net changes in RORγt, IL17RA, TGFB1, and CCR5. Percent survival decreases shown in blue and increase shown in red. Statistical difference was determined using the Log-rank Cox test.
Fig. 6
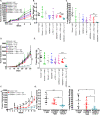
Fig. 6. Neutralizing IL-17 abrogates resistance to MEK inhibition and PD-L1 blockade combination therapy.
A In vivo tumor volume measurements at indicated time points for 344SQ subcutaneous tumors in syngeneic wild-type mice after daily treatments with 25 mg/kg AZD6244 in combination with weekly treatments with 200 µg PD-L1 and/or 200 µg IL-17 blocking antibody beginning at week 3 of tumor growth. Solvent + IgG (black), daily 25 mg/kg AZD6244 (blue), weekly treatment with 200 µg PD-L1 blocking antibody (green), weekly treatment with 200 µg IL-17 blocking antibody (grey), combination blocking antibodies 200 µg PD-L1 + 200 µg IL17 (purple), combination 25 mg/kg AZD6244 + weekly 200 µg blocking antibody IL17 (pink), combination 25 mg/kg AZD6244 + weekly 200 µg blocking antibody PD-L1 (red), triple combination 25 mg/kg AZD6244 + weekly 200 µg blocking antibody PD-L1 + 200 µg blocking antibody IL17 (teal). Data are presented as mean values ± SD. n = 4–5. Data were analyzed using unpaired Students’ t test. *P < 0.05. B, C Tumor weights B and lung metastatic nodules C of 344SQ tumors at endpoint of experiment in A. Data are presented as mean values ± SD. n = 4–5. Data were analyzed using unpaired Students’ t test. *P < 0.05; **P < 0.01. D In vivo tumor volume measurements at indicated time points for 393P-AR1 subcutaneous tumors in syngeneic WT mice after daily treatments with 25 mg/kg AZD6244 in combination with weekly treatments with 200 µg PD-L1 and/or 200 µg IL-17 blocking antibody beginning at day 12 of tumor growth. Solvent + IgG (black), daily 25 mg/kg AZD6244 (blue), weekly treatment with 200 µg PD-L1 blocking antibody (green), weekly treatment with 200 µg IL-17 blocking antibody (grey), combination blocking antibodies 200 µg PD-L1 + 200 µg IL17 (purple), combination 25 mg/kg AZD6244 + weekly 200 µg blocking antibody IL17 (pink), combination 25 mg/kg AZD6244 + weekly 200 µg blocking antibody PD-L1 (red), triple combination 25 mg/kg AZD6244 + weekly 200 µg blocking antibody PD-L1 + 200 µg blocking antibody IL17 (teal). Data are presented as mean values ± SD. n = 4–5 mice per group. Data were analyzed using unpaired Students’ t test. **P < 0.01. E Tumor weights of 393P-AR1 tumors at endpoint of experiment after indicated treatment combinations from D. Data are presented as mean values ± SD. n = 5. Data were analyzed using unpaired Students’ t test. *P < 0.05; ***P < 0.001. F In vivo tumor volume measurements at indicated time points for 344SQ subcutaneous tumors in syngeneic wild-type mice after daily treatments with 25 mg/kg AZD6244 in combination with weekly treatments with 200 µg PD-L1 blocking antibody or 200 µg IL-17A blocking antibody. Black arrow indicates treatment start time. Solvent + IgG (black), combination 25 mg/kg AZD6244 + weekly 200 µg blocking antibody PD-L1 (red), triple combination 25 mg/kg AZD6244 + weekly 200 µg blocking antibody PD-L1 + 200 µg blocking antibody IL17 (teal). Data are presented as mean values ±SD. n = 9 mice per group. Data were analyzed using unpaired Students’ t test. *P < 0.05; **P < 0.01; ***P < 0.001. G, H Tumor weights G and lung metastatic nodules H of 344SQ tumors at endpoint of experiment in F. Data are presented as mean values ± SD. n = 9 mice per group. Data were analyzed using unpaired Students’ t test. *P < 0.05; *P < 0.01; ***P < 0.001.
Fig. 7
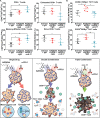
Fig. 7. Neutralizing IL-17 promotes pro-inflammatory tumor immune microenvironment.
A Percent of CD45+CD3+ total CD8+ T cells and percentage of exhausted, memory/effector, and naive CD8+ T-cell subpopulations gated by the indicated markers from 344SQ tumors from the experiment in Fig. 6F. Data are presented as mean values ± SD. n = 4–5. Data were analyzed using unpaired Students’ t test. *P < 0.05; **P < 0.01. B Percent of CCR6+ and CCR5+RORγt+ Th17 cells gated from total CD4+ T-cell population. Data are presented as mean values ± SD. n = 4–5. Data were analyzed using unpaired Students’ t test. *P < 0.05; **P < 0.01. C Proposed working model of MEK inhibitor and anti-PD-L1 combinatorial drug resistance. Initial response to combination therapy promotes CD4+ T-cell differentiation into Th17 cells, which secrete IL-17 and IL-22 to promote resistance to MEK inhibition and PD-L1 blockade. Neutralization of IL-17 in combination with MEK inhibition and PD-L1 blockade abrogates resistant tumor outgrowth.

Similar articles

Cited by

References

    1. Cox AD, Fesik SW, Kimmelman AC, Luo J, Der CJ. Drugging the undruggable RAS: mission possible? Nat. Rev. Drug Discov. 2014;13:828–851. doi: 10.1038/nrd4389. - DOI - PMC - PubMed
    1. Wang Y, Kaiser CE, Frett B, Li H-y. Targeting mutant KRAS for anticancer therapeutics: a review of novel small molecule modulators. J. Med. Chem. 2013;56:5219–5230. doi: 10.1021/jm3017706. - DOI - PMC - PubMed
    1. Blumenschein GR, Jr., et al. A randomized phase II study of the MEK1/MEK2 inhibitor trametinib (GSK1120212) compared with docetaxel in KRAS-mutant advanced non-small-cell lung cancer (NSCLC) dagger. Ann. Oncol. 2015;26:894–901. doi: 10.1093/annonc/mdv072. - DOI - PMC - PubMed
    1. Jänne PA, et al. Selumetinib plus docetaxel compared with docetaxel alone and progression-free survival in patients with KRAS-mutant advanced non–small cell lung cancer. JAMA. 2017;317:1844. doi: 10.1001/jama.2017.3438. - DOI - PMC - PubMed
    1. Chen Z, et al. A murine lung cancer co-clinical trial identifies genetic modifiers of therapeutic response. Nature. 2012;483:613–617. doi: 10.1038/nature10937. - DOI - PMC - PubMed

Publication types

MeSH terms

Substances