. 2021 May 10;11(1):9846.
doi: 10.1038/s41598-021-89128-0.

Bortezomib induces methylation changes in neuroblastoma cells that appear to play a significant role in resistance development to this compound

Affiliations

Bortezomib induces methylation changes in neuroblastoma cells that appear to play a significant role in resistance development to this compound

Karolina Łuczkowska et al. Sci Rep. .

Abstract

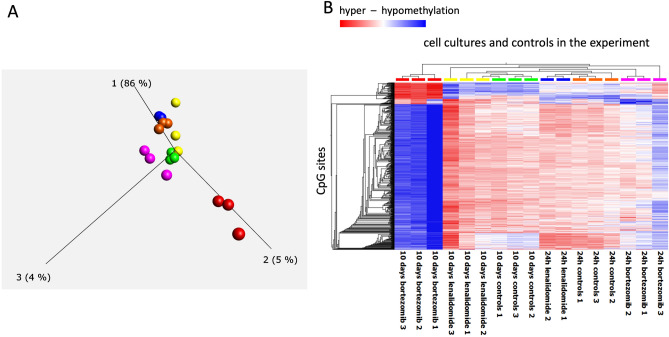
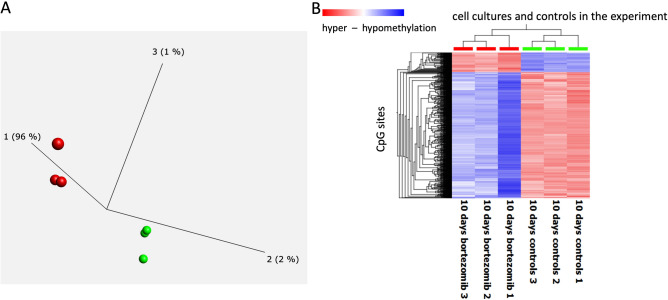
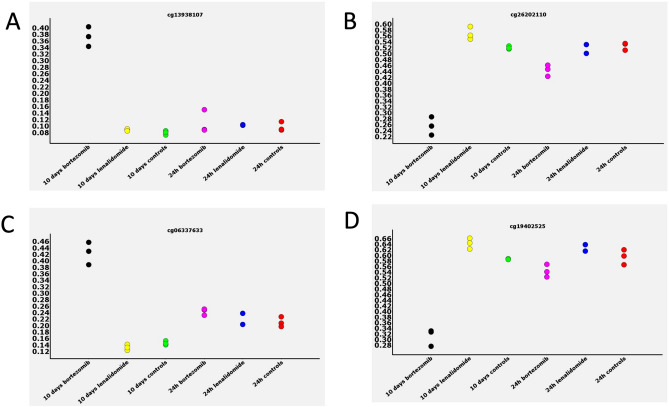
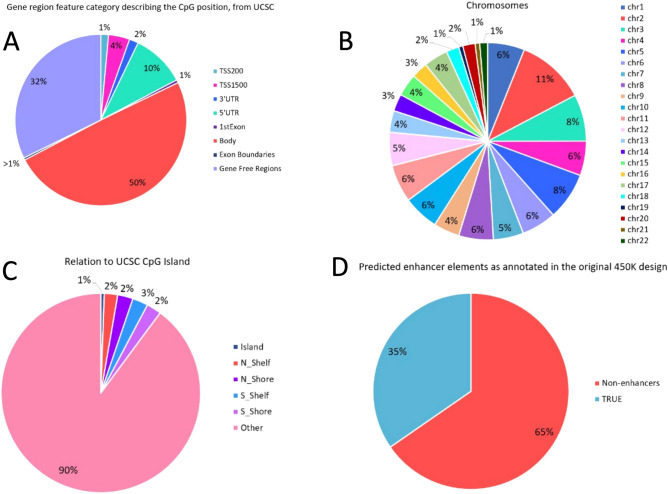
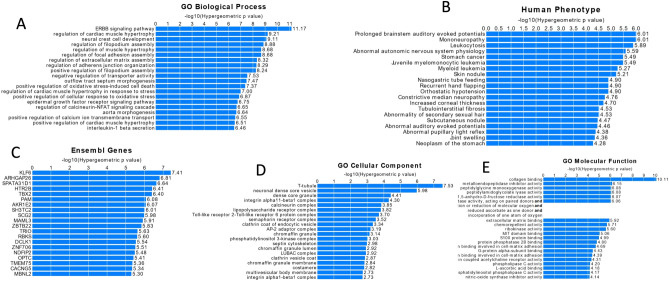
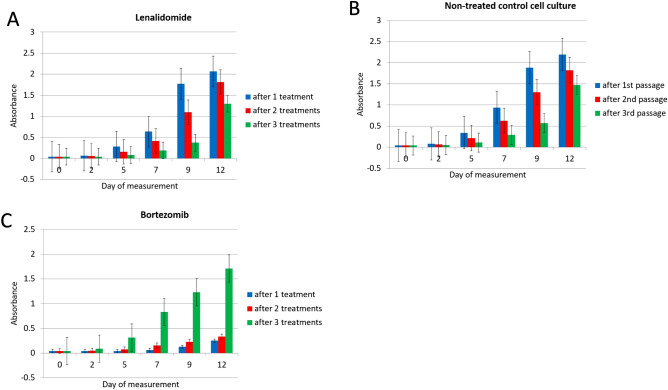
The anticancer activity of bortezomib (BTZ) has been increasingly studied in a number of indications and promising results for the use of this treatment have been shown in neuroblastoma. As BTZ treatment is usually administered in cycles, the development of resistance and side effects in patients undergoing therapy with BTZ remains a major challenge for the clinical usage of this compound. Common resistance development also means that certain cells are able to survive BTZ treatment and bypass molecular mechanisms that render BTZ anticancer activity. We studied the methylome of neuroblastoma cells that survived BTZ treatment. Our results indicate that BTZ induces pronounced genome wide methylation changes in cells which recovered from the treatment. Functional analyses of identified methylation changes demonstrated they were involved in key cancer pathology pathways. These changes may allow the cells to bypass the primary anticancer activity of BTZ and develop a treatment resistant and proliferative phenotype. To study whether cells surviving BTZ treatment acquire a proliferative phenotype, we repeatedly treated cells which recovered from the first round of BTZ treatment. The repetitive treatment led to induction of the extraordinary proliferative potential of the cells, that increased with subsequent treatments. As we did not observe similar effects in cells that survived treatment with lenalidomide, and non-treated cells cultured under the same experimental conditions, this phenomenon seems to be BTZ specific. Overall, our results indicate that methylation changes may play major role in the development of BTZ resistance.


Conflict of interest statement

The authors declare no competing interests.

Figures

Figure 1
Figure 1
PCA (Principle Component Analyses)—(A) and heatmap—(B), illustrating results of genome wide methylation changes in cells under treatment and controls. PCA indicates that genome wide methylation profile of cells recovered from BTZ treatment after 10 days (red color -three replicates) have significantly different methylation profile than cells in other cultures in the experiment including: yellow—cells recovered from treatment with lenalidomide (after 10 days), green—controls after recovery, blue—cells 24 h after treatment with lenalidomide, orange—24 h treatment controls, pink—cells 24 h after treatment with BTZ. Heatmap illustrating unsupervised clustering analyses of methylation changes at the most informative CpG sites in the data set verifies PCA analyses with cells recovered after BTZ treatment (red color top of chart) displaying significant hypomethylation (blue color in the heatmap) and a degree of hypermethylation (red color in the heatmap) in comparison to other cell cultures in the experiment.
Figure 2
Figure 2
PCA (Principle Component Analyses)—(A) and heatmap—(B), illustrating results of genome wide methylation changes in cells under treatment and controls. PCA indicates three replicates of genome wide methylation profiles of cells recovered after BTZ treatment after 10 days (red color) have significantly different methylation profile than controls (green color). Heatmap illustrating unsupervised clustering analyses of methylation changes at the most informative CpG sites in the data set verifies PCA analyses with cells recovered after BTZ treatment (red color top of chart) displaying significant hypomethylation (blue color in the heatmap) and a degree of hypermethylation (red color in the heatmap) in comparison to controls (green, top of chart).
Figure 3
Figure 3
Examples of the methylation changes observed at specific CpG sites across all the treatments and controls. The beta-values representing methylation levels are plotted at the vertical axis and the type of cell at the horizontal axis. Gain of methylation (hypermethylation) in the cells treated with BTZ and recovered from treatment was observed at CpG sites in (A) and (C), and loss of methylation at CpG sites in (B) and (D).
Figure 4
Figure 4
Genomic localization analyses of CpG sites differentially methylated in cells recovered after BTZ treatment and controls. (A)—according to the gene functional elements, (B)—at chromosomes, (C)—regarding CpG islands, (D)—enhancer occupation sites.
Figure 5
Figure 5
The output of GREAT analyses for five ontology terms linked to the methylation changes for five ontology categories: A—GO Biological Processes, B—Human Phenotype, C—Ensemble Genes, D—GO Cellular Component, E—GO Molecular Function.
Figure 6
Figure 6
Proliferative potential analyses of cells (MTT assay). The “absorbance” measurement reflects the number of cells in each culture (see materials and methods) and was assessed in cells undergoing and recovered from one—blue, two—red and three—rounds of treatment. (A)—lenalidomide, (B)—non-treated controls and (C)—BTZ. The cell count increase was measured after 2, 5, 7, 9 and 12 days of the culture, see also Figure S1 for the graphical outline of this experimental set up.

Similar articles

Cited by

References

    1. Maris JM. Recent advances in neuroblastoma. N. Engl. J. Med. 2010;362:2202–2211. doi: 10.1056/NEJMra0804577. - DOI - PMC - PubMed
    1. Ohira M, Nakagawara A. Global genomic and RNA profiles for novel risk stratification of neuroblastoma. Cancer Sci. 2010;101:2295–2301. doi: 10.1111/j.1349-7006.2010.01681.x. - DOI - PMC - PubMed
    1. London WB, et al. Historical time to disease progression and progression-free survival in patients with recurrent/refractory neuroblastoma treated in the modern era on Children's Oncology Group early-phase trials. Cancer. 2017;123:4914–4923. doi: 10.1002/cncr.30934. - DOI - PMC - PubMed
    1. Moreno L, et al. Outcome of children with relapsed or refractory neuroblastoma: A meta-analysis of ITCC/SIOPEN European phase II clinical trials. Pediatr. Blood Cancer. 2017;64:25–31. doi: 10.1002/pbc.26192. - DOI - PubMed
    1. London WB, et al. Clinical and biologic features predictive of survival after relapse of neuroblastoma: A report from the International Neuroblastoma Risk Group project. J. Clin. Oncol. 2011;29:3286–3292. doi: 10.1200/JCO.2010.34.3392. - DOI - PMC - PubMed

Publication types

MeSH terms