. 2021 May 10;11(1):9854.
doi: 10.1038/s41598-021-87993-3.

Phenylethynylbenzyl-modified biguanides inhibit pancreatic cancer tumor growth

Affiliations

Phenylethynylbenzyl-modified biguanides inhibit pancreatic cancer tumor growth

Audrey Hébert et al. Sci Rep. .

Abstract

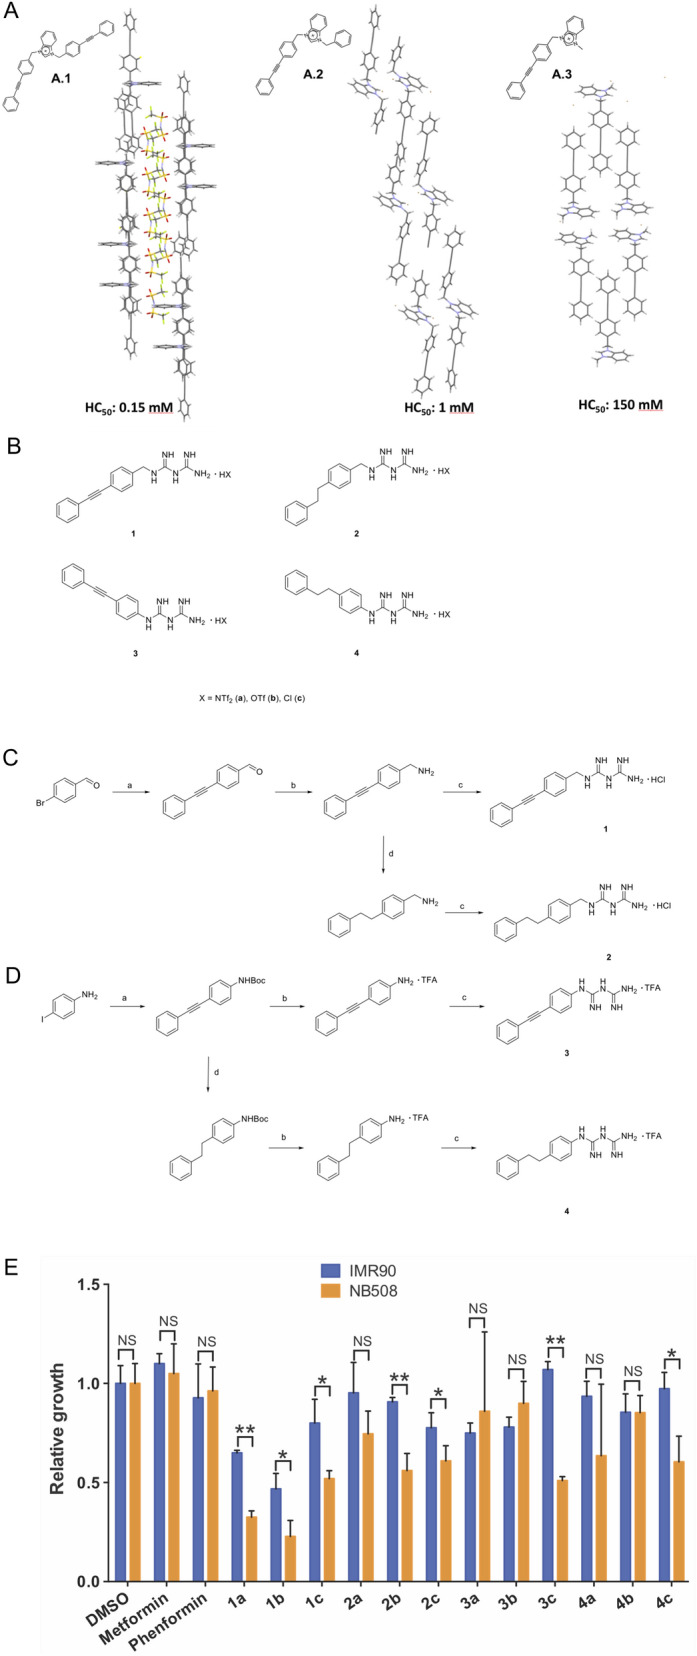
We present the design and synthesis of a small library of substituted biguanidium salts and their capacity to inhibit the growth of pancreatic cancer cells. We first present their in vitro and membrane activity, before we address their mechanism of action in living cells and in vivo activity. We show that phenylethynyl biguanidium salts possess higher ability to cross hydrophobic barriers, improve mitochondrial accumulation and anticancer activity. Mechanistically, the most active compound, 1b, like metformin, activated AMPK, decreased the NAD+/NADH ratio and mitochondrial respiration, but at 800-fold lower concentration. In vivo studies show that compound 1b significantly inhibits the growth of pancreatic cancer xenografts in mice, while biguanides currently in clinical trials had little activity.


Conflict of interest statement

The authors declare no competing interests.

Figures

Figure 1
Figure 1
(A) Structure and crystal packing of previously studied PEB-disubstituted (A.1) and monosubstituted (A.2 and A.3) benzimidazolium salts. Compound A.1 is an efficient chloride transporter forming channels and generating holes in bacterial membranes and red blood cellular membranes. Compound A.2 penetrates phospholipid membranes but is less efficient as ion transporter as it forms more compact aggregates; its toxicity on RBC is lower than compound A.1. The replacement of the phenyl group with a methyl group in compound A.3 results in the formation of even more compact aggregates with even lower toxicity on RBC. (B) Structure of PEB-substituted biguanidium salts. For each biguanide we prepared three series of biguanidium salts with different counterions. (C) Synthesis of 4-(phenylethynyl)benzylbiguanide 1 and 4-(phenylethyl)benzylbiguanide 2; (a) Phenylacetylene, PdCl2PPh3, CuI, PPh3, Et3N, THF, 70 °C, o.n. (b) NaCN(BH3)3, EtOHNH4OAc sat./NH3, 80 °C, o.n (c) Dicyandiamide, TMSCl, THFanh., 145 °C, 1 h (d) Pd/C 10%, H2, EtOH/AcOEt, 60 °C, 2 h. (D) Synthesis of 4-(phenylethynylphenyl)biguanidium 3 and 4-(phenylethylphenyl)biguanidium 4 (a) (1) Boc2O, THF, 2 h, (2) Phenylacetylene, PdCl2PPh3, CuI, PPH3, Et3N, THF, 70°, o.n. (b) TFA, DCM, 60 °C, 2 h (c) Dicyandiamide, TMSCl, THFanh, 145 °C, 1 h (d) Pd/C 10%, H2, EtOH/AcOEt, 60 °C, 2 h. The NMR spectra of the synthesized compounds are given in Supplementary Figs. S1–S24. (E) Relative growth of NB508 mouse pancreatic ductal adenocarcinoma cells and IMR90 fibroblasts exposed to 5 µM of PEB-biguanidium salts. Cells were incubated for 72 h at 37 °C. Errors bars represent the standard error of the mean (SEM), *p < 0.05, **p < 0.01, Student’s t test. (F) Crystal structure of 1b showing its self-assembly in the solid state. Crystal data is available in Supplementary Tables S1–S8 and crystal packing in Supplementary Fig. S25.
Figure 2
Figure 2
(A) Partition of compounds in an U-tube experiment. Concentration of biguanide on the trans-side of the U-tube at 48 h and 72 h at 25 °C, after addition of 250 µM of biguanide on the cis-side. (B) Variation in the internal pH of HPTS-containing EYPC liposomes. Intravesicular solution: 1 mM HPTS, 10 mM HEPES, and 100 mM NaCl, adjusted to pH = 7.4, and extravesicular solution: 10 mM HEPES and 100 mM NaCl, adjusted to pH = 7.4. Biguanidiums were injected after 50 s at 5 mM (50 mol% relative to the 10 mM EYPC concentration), a NaOH pulse was induced at 300 s, and the liposomes were lysed with Triton-X at 550 s. Each curve is the average of three independent measurements. (C) Fluorescence of safranin O in the EYPC liposomes. Biguanidium salts were injected at 5 mM (50 mol% relative to the 10 mM EYPC concentration) at 50 s. Each curve is the average of three independent measurements. (D) Mitochondrial penetration of compound 1b and metformin. Mitochondrial isolation was performed according to the previously reported protocol. For each experiment, an anti-HA IP was performed on KP4 cells expressing pMXs-3XHA-EGFP-OMP25 that were treated for 3 h with 15 μM metformin, 15 μM compound 1b or vehicle. This shows mitochondrial penetration and accumulation of the drugs at 15 μM concentration after 3 h. As positive controls were used methanol solutions of metformin and 1b at 15 μM, as negative control methanol and untreated mitochondria as vehicle.
Figure 3
Figure 3
Effects of biguanides on cell proliferation and viability in pancreatic cancer cells. (A) IC50 of metformin, phenformin and compound 1b performed in vitro over 3 days on KP4 cells. (B) IC50 of metformin, phenformin and compound 1b performed in vitro over 3 days on Panc1 cells. (C) Effect of 24 h treatment with metformin (1 mM) or compound 1b (5 µM) on the formation of tumor spheres in AH375 cells grown in suspension (mouse pancreatic ductal adenocarcinoma). ****p ≤ 0.0001 (ANOVA). (D,E) Proportion of living and dead cells after 24 h treatment, with either metformin (5 mM), Phenformin (50 µM), compound 1b (15 µM) or vehicle in KP4 cells **** p ≤ 0.0001 (ANOVA) (D) and HPNE-hTERT cells (E). (F) Effect of treatment for 6 h of PSN1 cells with metformin (10 mM), phenformin (100 µM) or compound 1b (25 µM) on NAD+/NADH ratio. **p ≤ 0.01, ****p ≤ 0.0001 (ANOVA). (G) Effect of treatment for 18 h of KP4 cells with metformin (5 mM), phenformin (50 µM) or compound 1b (15 µM) on NAD + /NADH ratio. **p ≤ 0.01, ***p ≤ 0.001 (ANOVA). (H) Effect of treatment for 24 h of KP4 cells with metformin (5 mM), phenformin (50 µM) or compound 1b (15 µM) on phosphorylation levels of AMPK T172 and ACC S79. (I) Effect of treatment of KP4 cells with metformin (10 mM) or compound 1b (15 µM) on oxygen consumption rate (OCR) measured by Seahorse analysis. (J) Effect of treatment of KP4 cells with metformin (10 mM) or compound 1b (15 µM) on ECAR (extracellular acidification rate) measured by Seahorse analysis.
Figure 4
Figure 4
Effects of biguanides on mitochondrial morphology. (A) Mitochondrial morphology in KP4 cells 24 h following the indicated treatments as visualised by anti-TOMM20 immunofluorescence. Scale bar = 10 µM. (B) Quantification of the percentage of cells exhibiting filamentous, fragmented or punctuated mitochondria following indicated treatments. The data represents the mean of 2 biological replicates and for each replicate three counts of 50 cells were done. n = 300 cells per treatment. Data was analyzed with one way ANOVA followed by Tukey HSD test.
Figure 5
Figure 5
Progression of the volume of KP4 cells sub-cutaneous xenografts performed in nude mice over 37 days. (A) Treatments with phenformin or compound 1b (both at 50 mg/kg/day, 5 days a week) or vehicle were started 11 days post engraftment. **p ≤ 0.01, NS: not significative (ANOVA). (B) Body weight of mice seven days after treatment. NS: not significative (ANOVA) (C) Scale of staining intensity calculated with the immunoreactivity scoring method for KI67 (top) and cleaved caspase 3 (bottom) staining. Representative images shown. Scale bar = 100 µm. (D,F) Analysis of KI67 (D) and cleaved caspase 3 (F) staining on tumor sections from mice treated with vehicle, phenformin or 1b (both at 50 mg/kg). n = 3. Results are shown in graphics comparing the percentage of cells stained in each category and the intensity of staining. (E,G) Images of the most representative phenotypes for KI67 staining (E) and cleaved caspase 3 (G).

References

    1. Barone BB, et al. Long-term all-cause mortality in cancer patients with preexisting diabetes mellitus: A systematic review and meta-analysis. JAMA. 2008;300:2754–2764. doi: 10.1001/jama.2008.824. - DOI - PMC - PubMed
    1. Giovannucci E, et al. Diabetes and cancer: A consensus report. CA Cancer J. Clin. 2010;60:207–221. doi: 10.3322/caac.20078. - DOI - PubMed
    1. Ben Sahra I, Le Marchand-Brustel Y, Tanti JF, Bost F. Metformin in cancer therapy: A new perspective for an old antidiabetic drug? Mol. Cancer Ther. 2010;9:1092–1099. doi: 10.1158/1535-7163.MCT-09-1186. - DOI - PubMed
    1. Kordes S, et al. Metformin in patients with advanced pancreatic cancer: A double-blind, randomised, placebo-controlled phase 2 trial. Lancet Oncol. 2015;16:839–847. doi: 10.1016/s1470-2045(15)00027-3. - DOI - PubMed
    1. Coyle C, Cafferty FH, Vale C, Langley RE. Metformin as an adjuvant treatment for cancer: A systematic review and meta-analysis. Ann. Oncol. 2016;27:2184–2195. doi: 10.1093/annonc/mdw410. - DOI - PMC - PubMed

Publication types

MeSH terms

Grants and funding