. 2021 May 10;11(1):9864.
doi: 10.1038/s41598-021-89116-4.

Influence of survival, promotion, and growth on pattern formation in zebrafish skin

Affiliations

Influence of survival, promotion, and growth on pattern formation in zebrafish skin

Christopher Konow et al. Sci Rep. .

Abstract

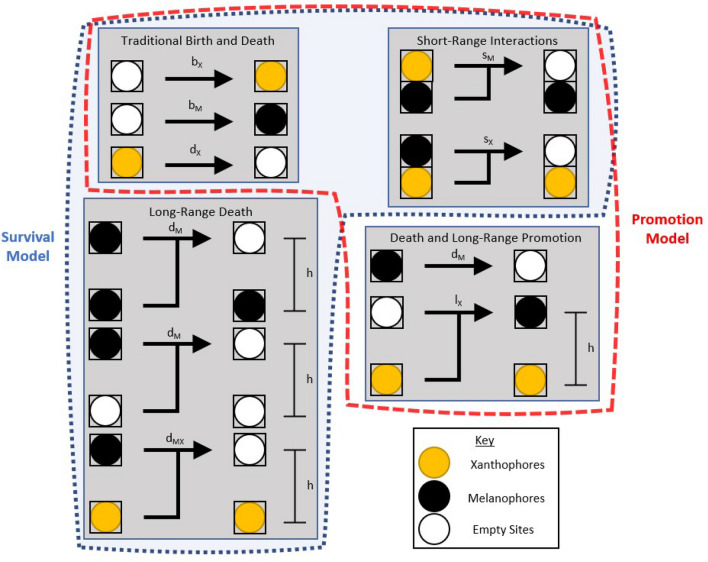
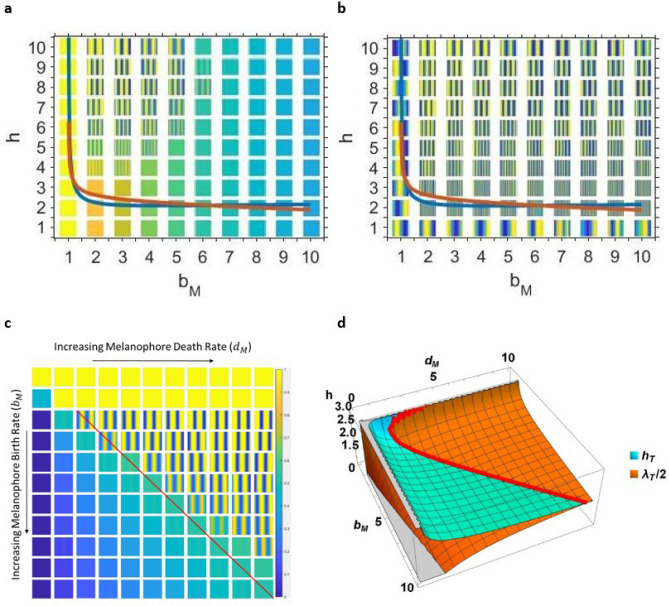
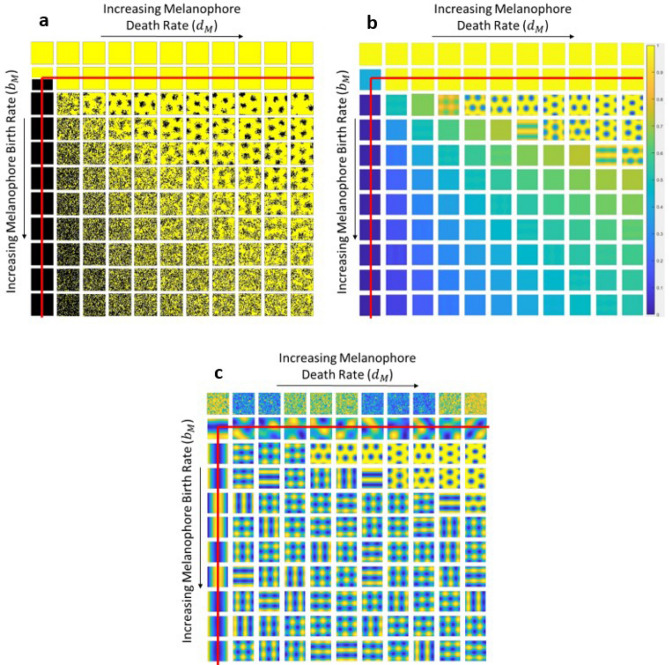
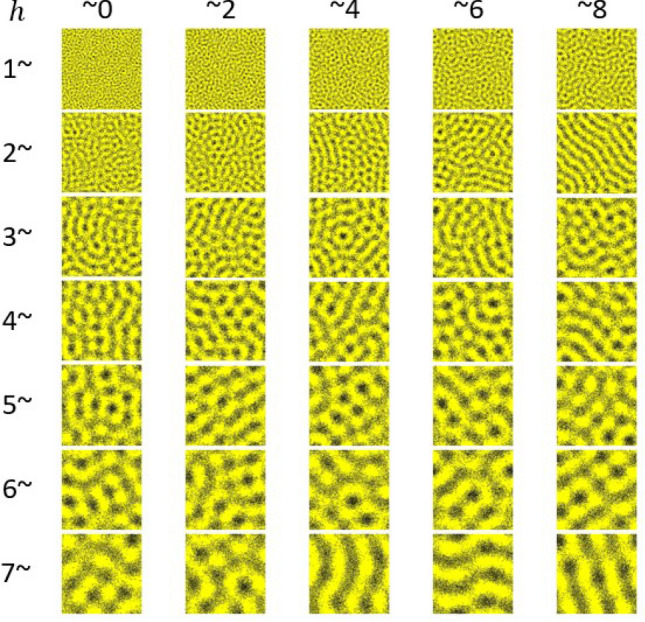
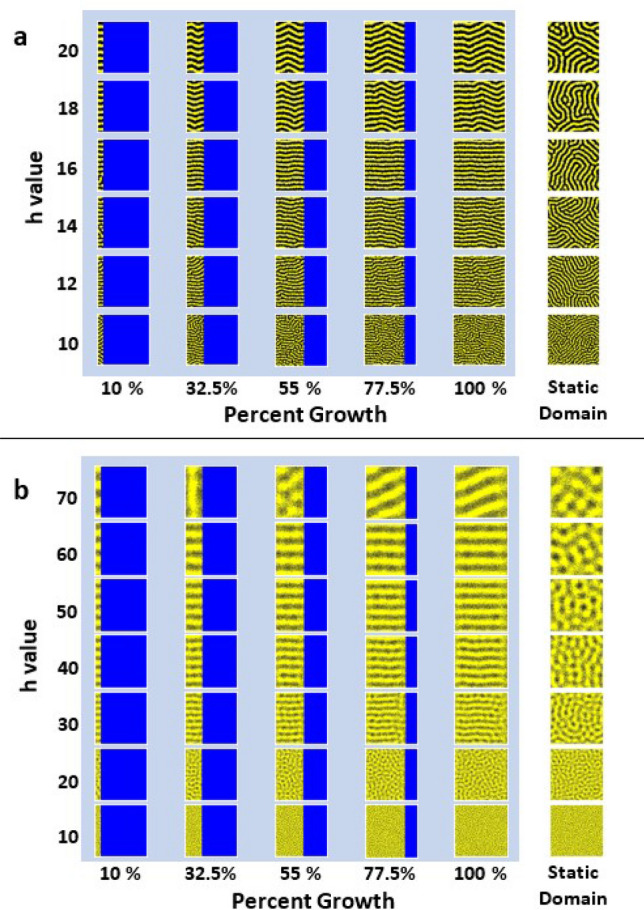
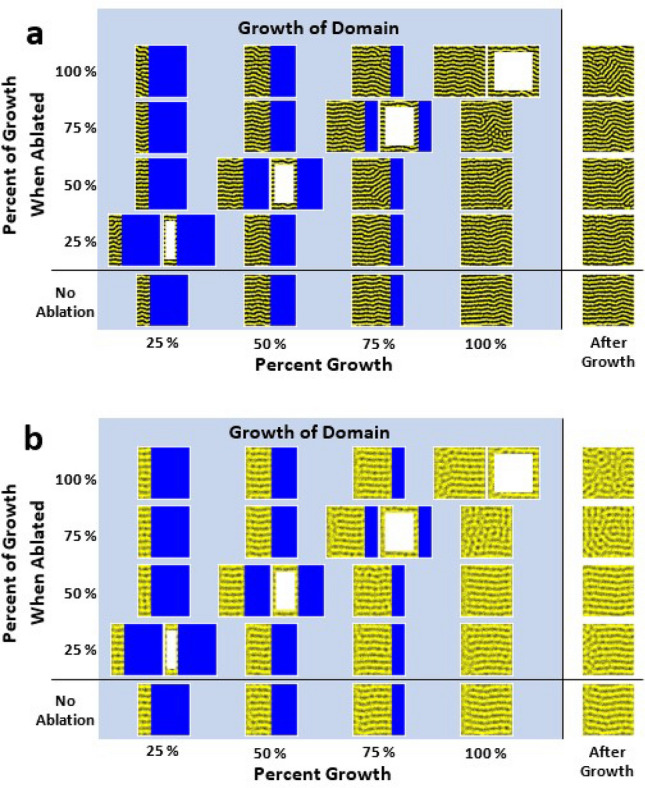
The coloring of zebrafish skin is often used as a model system to study biological pattern formation. However, the small number and lack of movement of chromatophores defies traditional Turing-type pattern generating mechanisms. Recent models invoke discrete short-range competition and long-range promotion between different pigment cells as an alternative to a reaction-diffusion scheme. In this work, we propose a lattice-based "Survival model," which is inspired by recent experimental findings on the nature of long-range chromatophore interactions. The Survival model produces stationary patterns with diffuse stripes and undergoes a Turing instability. We also examine the effect that domain growth, ubiquitous in biological systems, has on the patterns in both the Survival model and an earlier "Promotion" model. In both cases, domain growth alone is capable of orienting Turing patterns above a threshold wavelength and can reorient the stripes in ablated cells, though the wavelength for which the patterns orient is much larger for the Survival model. While the Survival model is a simplified representation of the multifaceted interactions between pigment cells, it reveals complex organizational behavior and may help to guide future studies.


Conflict of interest statement

The authors declare no competing interests.

Figures

Figure 1
Figure 1
Schematic depicting the interactions of chromatophores in both the Promotion model and the Survival model of zebrafish skin pattern formation. The blue outline shows the Survival model, and the red outline shows the Promotion model.
Figure 2
Figure 2
Numerical simulations and results of LSA of the Survival model in one dimension. For each numerical simulation, Eqs. (1) and (2) were simulated on a size n=50 lattice with periodic boundaries. The xanthophore concentration (Xi) is shown. The results were extended vertically into a square shape for ease of viewing. The following conditions were held constant in all simulations and when performing the LSA: bX=s=1, dX=dMX=0. (a) and (b) Simulations of the Survival model for various long-range interaction distances h and melanophore birth rates bM. The death rate of melanophores was held constant at dM=4. The blue curve is a plot of the minimum long-range interaction distance hT that allows for Turing patterns, and the orange curve is one-half of the critical wavelength (λT/2). The simulations in (a) and (b) are identical, but (a) is absolutely scaled between a normalized concentration of zero and one, while (b) is relatively scaled between the minimum and maximum values of Xi for that simulation. (c) Simulations of the Survival model for various bM and dM parameter combinations. For all simulations, the long-range interaction distance was held constant at h=15. The red line approximately indicates the onset of patterning at hT=λT/2. (d) Analytical result of LSA of the continuous mean field Eqs. (3)–(4). The cyan surface is a plot of the bifurcation value hT, the critical long-range interaction distance. The orange surface is a plot of half the critical wavelength, λT/2. The red curve shows the intersection of the two surfaces, where hT=λT/2.
Figure 3
Figure 3
Numerical simulations of the Survival model on a two-dimensional 50×50 lattice with periodic boundary conditions. In all figures, bM and dM were varied from 0 to 10 (top to bottom and left to right, respectively). The following parameters were held constant: h=15, bX=s=1, dX=dMX=0. The red lines indicate the area where Turing patterns are predicted by the LSA. (a) Stochastic Monte Carlo simulations. Each simulation began on a uniform initial condition corresponding to an empty lattice. Yellow, black, and white lattice sites represent xanthophores, melanophores, and empty sites respectively. (b) and (c) Numerical integration of the two dimensional mean field equations describing the Survival model. Each simulation started from random initial conditions and ran for 1000 time steps. (b) shows the normalized concentration of xanthophores (Xi,j) scaled absolutely between zero and one. (c) shows the same simulations scaled relative to each simulation’s maximum and minimum.
Figure 4
Figure 4
Stationary Turing patterns with varying h values in Monte Carlo simulations of the Survival model. Each simulation was performed on a 400×400 static lattice with periodic boundary conditions. The following parameters were held constant: bM=7, dM=9, bX=s=1, dX=dMX=0. For each pattern shown, the first digit of the h value is given by the row label and the second digit is given by the column label. For example, the Turing pattern in the fifth row and third column has h=54.
Figure 5
Figure 5
Turing pattern development during domain growth. For each h value, two simulations are presented: one on a growing domain (light blue backing) and one on a static domain (right column). For each simulation on a growing domain, images are shown of the developing pattern at 10%, 32.5%, 55%, 77.5%, and 100% of growth. The royal blue areas are the remaining area each simulation will grow into. All simulations are performed with periodic boundary conditions for the same simulation length. (a) Stochastic Monte Carlo simulations of the Promotion model on a growing domain. Each simulation begins as a 300×1 lattice, and grows to a final size of 300×300. Each simulation is performed with bX=1,s=1,lX=2.5,bM=dX=dM=0. (b) Stochastic Monte Carlo simulations of the Survival model on a growing domain. Each simulation begins as a 400×1 lattice, and grows to a final size of 400×400. Each simulation is performed with bX=1,s=1,bM=7,dM=9,dX=dMX=0.
Figure 6
Figure 6
Ablation of Turing patterns at different percentages of growth. Simulations with the same conditions (one per row) were ablated at 25%, 50%, 75%, 100% of their total growth. The middle 75% of the domain was ablated (right side of each dual image—left side is simulation directly before ablation). Once the growth was complete, the simulations continued to run for 17% of the time of growth to observe the stability of the final pattern (far right of each simulation). (a) Growth simulations of the Promotion model with ablation. The domain grows from a 300×1 cell lattice to a 300×300 cell lattice. The conditions of each simulation (rows) are: h=14,bX=1,s=1,lX=2.5,bM=dM=dX=0. (b) Growth simulations of the Survival model with ablation. The domain grows from a 400×1 cell lattice to a 400×400 cell lattice. The conditions of each simulation (rows) are: h=30,bX=1,s=1,bM=7,dM=9,dX=dMX=0.

References

    1. Turing AM. The chemical basis of morphogenesis. Philos. Trans. R. Soc. B Biol. Sci. 1952;237:37–72.
    1. Green JB, Sharpe J. Positional information and reaction–diffusion: two big ideas in developmental biology combine. Development. 2015;142:1203–1211. doi: 10.1242/dev.114991. - DOI - PubMed
    1. Gierer A, Meinhardt H. A theory of biological pattern formation. Kybernetik. 1972;12:30–39. doi: 10.1007/BF00289234. - DOI - PubMed
    1. Meinhardt H, Gierer A. Pattern formation by local self-activation and lateral inhibition. BioEssays. 2000;22:753–760. doi: 10.1002/1521-1878(200008)22:8<753::AID-BIES9>3.0.CO;2-Z. - DOI - PubMed
    1. Meinhardt H. Turing’s theory of morphogenesis of 1952 and the subsequent discovery of the crucial role of local self enhancement and long-range inhibition. Interface Focus. 2012;2:407–416. doi: 10.1098/rsfs.2011.0097. - DOI - PMC - PubMed

Publication types

LinkOut - more resources