

Impact of histological response after neoadjuvant therapy on podocalyxin as a prognostic marker in pancreatic cancer
- PMID: 33972616
- PMCID: PMC8110523
- DOI: 10.1038/s41598-021-89134-2
Impact of histological response after neoadjuvant therapy on podocalyxin as a prognostic marker in pancreatic cancer
Abstract
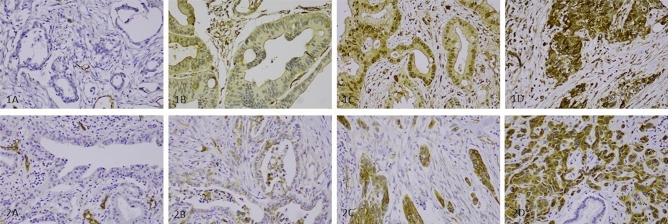
Podocalyxin overexpression associates with poor survival in pancreatic cancer (PDAC). We investigated whether podocalyxin expression correlates with treatment response or survival in neoadjuvant-treated PDAC. Through immunohistochemistry, we evaluated podocalyxin expression in 88 neoadjuvant and 143 upfront surgery patients using two antibodies. We developed a six-tier grading scheme for neoadjuvant responses evaluating the remaining tumor cells in surgical specimens. Strong podocalyxin immunopositivity associated with poor survival in the patients responding poorly to the neoadjuvant treatment (HR 4.16, 95% CI 1.56-11.01, p = 0.004), although neoadjuvant patients exhibited generally low podocalyxin expression (p = 0.017). Strong podocalyxin expression associated with perineural invasion (p = 0.003) and lack of radiation (p = 0.036). Two patients exhibited a complete neoadjuvant response, while a strong neoadjuvant response (≤ 5% of residual tumor cells) significantly associated with lower stage, pT-class and grade, less spread to the regional lymph nodes, less perineural invasion, and podocalyxin negativity (p < 0.05, respectively). A strong response predicted better survival (HR 0.28, 95% CI 0.09-0.94, p = 0.039). In conclusion, strong podocalyxin expression associates with poor survival among poorly responding neoadjuvant patients. A good response associates with podocalyxin negativity. A strong response associates with better outcome.
Conflict of interest statement
The authors declare no competing interests.
Figures


Similar articles
-
Podocalyxin Is a Marker of Poor Prognosis in Pancreatic Ductal Adenocarcinoma.PLoS One. 2015 Jun 8;10(6):e0129012. doi: 10.1371/journal.pone.0129012. eCollection 2015. PLoS One. 2015. PMID: 26053486 Free PMC article.
-
Survival Outcomes Associated With Clinical and Pathological Response Following Neoadjuvant FOLFIRINOX or Gemcitabine/Nab-Paclitaxel Chemotherapy in Resected Pancreatic Cancer.Ann Surg. 2019 Sep;270(3):400-413. doi: 10.1097/SLA.0000000000003468. Ann Surg. 2019. PMID: 31283563 Free PMC article.
-
Vascular resection during pancreatectomy for pancreatic head cancer: A technical issue or a prognostic sign?Surgery. 2021 Feb;169(2):403-410. doi: 10.1016/j.surg.2020.08.002. Epub 2020 Sep 8. Surgery. 2021. PMID: 32912782
-
Different clinical presentations of metachronous pulmonary metastases after resection of pancreatic ductal adenocarcinoma: Retrospective study and review of the literature.World J Gastroenterol. 2017 Sep 21;23(35):6420-6428. doi: 10.3748/wjg.v23.i35.6420. World J Gastroenterol. 2017. PMID: 29085191 Free PMC article. Review.
-
Update on the management of pancreatic cancer: surgery is not enough.World J Gastroenterol. 2015 Mar 21;21(11):3157-65. doi: 10.3748/wjg.v21.i11.3157. World J Gastroenterol. 2015. PMID: 25805920 Free PMC article. Review.
Cited by
-
Immunohistochemical Evaluation of Candidate Biomarkers for Fluorescence-Guided Surgery of Myxofibrosarcoma Using an Objective Scoring Method.Biomedicines. 2023 Mar 22;11(3):982. doi: 10.3390/biomedicines11030982. Biomedicines. 2023. PMID: 36979961 Free PMC article.
-
The prognostic significance of MMP-8 tissue Immunoexpression in pancreatic ductal adenocarcinoma after neoadjuvant therapy.Sci Rep. 2025 Jul 9;15(1):24719. doi: 10.1038/s41598-025-10538-5. Sci Rep. 2025. PMID: 40634459 Free PMC article.
-
A Current Synopsis of the Emerging Role of Extracellular Vesicles and Micro-RNAs in Pancreatic Cancer: A Forward-Looking Plan for Diagnosis and Treatment.Int J Mol Sci. 2024 Mar 17;25(6):3406. doi: 10.3390/ijms25063406. Int J Mol Sci. 2024. PMID: 38542378 Free PMC article. Review.
References
-
- Cancer statistics - Syöpärekisteri. https://cancerregistry.fi/statistics/cancer-statistics/.
-
- Landry J, et al. Randomized phase II study of gemcitabine plus radiotherapy versus gemcitabine, 5-fluorouracil, and cisplatin followed by radiotherapy and 5-fluorouracil for patients with locally advanced, potentially resectable pancreatic adenocarcinoma. J. Surg. Oncol. 2010;101:587–592. doi: 10.1002/jso.21527. - DOI - PMC - PubMed
Publication types
MeSH terms
Substances
LinkOut - more resources
Full Text Sources
Other Literature Sources
Medical
