. 2021 May 10;11(1):9892.
doi: 10.1038/s41598-021-89326-w.

Endoplasmic reticulum stress regulates the intestinal stem cell state through CtBP2

Affiliations

Endoplasmic reticulum stress regulates the intestinal stem cell state through CtBP2

Bartolomeus J Meijer et al. Sci Rep. .

Abstract

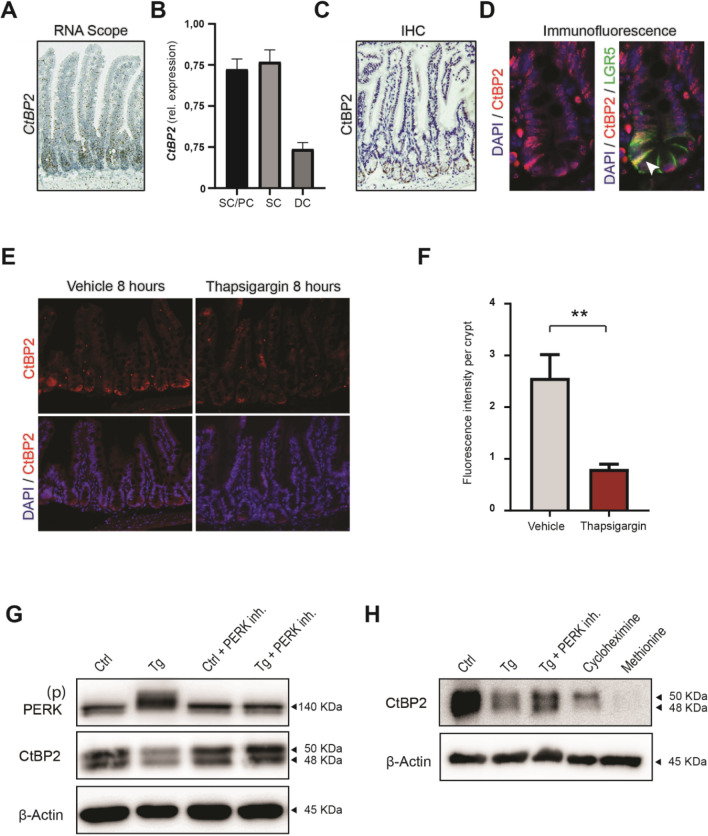
Enforcing differentiation of cancer stem cells is considered as a potential strategy to sensitize colorectal cancer cells to irradiation and chemotherapy. Activation of the unfolded protein response, due to endoplasmic reticulum (ER) stress, causes rapid stem cell differentiation in normal intestinal and colon cancer cells. We previously found that stem cell differentiation was mediated by a Protein kinase R-like ER kinase (PERK) dependent arrest of mRNA translation, resulting in rapid protein depletion of WNT-dependent transcription factor c-MYC. We hypothesize that ER stress dependent stem cell differentiation may rely on the depletion of additional transcriptional regulators with a short protein half-life that are rapidly depleted due to a PERK-dependent translational pause. Using a novel screening method, we identify novel transcription factors that regulate the intestinal stem cell fate upon ER stress. ER stress was induced in LS174T cells with thapsigargin or subtilase cytotoxin (SubAB) and immediate alterations in nuclear transcription factor activity were assessed by the CatTFRE assay in which transcription factors present in nuclear lysate are bound to plasmid DNA, co-extracted and quantified using mass-spectrometry. The role of altered activity of transcription factor CtBP2 was further examined by modification of its expression levels using CAG-rtTA3-CtBP2 overexpression in small intestinal organoids, shCtBP2 knockdown in LS174T cells, and familial adenomatous polyposis patient-derived organoids. CtBP2 overexpression organoids were challenged by ER stress and ionizing irradiation. We identified a unique set of transcription factors with altered activation upon ER stress. Gene ontology analysis showed that transcription factors with diminished binding were involved in cellular differentiation processes. ER stress decreased CtBP2 protein expression in mouse small intestine. ER stress induced loss of CtBP2 expression which was rescued by inhibition of PERK signaling. CtBP2 was overexpressed in mouse and human colorectal adenomas. Inducible CtBP2 overexpression in organoids conferred higher clonogenic potential, resilience to irradiation-induced damage and a partial rescue of ER stress-induced loss of stemness. Using an unbiased proteomics approach, we identified a unique set of transcription factors for which DNA-binding activity is lost directly upon ER stress. We continued investigating the function of co-regulator CtBP2, and show that CtBP2 mediates ER stress-induced loss of stemness which supports the intestinal stem cell state in homeostatic stem cells and colorectal cancer cells.


Conflict of interest statement

The authors declare no competing interests.

Figures

Figure 1
Figure 1
ER stress induced loss of stemness is characterized by altered activity of a set of transcription factors. (A) Heatmap based on average Z-scores of performed CatTFRE assay on human LS147T cells treated for 2 h with DMSO (n = 3) thapsigargin (n = 3) or SubAB (n = 2). Upper selection contains transcription factors with most downregulated binding to DNA template. (B) DAVID gene ontology (GO) analysis on top 100 most downregulated transcription factors, presented in the heatmap. (C) Protein analysis by western blot of the heatmap selected transcription factors, in LS174T cells, 24 h after thapsigargin treatment. Full-length blots/gels are presented in Supplementary Immunoblotting Data Figure 1. All western blot images were generated and exported using ImageQuant LAS 4000 software and cropped and labeled using Adobe Illustrator software version 25.2.
Figure 2
Figure 2
CtBP2 is predominantly localized in the small intestinal epithelial crypt and is involved in ER stress induced differentiation. (A) Representative images of mouse small intestinal RNA scope in situ hybridization for Ctbp2 mRNA during homeostasis. (B) RT-qPCR for Ctbp2 in flow cytometry sorted epithelial cells, derived from mouse small intestine. Sorted for stem/Paneth cells (SC/PC); EpcamhighCD45lowCD24high, stem cells (SC); EpcamhighCD45lowCD24med and differentiated cells (DC); EpcamhighCD45lowCD24low. (C) Immunohistochemistry for CtBP2 in small intestine (n = 4). (D) Immunofluorescence for CtBP2 (red) in small intestine of a Lgr5-EGFP-IRES-creERT2 knock-in (green) mouse with DAPI (blue) counterstain (n = 4). White arrow indicates CTBP2 positive stem cell. (E) Representative image of immunofluorescence for CtBP2 (red) in small intestine of mice treated for 8 h with DMSO vehicle or thapsigargin, with DAPI (blue) counterstain. (F) Quantification of the fluorescence intensity in the small intestine of DMSO or thapsigargin treated mice (n = 6), at least 20 crypts evaluated per mouse. (G) Representative western blot for PERK and CtBP2 in human LS174T cells treated (n = 2) with 400 nM thapsigargin for 24 h in the presence or absence of 400 nM Perk inhibitor. Full-length blots/gels are presented in Supplementary Immunoblotting Data Figure 2. (H) Representative experiment showing expression of newly synthesized CtBP2 protein by L-azidohomoalanine labeling and pulldown of labeled nascent proteins following 4 h of 400 nM thapsigargin in the presence or absence of 400 nM Perk inhibitor. Cycloheximide (100 mM) or 50:50 ratio of methionine and L-azidohomoalanine were used as negative controls for protein synthesis and specific labeling respectively (n = 3). Full-length blots/gels are presented in Supplementary Immunoblotting Data Figure 3. All immunohistochemistry images were captured with a Leica DM6000 microscope using LAS AF software (Leica, Wetzlar, Germany). All western blot images were generated and exported using ImageQuant LAS 4000 software and cropped and labeled using Adobe Illustrator software version 25.2. Graph bars show mean and s.e.m. **P < 0.01 (Student’s t-test). Ctrl control, Tg thapsigargin.
Figure 3
Figure 3
CtBP2 regulates stemness in mouse small intestinal epithelial organoids. (A) RT-qPCR of CtBP2 in wildtype or CtBP2 overexpressed mouse small intestinal organoids 48 h after doxycycline-induced CtBP2 overexpression (n = 3). (B) CtBP2 protein expression by western blot in CAG-rtTA-CtBP2 organoids, 48 h after treatment with doxycycline. Full-length blots/gels are presented in Supplementary Immunoblotting Data Figure 4. (C) Representative image of CAG-rtTA-CtBP2 mouse small intestinal organoids 48 h after doxycycline-induced overexpression. (D) Quantified ratio of cystic organoids to normal organoids 48 h after doxycycline-induced CtBP2 overexpression in (n = 3). (E) Representative images of budding in CAG-rtTA-CtBP2 mouse small intestinal organoids, 72 h upon doxycycline-induced CtBP2 overexpression. (F) Mean number of buds per organoid in CtBP2 wildtype (non-induced) versus doxycycline-induced CtBP2 overexpression organoids (n = 3). (G) RT-qPCR of stem cell markers and (H) differentiation markers in CAG-rtTA-CtBP2 mouse small intestinal organoids 72 h after doxycycline-induced CtBP2 overexpression (n = 3). (I) Representative images of outgrowth of induced CAG-rtTA-CtBP2 organoids 72 h after single cell seeding. Images were captured with a Leica DM6000 microscope using LAS AF software (Leica, Wetzlar, Germany). All western blot images were generated and exported using ImageQuant LAS 4000 software and cropped and labeled using Adobe Illustrator software version 25.2. (J) Calculated clonogenic capacity (%) of induced CAG-rtTA-CtBP2 organoids after single cell seeding. Graph bars show mean and s.e.m. *P < 0.05, **P < 0.01, ***P < 0.001, ****P < 0.0001 (Student’s t-test).
Figure 4
Figure 4
High levels of CtBP2 protect epithelial stem cells against ER stress and gamma irradiation. (A) RT-qPCR of stem cell markers in induced CAG-rtTA-CtBP2 organoids after 6 h of DMSO or thapsigargin treatment (n = 2). (B) EdU incorporation in induced CAG-rtTA-CtBP2 organoids 6 h after thapsigargin treatment (n = 3). (C) Western blot of GRP78 expression upon induction of CtBP2 overexpression. Full-length blots/gels are presented in Supplementary Immunoblotting Data Figure 5. (D) RT-qPCR of Grp78 upon induction of CtBP2 overexpression (n = 3). (E) RT-qPCR of stem cell markers induced CAG-rtTA-CtBP2 organoids during a time course following 6 Gy of irradiation (n = 3). (F) Quantification of viable organoids after 6 Gy irradiation (n = 2). (G) Representative images of the phenotype of induced CAG-rtTA-CtBP2 organoids that were irradiated 72 h ago with 6 Gy (n = 3). Images of organoids were captured with a Leica DM6000 microscope using LAS AF software (Leica, Wetzlar, Germany). All western blot images were generated and exported using ImageQuant LAS 4000 software and cropped and labeled using Adobe Illustrator software version 25.2. Graph bars show mean and s.e.m. *P < 0.05, **P < 0.01, ***P < 0.001, (Student’s t-test or one-way ANOVA).
Figure 5
Figure 5
CtBP2 is important for clonal expansion of a WNT-high cancer cell line and colon organoids derived from FAP patients. (A) RT-qPCR of Ctbp2 in small intestinal tissue of Apc homozygous mice (n = 4). (B) Immunofluorescence for CtBP2 (red) in Apc heterozygous adenoma, with DAPI (blue) counterstain. (C) RT-qPCR of CtBP2 in adenomatous tissue of a patient cohort (n = 60 per group). (D) Knockdown efficiency measured by RT-qPCR of CtBP2 in FAP patient-derived organoids carrying mutations in APC with and without additional mutations in KRAS. (E) Representative images showing outgrowth of FAP patient-derived organoids transduced with shCtBP2, 72 h after single cell seeding. (F) Clonogenic capacity of two FAP patient-derived organoids after knockdown of CtBP2 (n = 2). (G) Representative image of crystal violet staining on LS174T cells 5 days after lentiviral transduction with shCtrl or shCtBP2. (H) WNT-associated proteins analyzed by western blot in LS174T cells transduced with shCtrl or shCtBP2. Full-length blots/gels are presented in Supplementary Immunoblotting Data Figure 6. (I) Representative image of migration scratch assay on LS174T cells 5 days after lentiviral transduction with shCtrl or shCtBP2, analyzed immediately after and 16 h after the scratch injury. (J) Quantification of covered area of migrating cells 16 h after the scratch injury (n = 3). Images of organoids were captured with a Leica DM6000 microscope using LAS AF software (Leica, Wetzlar, Germany). All western blot images were generated and exported using ImageQuant LAS 4000 software and cropped and labeled using Adobe Illustrator software version 25.2. Graph bars show mean and s.e.m. *P < 0.05, **P < 0.01, ***P < 0.001, ****P < 0.0001 (Student’s t-test or one-way ANOVA).

Similar articles

Cited by

References

    1. Clevers H. The intestinal crypt, a prototype stem cell compartment. Cell. 2013;154(2):274–284. doi: 10.1016/j.cell.2013.07.004. - DOI - PubMed
    1. Snippert HJ, et al. Intestinal crypt homeostasis results from neutral competition between symmetrically dividing Lgr5 stem cells. Cell. 2010;143(1):134–144. doi: 10.1016/j.cell.2010.09.016. - DOI - PubMed
    1. Korinek V, et al. Depletion of epithelial stem-cell compartments in the small intestine of mice lacking Tcf-4. Nat. Genet. 1998;19:5. doi: 10.1038/1270. - DOI - PubMed
    1. Wetering M, et al. The beta-catenin/TCF-4 complex imposes a crypt progenitor phenotype on colorectal cancer cells. Cell. 2002;111:9. doi: 10.1016/S0092-8674(02)01009-7. - DOI - PubMed
    1. Kinzler KW, Vogelstein B. Lessons from hereditary colorectal cancer. Cell. 1996;87:159–170. doi: 10.1016/S0092-8674(00)81333-1. - DOI - PubMed

Publication types

MeSH terms