. 2021 May 10;11(1):9906.
doi: 10.1038/s41598-021-89375-1.

Magneto-optical borogermanate glasses and fibers containing Tb3

Affiliations

Magneto-optical borogermanate glasses and fibers containing Tb3

Douglas F Franco et al. Sci Rep. .

Abstract

New glass compositions containing high concentrations of Tb3+ ions were developed aiming at the production of magneto-optical (MO) fibers. This work reports on the structural and MO properties of a new glass composition based on (100 - x)(41GeO2-25B2O3-4Al2O3-10Na2O-20BaO) - xTb4O7. Morphological analysis (HR-TEM) of the sample with the highest concentration of Tb3+ ions confirmed the homogeneous distribution of Tb3+ ions and the absence of nanoclusters. All the samples presented excellent thermal stability against crystallization (ΔT > 100 °C). An optical fiber was manufactured by a fiber drawing process. The UV-Vis spectra of the glasses showed Tb3+ electronic transitions and optical windows varying from 0.4 to 1.6 μm. The magneto-optical properties and the paramagnetic behaviors of the glasses were investigated using Faraday rotation experiments. The Verdet constant (VB) values were calculated at 500, 650, 880, 1050, 1330, and 1550 nm. The maximum VB values obtained at 650 and 1550 nm for the glass with x = 18 mol% were -128 and - 17.6 rad T-1 m-1, respectively. The VB values at 500 and 1550 nm for the optical fiber containing 8 mol% of Tb4O7 were - 110.2 and - 9.5 rad T-1 m-1, respectively, while the optical loss at around 880 nm was 6.4 dB m-1.


Conflict of interest statement

The authors declare no competing interests.

Figures

Figure 1
Figure 1
Photograph of BGB-xTb glasses with different Tb4O7 contents.
Figure 2
Figure 2
(a) DSC curves, (b) Tg and ΔT, and (c) optical basicity, as a function of Tb4O7 concentration. The lines in (b) and (c) are just guides for the eyes.
Figure 3
Figure 3
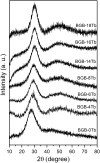
XRD patterns for the BGB-xTb glasses.
Figure 4
Figure 4
(A) HRTEM micrograph of BGB-18Tb [the inset shows the fast Fourier transform (FFT)]. (B) HAADF mode (Z-contrast) image of the analyzed area (1) and elemental EDS mapping for Ba-K (2), Tb-L (3), and O-K (4).
Figure 5
Figure 5
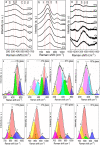
Normalized Raman spectra for the BGB-xTb glasses in (a) low (~ 130–650 cm−1), (b) medium (~ 650–1050 cm−1), and (c) high (1050–1700 cm−1) frequency regions. Deconvolution of the Raman spectra for the 0, 4, 8, and 18 Tb glasses in the low (dg), medium (hk), and high (lo) frequency regions.
Figure 5
Figure 5
Normalized Raman spectra for the BGB-xTb glasses in (a) low (~ 130–650 cm−1), (b) medium (~ 650–1050 cm−1), and (c) high (1050–1700 cm−1) frequency regions. Deconvolution of the Raman spectra for the 0, 4, 8, and 18 Tb glasses in the low (dg), medium (hk), and high (lo) frequency regions.
Figure 6
Figure 6
(a) UV–Vis–NIR optical absorption, (b) transmission spectra, (c) refractive indices as a function of Tb4O7 content, at different wavelengths, and (d) refractive indices for BGB-xTb glasses (0 ≤ x ≤ 18), as a function of wavelength.
Figure 7
Figure 7
(a) PLE spectrum of the BGB-4Tb glass and (b) PL spectra of the BGB-xTb glasses at room temperature. Inset photograph: BGB-4Tb sample under excitation at 375 nm. Inset: PL spectra of the BGB-xTb glasses (x = 14, 16, and 18 mol% Tb4O7) in the region from 530 to 560 nm.
Figure 8
Figure 8
(a) Photographs of the BGB-xTb glasses and the magnetic attraction of the BGB-18Tb glass using a commercial neodymium magnet. Plots of VB as a function of (b) Tb4O7 content (mol%), (c) Tb3+ ions density (g cm−3), and (d) wavelength.
Figure 9
Figure 9
(a) Glass preform, (b) MO fiber based on the BGB-8Tb composition, (c) SEM cross-section image of the BGB-8Tb fiber, (d) glass preform after the drawing process, and (e) optical microscopy image of the surface of the fiber.
Figure 10
Figure 10
(a) Variation of the Verdet constant as a function of wavelength and (b) attenuation spectrum of the BGB-8Tb fiber determined using the cut-back method, with a final length of 0.21 cm.

References

    1. Gao G, et al. Faraday rotation and photoluminescence in heavily Tb3+-doped GeO2–B2O3–Al2O3–Ga2O3 glasses for fiber-integrated magneto-optics. Sci. Rep. 2015;5:1–6. doi: 10.1038/srep08942. - DOI - PMC - PubMed
    1. Qiu X, Wu B, Liu Y, Wen F. Study on mode coupling characteristics of multimode magneto-optical fibers. Opt. Commun. 2020;456:124707. doi: 10.1016/j.optcom.2019.124707. - DOI
    1. Valeanu M, et al. The relationship between magnetism and magneto-optical effects in rare earth doped aluminophosphate glasses. J. Phys. D Appl. Phys. 2016;49(7):075001. doi: 10.1088/0022-3727/49/7/075001. - DOI
    1. Kruk A, et al. Transparent yttrium oxide ceramics as potential optical isolator materials. Opt. Appl. 2015;45(4):585–594. doi: 10.5277/oa150413. - DOI
    1. Chen Q, Wang H, Chen Q. Structural and properties of heavy metal oxide Faraday glass for optical current transducer. J. Non-Cryst. Solids. 2015;429:13–19. doi: 10.1016/j.jnoncrysol.2015.08.031. - DOI

LinkOut - more resources