. 2021 Jun;53(6):881-894.
doi: 10.1038/s41588-021-00859-2. Epub 2021 May 10.

Reprogramming of the esophageal squamous carcinoma epigenome by SOX2 promotes ADAR1 dependence

Affiliations

Reprogramming of the esophageal squamous carcinoma epigenome by SOX2 promotes ADAR1 dependence

Zhong Wu et al. Nat Genet. 2021 Jun.

Abstract

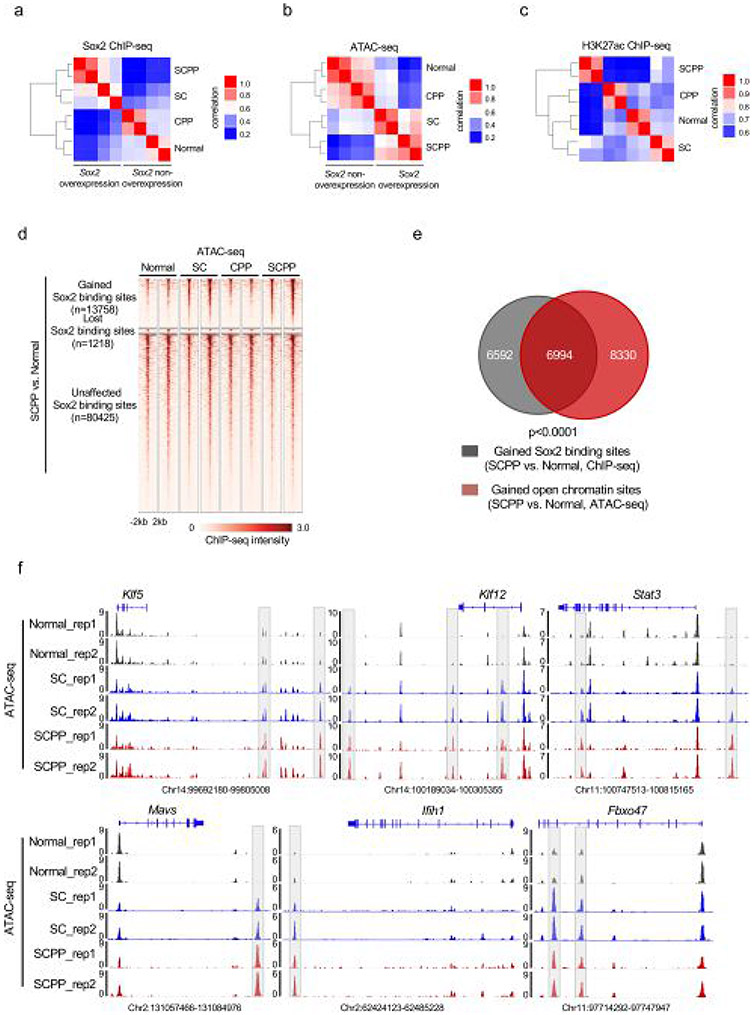
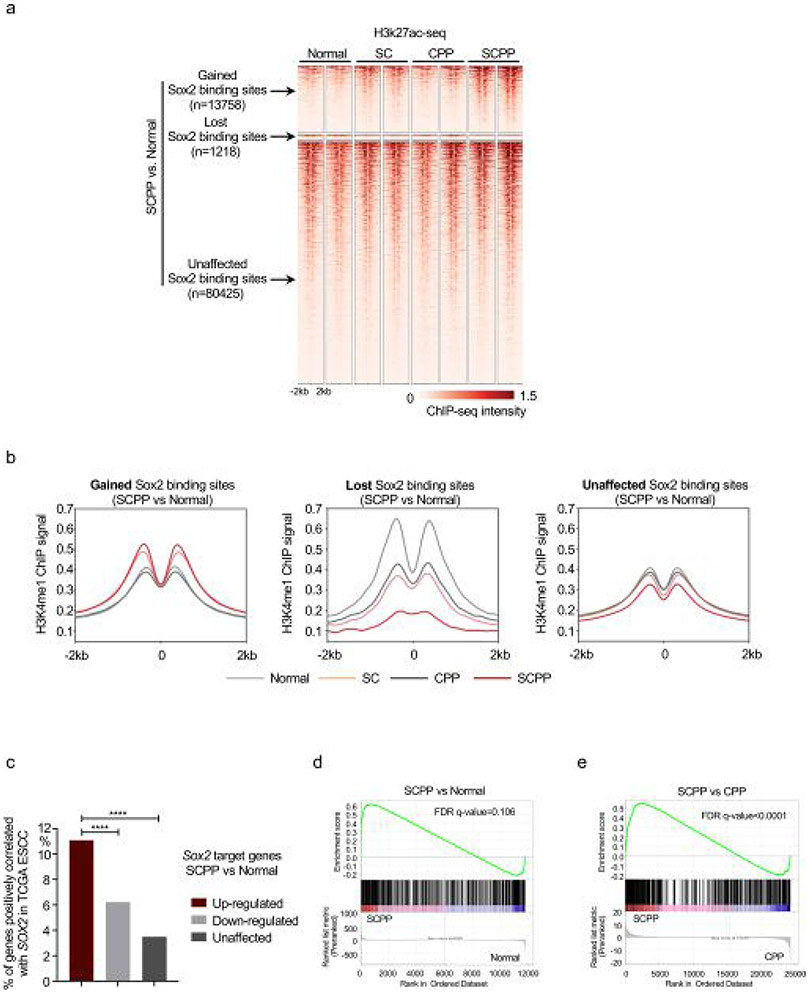
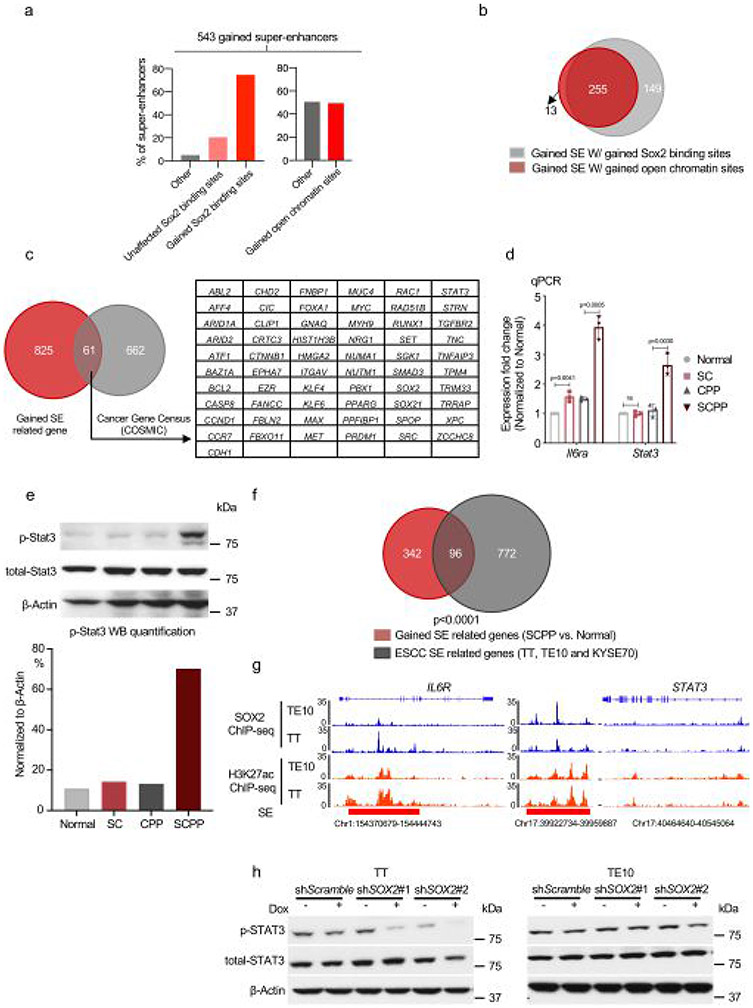
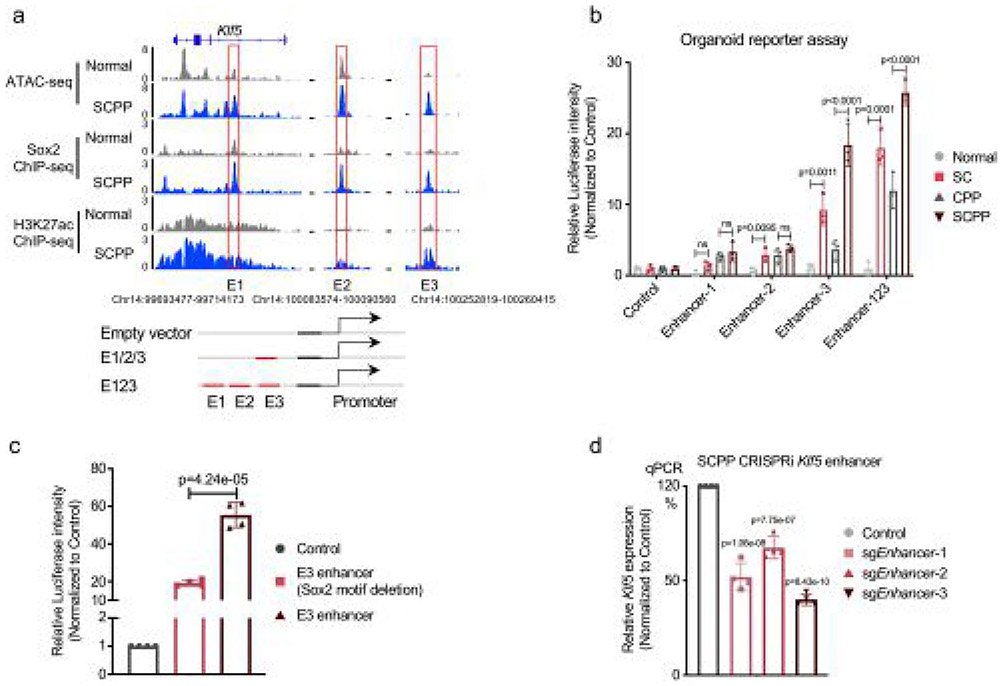
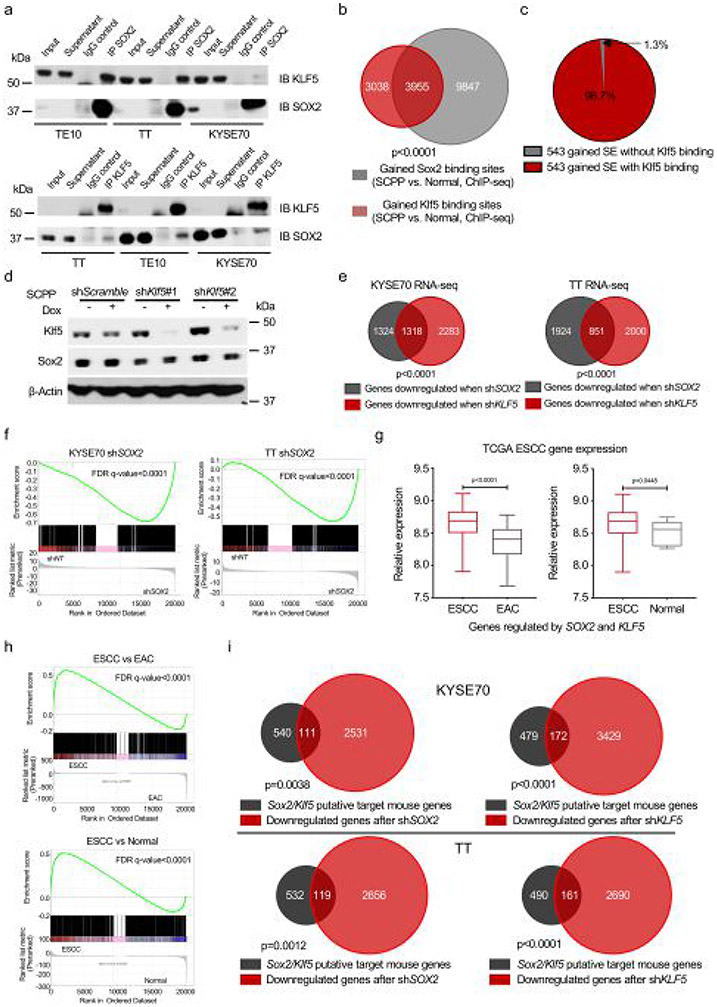
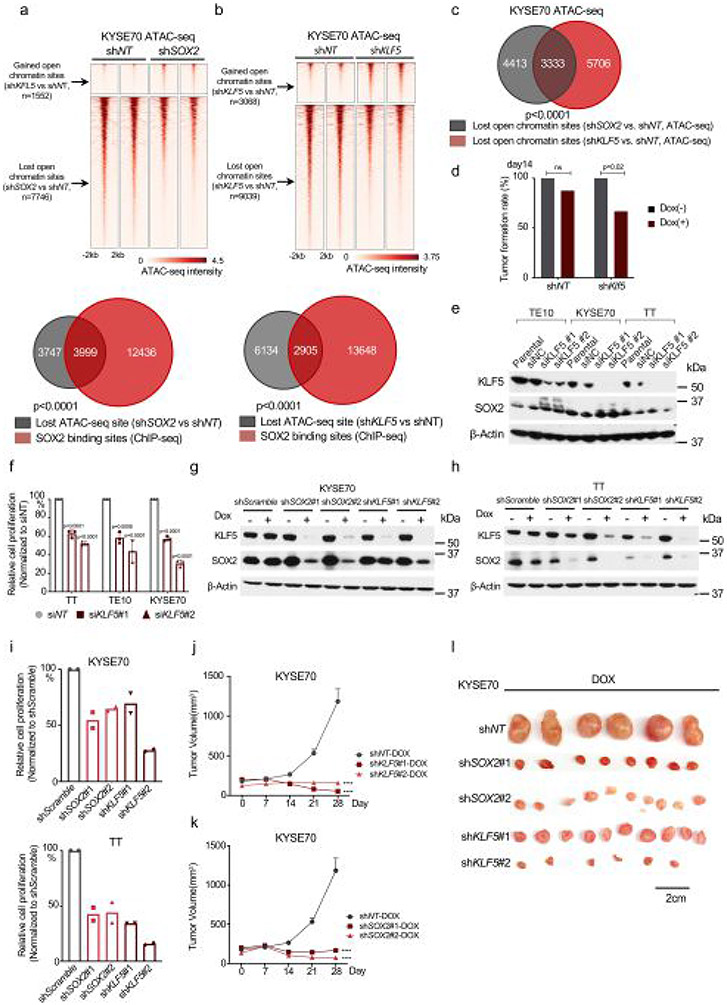
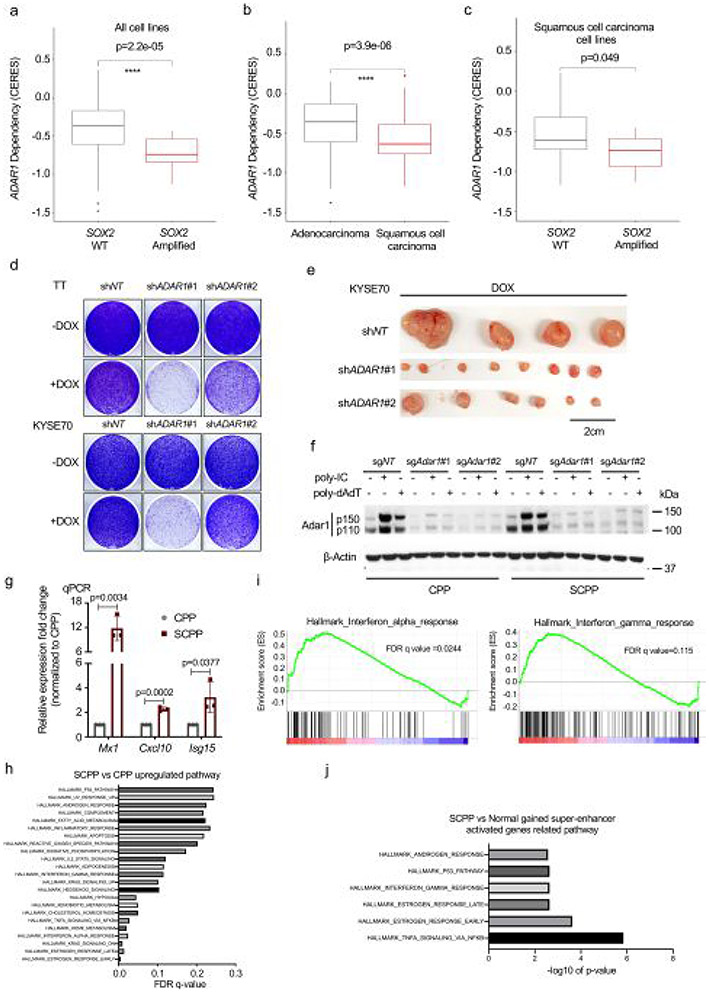
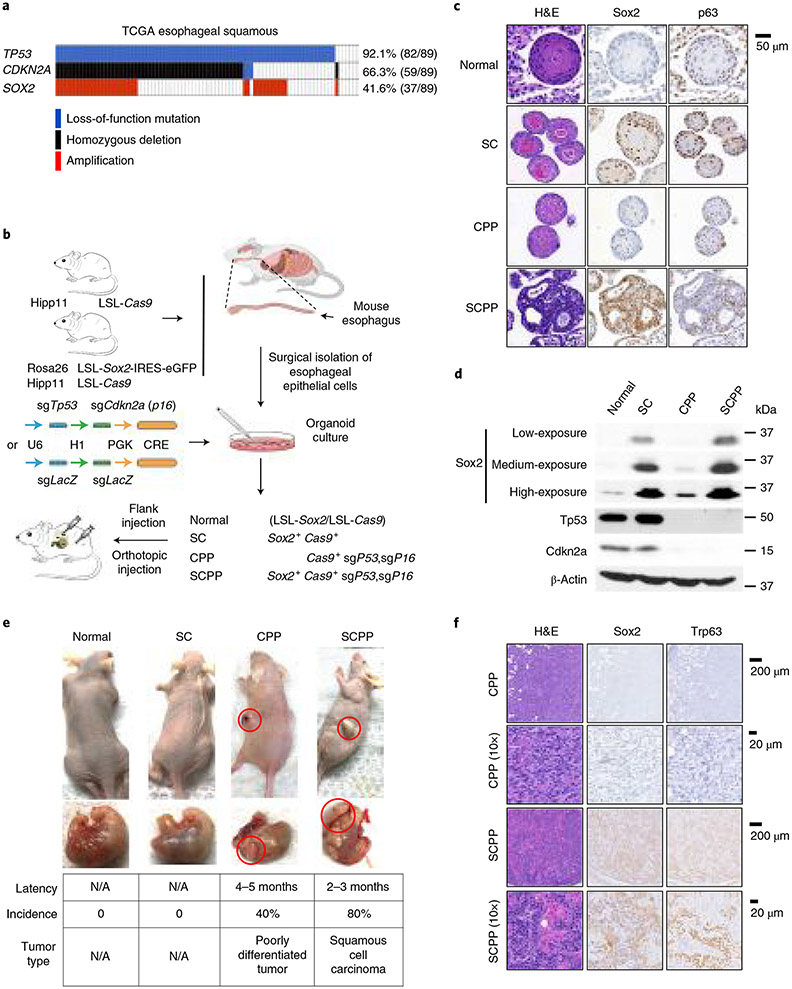
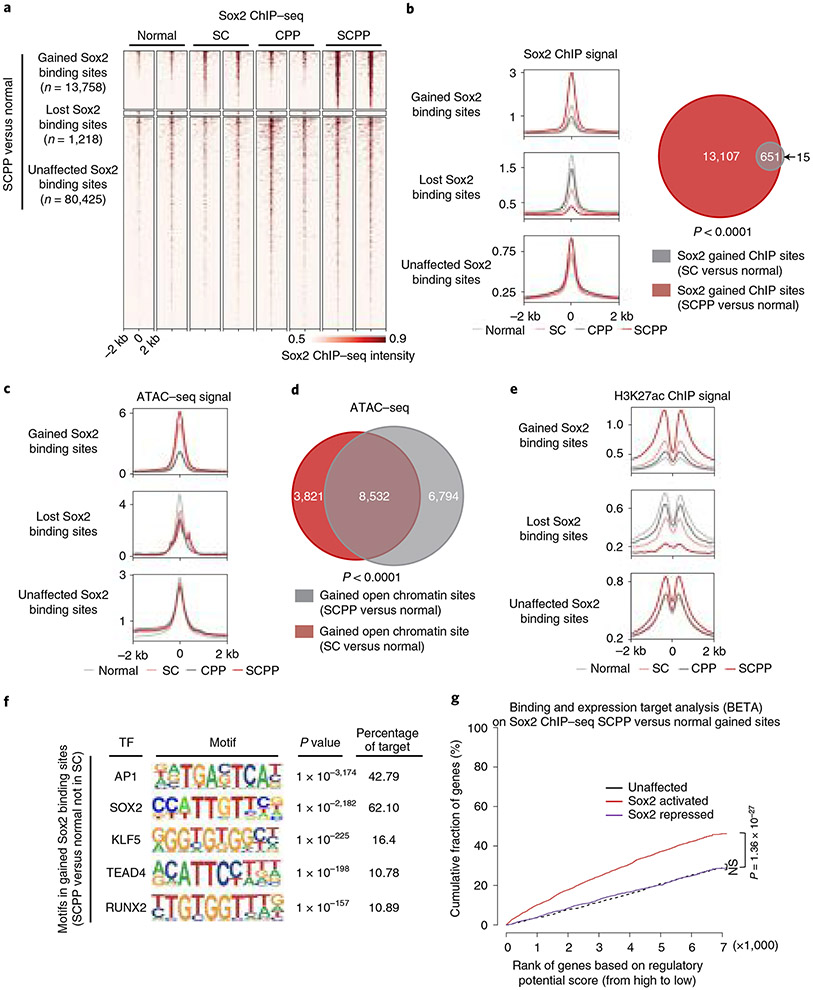
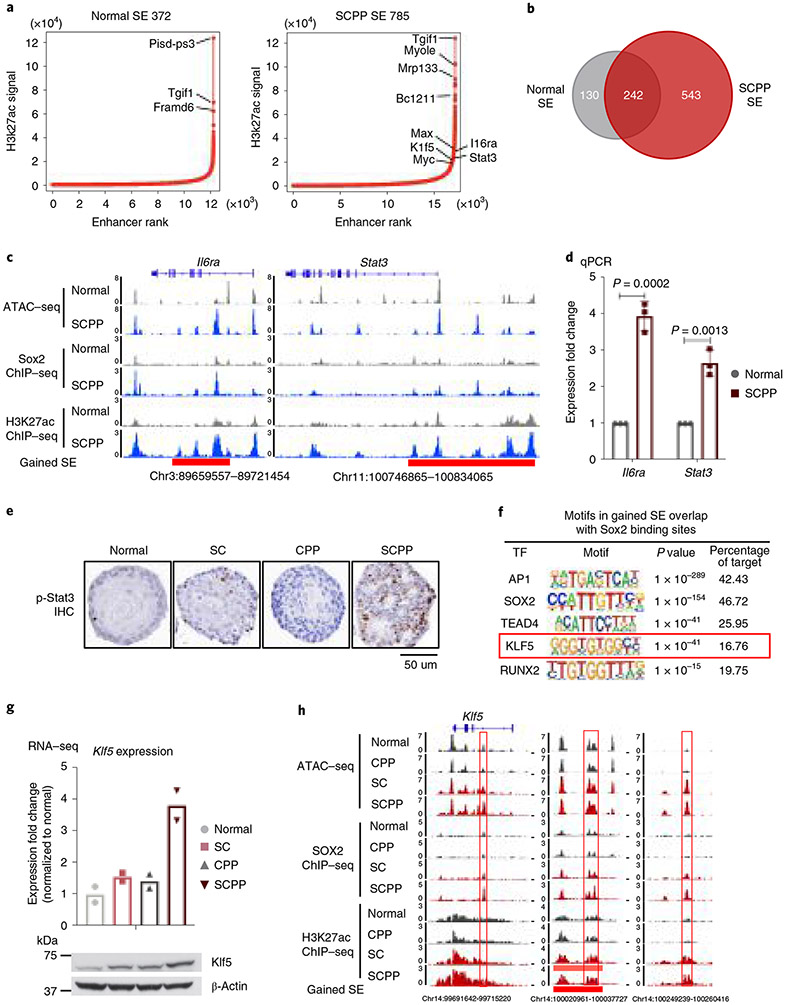
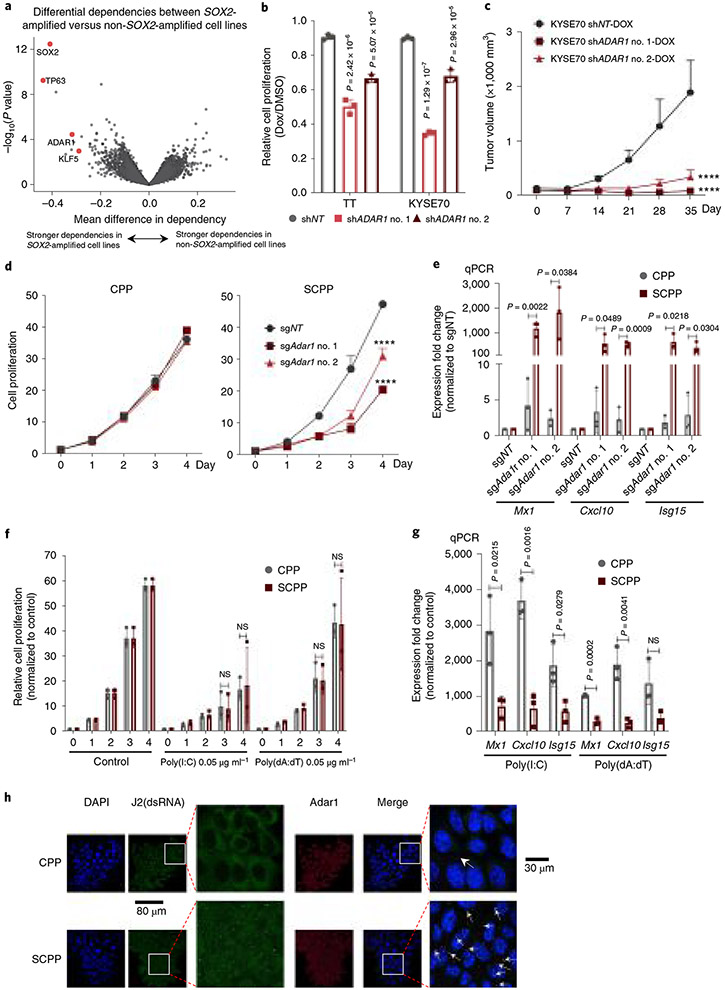
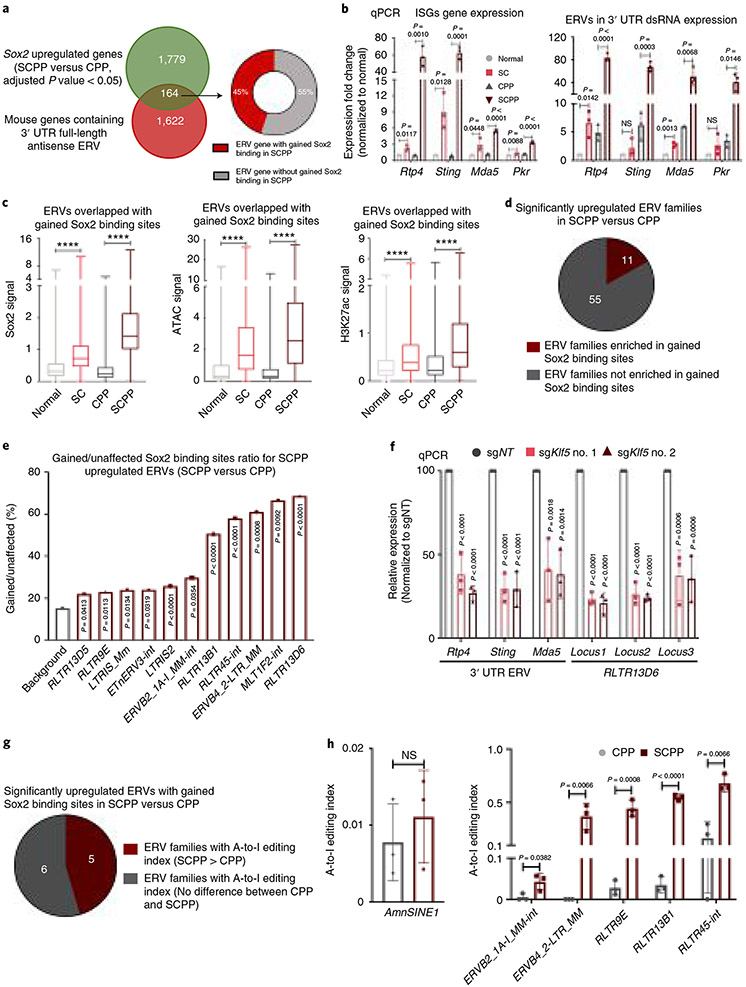
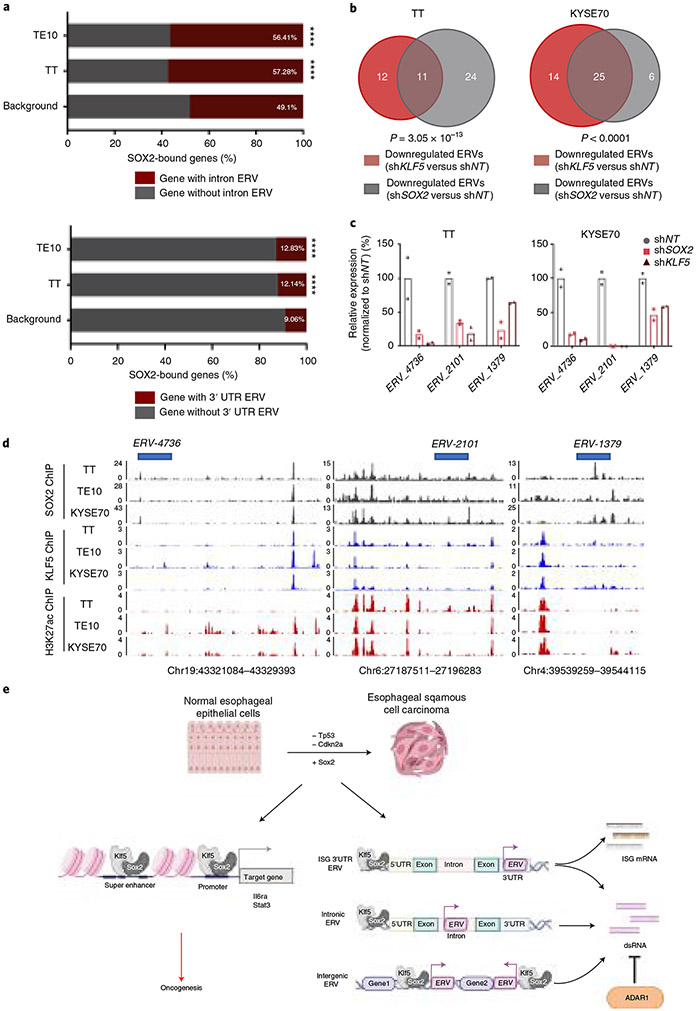
Esophageal squamous cell carcinomas (ESCCs) harbor recurrent chromosome 3q amplifications that target the transcription factor SOX2. Beyond its role as an oncogene in ESCC, SOX2 acts in development of the squamous esophagus and maintenance of adult esophageal precursor cells. To compare Sox2 activity in normal and malignant tissue, we developed engineered murine esophageal organoids spanning normal esophagus to Sox2-induced squamous cell carcinoma and mapped Sox2 binding and the epigenetic and transcriptional landscape with evolution from normal to cancer. While oncogenic Sox2 largely maintains actions observed in normal tissue, Sox2 overexpression with p53 and p16 inactivation promotes chromatin remodeling and evolution of the Sox2 cistrome. With Klf5, oncogenic Sox2 acquires new binding sites and enhances activity of oncogenes such as Stat3. Moreover, oncogenic Sox2 activates endogenous retroviruses, inducing expression of double-stranded RNA and dependence on the RNA editing enzyme ADAR1. These data reveal SOX2 functions in ESCC, defining targetable vulnerabilities.


Figures

Extended Data Fig. 1 ∣
Extended Data Fig. 1 ∣. Overexpression of Sox2 and loss of Trp53/Cdkn2a give rise to esophageal squamous cell carcinoma (ESCC).
a, Immunoblots and quantification of p63 expression in four engineered organoids (normalized to β-actin) (representative image from 2 independent experiments). b, Immunoblots of Sox2 in mouse organoids, human ESCC cell lines and a normal esophageal epithelium cell line EPC2 (representative image from 2 independent experiments).
Extended Data Fig. 2 ∣
Extended Data Fig. 2 ∣. Genomic occupancy of Sox2 changes from normal to neoplastic organoids.
a, Pairwise Spearman correlation of Sox2 ChIP-seq between the Sox2 overexpression and non-overexpression organoids. Unsupervised hierarchical clustering showed the relatedness of each sample. Two independent biological replicates were performed and shown for each organoid. b, Pairwise Spearman correlation of ATAC-seq between the Sox2 overexpression and non-overexpression organoids. Unsupervised hierarchical clustering shows the correlation for each pairs of the biological replicates. Two independent biological replicates were performed and shown for each organoid. c, Pairwise Spearman correlation of H3K27ac ChIP-seq between the Sox2 overexpression and non-overexpression organoids. Unsupervised hierarchical clustering showed the correlation between each sample pair from the same organoid. Two independent biological replicates were performed and shown for each organoid. d, Heatmaps of ATAC-seq signals ±2 kb around Sox2 peaks (identified in Fig. 2a) across different organoids. Two independent biological replicates were performed and shown for each organoid. e, Venn Diagram shows the overlap of Sox2 sites that are gained in SCPP (vs. Normal) and open chromatin sites in SCPP (vs. Normal), as defined by ATAC-seq signal. P < 0.0001 calculated by two-sided fisher exact test (SCPP vs. Normal (unchanged chromatin sites as control). f, Representative ATAC-seq tracks, showing increased chromatin accessibility at Klf5, Klf12, Stat3, Mavs, Ifih1 and Fbxo47 locus in normal, SC and SCPP organoids.
Extended Data Fig. 3 ∣
Extended Data Fig. 3 ∣. Evolution of genomic occupancy and Sox2 activation changes from normal to neoplastic organoids.
a, Heatmaps of H3K27ac ChIP-seq signal ±2 kb around Sox2 peaks (identified in Fig. 2a) across different organoids. Two independent biological replicates were performed and shown for each organoid. b, H3K4me1 ChIP-seq signals ±2 kb around Sox2 peaks (identified in Fig. 2a) across different organoids. Two independent biological replicates were performed and shown for each organoid. c, The ratio of SOX2 positive correlated genes from TCGA ESCC in Sox2 up/down/unaffected genes in the comparison of SCPP vs Normal organoid models, **** p < 0.0001 calculated by two-sided fisher exact test for 2 × 2 contingency table. d, Genes that are significantly positively correlated with SOX2 in TCGA ESSC samples as a ‘Gene Set’ with Gene Set Enrichment Analysis (GSEA) used to quantify expression differences of the gene set between SCPP and Normal organoids. (Two-sided FDR-adjusted q-value=0.106; nominal p = 0.106 calculated by the GSEA package) e, Genes that are significantly positively correlated with SOX2 in TCGA ESSC samples as a ‘Gene Set’ with GSEA is used to quantify expression differences of the gene set between SCPP and CPP organoids. (Two-sided FDR-adjusted q-value<0.0001; nominal p < 0.0001 calculated by the GSEA package).
Extended Data Fig. 4 ∣
Extended Data Fig. 4 ∣. Sox2 overexpression creates new super-enhancers (SE) and activates cancer promoting genes.
a, The percentage of super-enhancers harboring gained Sox2 binding sites (left) or gained chromatin open sites (right). The super-enhancers are categorized as ‘Gained’, ‘Shared’ and ‘Lost’ based on the comparison between SCPP and Normal organoids. Gained Sox2 sites or chromatin open sites refer to the ones gained in SCPP organoids compared to Normal organoids. b, Venn diagram showing overlap of gained SEs with Sox2 binding sites gained in SCPP (vs. Normal) and gained SEs with open chromatin sites, defined by ATAC-seq in SCPP (vs. Normal). c, Venn diagram showing overlap of gained SEs in SCPP (vs Normal) and the Cancer Gene Census. d, mRNA expression levels of Il6ra and Stat3 mRNA in 4 groups organoids by quantitative RT-PCR. Data are shown as Mean ± SD. NS: not significant and p-value calculated by two-sided unpaired t-tests. Three independent biological replicates were performed for each organoid. e, Immunoblot of p-Stat3 and total Stat3 in different organoids (representative image from 3 independent experiments) (up), and the quantification of the p-Stat3 expression in different organoids (down). f, Venn Diagram shows the overlap of super-enhancers that are gained in SCPP (vs. Normal) and shared super-enhancers across three ESCC cell lines (TT, TE10 and KYSE70). P < 0.0001 calculated by two-sided fisher exact test (ESCC super-enhancer unrelated genes as control). g, Representative SOX2 and H3K27ac ChIP-seq tracks showing super-enhancers at STAT3 and IL6R locus in ESCC cell lines TE10 and TT. h, Immunoblot of p-STAT3 and total STAT3 in ESCC cell line TE10 and TT after shRNA-mediated SOX2 silencing (representative image from 2 independent experiments).
Extended Data Fig. 5 ∣
Extended Data Fig. 5 ∣. Sox2 overexpression activates Klf5 by binding to Klf5 enhancer.
a, Sox2 and H3K27ac ChIP-seq and ATAC-seq profiles in Normal and SCPP organoids identify constituent enhancers e1-e3. b, Luciferase reporter assays measuring the enhancer activity of e1-e3 in four groups of organoids. The pGL3 plasmid without the enhancer region (empty) is used as a negative control. Along the Y-axis, relative Luciferase units are normalized to negative control. Three biological replicates were performed for each organoid. Data are shown as Mean ± SD, p-value calculated by one-way ANOVA followed by Benjamini-Hochberg correction. c, Luciferase reporter assays measuring the enhancer activity of E3 with and without the Sox2 motif deleted in SCPP organoids. The pGL3 plasmid without the enhancer region (empty) is used as a negative control. Along the Y-axis, relative Luciferase units are normalized to negative control. Four biological replicates were performed for each organoid. Data are shown as Mean ± SD, p-value calculated by two-sided t-tests. d, mRNA expression of Klf5 in SCPP organoids with and without dCAS9-mediated e1-e3 enhancer repression as measured by RT-PCR. The sgNT is used as a negative control. Four biological replicates were performed. Data are shown as Mean ± SD, p-value calculated by one-way ANOVA followed by Benjamini-Hochberg correction.
Extended Data Fig. 6 ∣
Extended Data Fig. 6 ∣. KLF5 facilitates enhanced SOX2 activity in squamous tumorigenesis.
a, SOX2-KLF5 interaction, shown by co-IP of SOX2 (top) and KLF5 (bottom), followed by immunoblotting in human ESCC cell line TE10, TT and KYSE70. b, Overlap of binding sites gained in SCPP (vs. Normal) by Sox2 and Klf5 ChIP-seq. P < 0.0001; two-sided fisher exact test with unchanged Klf5 binding sites as control. c, Percentage of gained super-enhancers in SCPP (from Fig. 3b) with Klf5 ChIP-seq occupancy. d, Immunoblots of Klf5 and Sox2 after shRNA-mediated Sox2 silencing in SCPP (representative image from 2 independent experiments). e, Overlap of downregulated genes upon shSOX2 and shKLF5 in KYSE70 (Left) and TT (Right). P < 0.0001; two-sided fisher exact test with shKLF5 unchanged genes as control. f, Genes that are significant down-regulated by shKLF5 in ESCC cell lines as a ‘Gene Set’ with GSEA to quantify their expression differences with shSOX2 in KYSE70 (Left) and TT (Right) with two-sided FDR-adjusted q-value<0.0001; nominal p < 0.0001 calculated using the GSEA package. g, Differential expression level of 95 genes regulated by SOX2 and KLF5 (genes down-regulated by shSOX2 and shKLF5 in KYSE70 and TT) in TCGA ESCC (Esophageal squamous cell carcinoma) EAC (Esophageal adenocarcinoma) and Normal esophagus samples. P < 0.0001 **** by two-sided t-tests. Boxes indicate interquartile range, and whiskers show maximum and minimum values. Horizontal line, median. h, Genes regulated by SOX2 and KLF5 in ESCC cell lines as a ‘Gene Set’ with GSEA to measure their expression differences between ESCC vs EAC (Top) and ESCC vs Normal (Bottom) with two-sided FDR-adjusted q-value<0.0001; nominal p < 0.0001 calculated using the GSEA package. i, Overlap between SOX2/KLF5 putative target genes and significantly downregulated genes upon shSOX2 (left) and shKLF5 (right) in KYSE70 (top) and TT (bottom). SOX2/KLF5 target genes are defined by intersection of 1) Significantly upregulated genes in SCPP vs Normal; 2) Genes that gain Sox2 and Klf5 binding sites in SCPP vs Normal. P-value; two-sided fisher exact test with SOX2/KLF5 unrelated genes as control.
Extended Data Fig. 7 ∣
Extended Data Fig. 7 ∣. Klf5 facilitates SOX2 activity and is essential for SOX2 + ESCC.
a, ATAC-seq signal (horizontal window of ±2 kb from the peak center) in open-chromatin sites lost upon shSOX2 in KYSE70 (Top). (Bottom) Overlap of open-chromatin sites lost upon shSOX2 and endogenous SOX2 binding sites in KYSE70 cells. P < 0.0001 by fisher exact test with KYSE70 shSOX2 unchanged chromatin sites as control. b, ATAC-seq signal in open-chromatin sites gained and lost upon shKLF5 in KYSE70 (Top). Two independent biological replicates are shown. (Bottom) overlap of open-chromatin sites lost upon shKLF5 and endogenous SOX2 binding sites in KYSE70. P < 0.0001 by fisher exact test with KYSE70 shKLF5 unchanged chromatin sites as control. c, Overlap of lost ATAC-seq signals after shRNA-mediated SOX2 or KLF5 silencing in KYSE70. P < 0.0001 by two-sided fisher exact test (KYSE70 shKLF5 unchanged sites as control). d, Tumor formation rate of SCPP organoids with or without Klf5 silencing. Each group includes 6–10 tumors. Ns: not significant, p-value by two-sided fisher exact test. e, Immunoblots following siKLF5 in human ESCC cell lines. f, Proliferation TE10, KYSE70 and TT after KLF5 siRNA. Three independent biological replicates were performed for each cell line. Data were normalized to control siRNA and shown as mean ± SD, p-value by one-way ANOVA with Benjamini-Hochberg correction. g, Representative immunoblots of KYSE70 72 hours after shRNA-mediated SOX2 and KLF5 silencing. h, Representative immunoblots of TT 72 hours after shRNA-mediated SOX2 and KLF5 silencing. i, Proliferation of KYSE70 (Top) and TT (Bottom) 72 hours after shRNA-mediated SOX2 and KLF5 silencing. Two biological replicates were performed. j, Growth for KYSE70 xenografts (n = 6–10) with shKLF5. Data are shown as mean ± SEM; ****p < 0.0001 by two-sided two-way ANOVA with Benjamini-Hochberg correction. k, Growth for KYSE70 xenografts (n = 6–10) with shSOX2. Data are shown as mean ± SEM; ****p < 0.0001 by two-sided two-way ANOVA with Benjamini-Hochberg correction. l, Tumor volume of KYSE70 with noted inducible shRNA. Representative images of tumors from panel. Scale bar is 2 cm. 6–10 tumors per group.
Extended Data Fig. 8 ∣
Extended Data Fig. 8 ∣. SOX2 overexpression induces IFN activation and promotes ADAR1 dependency.
a-c, ADAR1 dependency from genome-wide CRISPR screening in (a) 608 SOX2 amplified cell lines versus 16 non SOX2 amplified cell lines (b) 65 SCCs versus 246 adenocarcinoma cell lines (c) 10 SOX2 amplified SCC versus 55 non SOX2 amplified SCC cell lines. Box and whisker plots show the median (center line), interquartile range (box), 1.5 x interquartile range (whiskers), and outliers (points). Two-sided Mann-Whitney U tests were performed to assess significant differences in ADAR1 dependency, which are defined using CERES scores from the Dependency Map’s 19Q3 data release. SOX2 amplified lines are defined as those with log2(copy ratio) > 1. d, Representative images of crystal violet staining from noted human ESCC cell lines grown for two weeks treatment with or without doxycycline induction of indicated ADAR1 shRNA. Two biological replicates were performed. e, Tumor volume of 2 × 10⁶ KYSE70 cells transduced with indicated inducible ADAR1 shRNA injected into flanks of nude mice and provided doxycycline-containing food (625 ppm). Representative images of tumors from panel. Scale bar is 2 cm. 4–8 tumors per group. f, Immunoblots of Adar1 depletion in CPP and SCPP organoids following transduction with indicated Adar1 sgRNA and with transfection of control, dsRNA (poly IC) and dsDNA (poly dAdT). (This experiment was repeated once with similar results). g, mRNA expression of Mx1, Cxcl10 and Isg15 in CPP and SCPP by quantitative-PCR. Three biological replicates were performed for each organoid. Data are shown as mean ± SD, p-value calculated by two-sided unpaired t-tests. h, Gene-Set Enrichment Analysis (GSEA) of pathways upregulated in SCPP compared with CPP organoids. (FDR-adjusted q-value calculated using the GSEA package) i, Enrichment scores (ES) plots for the interferon alpha and gamma gene sets in comparison of mRNA profiles of SCPP compared to CPP organoids. (Left, two-sided FDR-adjusted q-value=0.024; nominal p = 0.008 calculated using the GSEA package) (Right, two-sided FDR-adjusted q-value=0.015; nominal p = 0.034 calculated using the GSEA package) j, The most statistically enriched pathway identified from significant upregulation gained super-enhancer related genes in the comparison of SCPP vs Normal organoids (nominal p-value calculated using the GSEA package).
Extended Data Fig. 9 ∣
Extended Data Fig. 9 ∣. Sox2/Klf5 complexes induce IFN activation.
a, Most enriched pathways from upregulated genes at loci of gained Sox2 binding sites (SCPP vs Normal organoids); nominal p-value from GSEA package. b, Representative ATAC-seq, Sox2 and H3K27ac ChIP-seq tracks, showing increased accessibility, Sox2 binding and H3K27ac level at Tmem173 (Sting), Mavs and Dhx58 (Lgp2) loci in SCPP (versus CPP). c, mRNA expression of Sting and Lgp2 Normal and SCPP by mRNA seq; two biological replicates performed. d, Quantification of binding of Sox2 and Klf5 as assessed by ChIP-PCR at loci of Tmem173 (Sting), Il6ra and Ifih1(Mda5); Three biological replicates. Data are shown as mean ± SD; p-value by two-sided t-tests. e, mRNA expression Mx1, Cxcl10 and Isg15 in CPP and SCPP as assessed by quantitative RT-PCR 24 h after infection with H1N1 flu virus; tree independent biological replicates. Data are shown as mean ± SD, p-value calculated by two-sided unpaired t-tests. f, mRNA expression of Mx1, Cxcl10 and Isg15 in CPP and SCPP as assessed by quantitative RT-PCR 24 h after transfection with 5’ppp-dsRNA (normalized to 5’ppp-dsRNA control); three independent biological replicates. Data are shown as mean ± SD, NS: not significant as calculated by two-sided unpaired t-tests. g, Quantification of J2(dsRNA) and Adar1 staining in CPP and SCPP (Image J software) with signals normalized to cell number and then CPP; three technical replicates per condition. The data are shown as mean ± SD, p-value calculated by two-sided unpaired t-tests. h, Representative double immunofluorescence images for J2(dsRNA; green) and Adar1 (red) and DAPI (blue) in SCPP with Adar1 silencing. Scale bar=40um. (This experiment was repeated once with similar results). i, Quantification of J2(dsRNA) (Left) and Adar1 (Right) in SCPP with CRISPR-mediated Adar1 knockout. The signal of sgAdar1 was normalized to cell number and then sgNT; three technical replicates. The data are shown as mean ± SD, p-value by one-way ANOVA test with Benjamini-Hochberg correction.
Extended Data Fig. 10 ∣
Extended Data Fig. 10 ∣. SOX2 enhances dsRNA expression by activating endogenous retroviruses transcription.
a, Pie chart depicts the number of upregulated ERV families in SCPP versus CPP with/without enrichment of gained Klf5 binding sites. b, Bar graph illustrates the enrichment of gained Klf5-binding sites in specific ERV families highlighted in Supplemental Fig. 6a. The background ratio was determined by Klf5 ChIP-seq gained sites/unaffected sites in SCPP vs CPP. P-value calculated by two-sided fisher exact test (Background as control). c, Representative H3K27ac ChIP-seq, Sox2 ChIP-seq, Klf5 ChIP-seq and ATAC-seq tracks, showing increased H3K27ac level, gained Sox2 binding, gained Klf5 binding and increased chromatin accessibility at different RLTR13D6 loci in SCPP versus CPP organoids. d, The relative expression of representative RLTR13D6 ERVs in different organoids was assessed by quantitative RT-PCR. Three independent biological replicates were performed for each condition. Data are shown as mean ± SD, p-value calculated by two-sided t-tests. e, The relative ERV expressions of different gained H3K27ac sites (SCPP vs CPP) across four organoids by quantitative PCR. Three biological replicates were performed for each organoid. The data are shown as mean ± SD, p-value calculated by two-sided t-tests. f, Representative double immunofluorescence images for dsRNA marker J2(dsRNA) and Adar1 in SCPP organoid with shRNA-mediated KLF5 silencing. FITC (green), phalloidin (red) and DAPI (blue) channels were used to detect J2(dsRNA), Adar1, and nucleus, respectively. Scale bar=40 um. (This experiment was repeated once with similar results). g. Quantification of the J2(dsRNA) staining in SCPP organoid with shRNA-mediated Klf5 silencing. The signal of shKlf5 was normalized to cell number and then shNT. Three technical replicates were performed for each condition. The data are shown as mean ± SD, NS: not significant and ****p < 0.0001 as calculated by the two-sided one-way ANOVA test followed by Benjamini-Hochberg correction. h, Quantification of the J2(dsRNA) staining in ESCC cell line TT and TE10 with shRNA-mediated SOX2 or KLF5 knockdown. Data are normalized to cell number and Dox (−) and shown as mean ± SD, NS: not significant and ****p < 0.0001 as calculated by two-sided unpaired t-tests.
Fig. 1 ∣
Fig. 1 ∣. Overexpression of Sox2 and loss of Trp53/Cdkn2a give rise to ESCC.
a, Genomic aberrations of TP53, CDKN2A and SOX2 in ESCC samples from TCGA. Each column denotes a tumor. The types of alterations are shown in the marked colors. b, Schematic diagram of generating organoids with different genotypes from mouse esophageal epithelial cells that were isolated from Rosa26CAG-loxp-stop-loxp-Sox2-IRES-Egfp (LSL-Sox2); H11CAG-loxp-stop-loxp-Cas9 (LSL-Cos9) mice. CRISPR-mediated knockout of Trp53 and Cdkn2a (p16) or LacZ was introduced to organoids before implantation into nude mice. c, Representative images of hematoxylin and eosin (H&E) and immunohistochemistry (IHC) staining of p63 and Sox2 in engineered organoids. (This experiment was repeated once with similar results.) d, Immunoblots of Sox2, p53 and Cdkn2a in noted engineered organoids. (This experiment was repeated twice with similar results). e, Representative images of orthotopic and subcutaneous tumors from implanted engineered organoids (top) and tumor characteristics (bottom). Each group consists of ten mice, each bearing two tumors. (This experiment was repeated twice with similar results.) f, Representative H&E staining, and Sox2 and Trp63 IHC staining in tumors derived from CPP and SCPP organoids. (This experiment was repeated once with similar results.) N/A, not applicable.
Fig. 2 ∣
Fig. 2 ∣. Overexpressed Sox2 gains new binding sites that exhibit increased transcriptional regulatory activity.
a, Heatmaps of Sox2 ChIP–seq signals in organoids with noted genotypes. Sox2 binding sites were characterized as those gained, unaffected and lost based on the comparison of Sox2 ChIP–seq results from normal and SCPP organoids. Sites were ranked from the strongest to weakest Sox2 binding for each category, shown in ±2-kb windows centered at Sox2 binding sites. Two independent biological replicates were performed and are shown for each organoid. b, Left, averaged Sox2 ChIP–seq signals centered at the gained, unaffected and lost Sox2 binding sites, as determined above, across different organoids. Averaged signals of two biological replicates are shown. Right, the Venn diagram represents the overlap of Sox2 binding sites gained in SCPP (versus normal) and SC (versus normal) organoids. P < 0.0001 calculated by two-sided Fisher exact test (SC versus normal unchanged Sox2 binding sites as control). c, ATAC–seq signals at the gained, unaffected and lost Sox2 binding sites, as determined above, across different organoids. Averaged signals of two biological replicates are shown. d, Venn diagram shows substantial overlap of open chromatin sites, as defined by ATAC–seq signal, that are gained in SCPP (versus normal) and SC (versus normal) organoids. P < 0.0001 calculated by two-sided Fisher exact test (SC versus normal unchanged chromatin open sites as control). e, H3K27ac ChIP–seq signals at the gained, unaffected and lost Sox2 binding sites, as determined above, across different organoids. Averaged signals of two biological replicates are shown. f, Top transcription factor binding motifs enriched in the Sox2 binding sites gained in SCPP (versus normal). P values were calculated by the HOMER package. g, BETA of activating and repressive function of the gained Sox2 binding sites. The red, purple and black lines represent cumulative fractions of genes that are activated, unaffected or repressed by Sox2 (based on RNA-seq results), respectively. The genes are ranked based on their regulatory potential scores (based on Sox2 ChIP–seq results; more details are described in the Methods). P values were calculated by two-sided Kolmogorov–Smirnov tests. NS, not significant.
Fig. 3 ∣
Fig. 3 ∣. Sox2 overexpression is associated with new SEs and Klf5 activation.
a, ‘Hockey-stick’ plots show putative enhancers and SEs determined by H3K27ac ChIP–seq in normal and SCPP organoids. The horizontal line represents the demarcation between typical enhancers (below) and SEs (above). b, Venn diagram shows overlap of SEs identified in normal and SCPP organoids. c, Representative ATAC–seq, Sox2 ChIP–seq and H3K27ac ChIP–seq tracks, showing increased chromatin accessibility, gained Sox2 binding, increased H3K27ac level and formation of de novo SEs at the Stat3 and Il6ra loci in SCPP versus normal organoids. d, mRNA expression of Stat3 and Il6ra in SCPP and normal organoids as measured by RT–qPCR. Data are shown as mean±s.d. Three independent biological replicates were performed for each organoid. P values calculated by two-sided unpaired t-test. e, Representative IHC staining of phospho-Stat3 level in different organoids. (This experiment was repeated once with similar results.) f, Top transcription factor motifs enriched in de novo SEs bound by Sox2 in SCPP organoid; P values were calculated by the HOMER package. g, mRNA expression (RNA-seq) and immunoblot of Klf5 in different organoids. Two biological replicates were performed for each organoid. h, Representative ATAC–seq, Sox2 ChIP–seq and H3K27ac ChIP–seq tracks show increased chromatin accessibility, gained Sox2 binding, increased H3K27ac level and formation of de novo SEs at the Klf5 locus in Sox2-overexpressed organoid. Selected peaks are highlighted in red boxes.
Fig. 4 ∣
Fig. 4 ∣. KLF5 is essential for the function of SOX2 in esophageal squamous tumorigenesis.
a, Immunoblots (IB) show KLF5 coimmunoprecipitated with SOX2 in human ESCC cell line KYSE70 (top) and mouse SCPP organoid (bottom). (This experiment was repeated twice with similar results.) b, Heatmaps of Klf5 ChIP–seq signals ±2 kb around Sox2 peaks (identified in Fig. 2b) across different organoids. Two independent biological replicates are shown. c, Averaged Klf5 ChIP–seq signal at the gained, unaffected or lost Sox2 binding. Klf5 ChIP–seq signal was averaged from two independent biological replicates. d, Heatmap of averaged Sox2 ChIP–seq signals in gained (top) and lost (bottom) Sox2 binding sites of SCPP organoid upon shRNA-mediated Klf5 knockdown. Two independent biological replicates are shown. e, Venn diagram shows the overlap of Sox2 sites that are gained in SCPP (versus normal) and Sox2 sites that are lost post shRNA-mediated Sox2 silencing in the SCPP organoids. Sites were identified from two independent biological replicates. P < 0.0001 calculated by two-sided Fisher exact test (SCPP shKlf5 unchanged Sox2 binding sites as control). f, Venn diagram shows significant overlap of upregulated genes and downregulated genes (SCPP versus normal) upon shRNA-mediated Klf5 silencing in SCPP organoids. P < 0.0001 calculated by two-sided Fisher exact test (SCPP shKlf5 unchanged genes as control). g, Venn diagrams show significant overlap of downregulated genes upon shRNA-mediated Klf5 knockdown in SCPP organoid and gained Sox2 binding-related genes (top, left), gained Klf5 binding-related genes (top, right), gained H3K27ac sites-related genes (bottom, left) and gained open chromatin sites-related genes (bottom, left) in the comparison of SCPP versus normal. P < 0.0001 calculated by two-sided Fisher exact test (SCPP shKlf5 unchanged genes as control). h, Cell viability of CPP and SCPP organoids was assessed by adenosine triphosphate (ATP) bioluminescence 4 d after control or Klf5 silencing with shRNA. Three independent biological replicates were performed for each organoid. ATP bioluminescence values were normalized to the value of day 0. Data are shown as mean±s.d.; NS, not significant; and P values calculated by two-sided one-way ANOVA followed by Benjamini–Hochberg correction.
Fig. 5 ∣
Fig. 5 ∣. Sox2 overexpression confers enhanced dependency on Adar1 and promotes IFN pathway activation.
a, Plot shows differential gene dependencies between SOX2-amplified and nonamplified cancer cell lines from CRISPR screening data. The effect size denotes mean difference of gene dependency score between the two groups with P values estimated from empirical Bayes moderated t-statistics using the Limma R package. b, Cell viability of human ESCC cell lines TT and KYSE70 is shown 5 d after shRNA-mediated ADAR1 silencing. Data were normalized to nontargeting shRNA control (n = 3 independent replicates) and are shown as mean ± s.d.; P values were calculated by two-sided one-way ANOVA with Benjamini–Hochberg correction. c, Growth curve for KYSE70 xenograft tumors (n = 6–8) with shRNA-mediated ADAR1 silencing. Data are shown as mean ± s.e.m.; ****P < 0.0001 calculated by two-way ANOVA with Benjamini–Hochberg correction. d, Cell viability of CPP (left) and SCPP (right) organoids is depicted following control or Adar1 silencing by shRNA (n = 3 independent replicates). Data are shown as mean ± s.d.; ****P < 0.0001 from two-way ANOVA with Benjamini–Hochberg correction. Technical replicates from one representative experiment are shown (n = 3). e, mRNA expression of ISGs (Mx1, Cxcl10 and Isg15) in CPP and SCPP organoids was assessed by RT–qPCR after control or Adar1 knockout (n = 3 independent replicates). Data are shown as mean ± s.d.; P values were calculated by two-sided unpaired t-tests. f, Cell viability of CPP and SCPP was assessed after transfection with dsRNA poly(I:C) or dsDNA poly(dA:dT). Data were normalized to mock infection control (n = 3 independent replicates). Data are mean ± s.d.; NS, not significant calculated by two-sided unpaired t-tests. g, mRNA expression of ISGs (Mx1, Cxcl10 and Isg15) in CPP and SCPP organoids was assessed by RT–qPCR 24 h after transfection with dsRNA poly(I:C) or dsDNA poly(dA:dT) (n = 3 independent replicates). Data are mean ± s.d.; NS, not significant; P values calculated by two-sided unpaired t-tests. h, Representative double immunofluorescence images in CPP and SCPP organoids with fluorescein isothiocyanate (FITC) (green), phalloidin (red) and 4′,6-diamidino-2-phenylindole (DAPI) (blue) were used to detect J2, Adar1 and nucleus, respectively. Scale bar, 80 μm or 30 μm. (This experiment was repeated once with similar results.) DMSO, dimethylsulfoxide; Dox, doxycycline.
Fig. 6 ∣
Fig. 6 ∣. Sox2 directly binds to and activates ERVs in Sox2-overexpressing murine ESCC organoids.
a, Venn diagram shows the overlap between genes containing 3′ UTR antisense ERVs and genes that are significantly upregulated in SCPP versus CPP. Of the overlapping genes, 45% were found to be adjacent to gained Sox2 binding sites in SCPP (within 50 kb of TSS). b, Gene expression of ISGs Rtp4, Sting, Mda5 and Pkr (left) and their corresponding 3′ UTR antisense ERVs (right) was assessed by RT–qPCR in noted organoids (n = 3 independent replicates). Data are shown as mean ± s.d.; NS, not significant; P values were calculated by two-sided t-tests. c, Sox2 ChIP–seq signals (left), ATAC–seq signals (middle) and H3K27ac ChIP–seq signals (right) at ERV sites that overlap with the gained Sox2 binding sites (2,751 sites) were compared among different organoids. ****P < 0.0001 calculated by two-sided one-way ANOVA followed by Benjamini–Hochberg correction. Boxes indicate interquartile range, and whiskers show maximum and minimum values. Horizontal line, median. d, Pie chart depicts the number of upregulated ERV families in SCPP versus CPP with/without enrichment of gained Sox2 binding sites. e, Bar graph illustrates the enrichment of gained Sox2 binding sites in ERV families highlighted in d. The background ratio was determined by Sox2 ChIP–seq gained sites/unaffected sites in SCPP versus CPP. P values were calculated by two-sided Fisher exact test (background as control). f, The relative expression of ISG 3′ UTR ERVs and representative RLTR13D6 ERVs in SCPP organoids upon CRISPR-mediated Klf5 knockout was assessed by RT–qPCR (n = 3 independent replicates). Data are shown as mean ± s.d.; P values were calculated by one-way ANOVA followed by Benjamini–Hochberg correction. g, Pie chart depicts the number of upregulated ERV families with enrichment of gained Sox2 binding sites with preferentially A-to-I editing or no difference in SCPP versus CPP. h, Quantification of A-to-I editing in AmnSINE1 (SINEs) (left) and ERV families that are significantly upregulated with enrichment of gained Sox2 binding sites and have higher A-to-I editing index in the comparison of SCPP versus CPP (right) in CPP and SCPP organoids (n = 3 independent replicates). Data are shown as mean ± s.d.; NS, not significant; P values were calculated by two-sided t-tests.
Fig. 7 ∣
Fig. 7 ∣. SOX2 directly binds to and activates ERVs in SOX2-overexpressing human cancer cell lines.
a, Ratio of SOX2-bound genes containing intronic ERVs and 3′ UTR ERVs in human ESCC cell lines TE10 and TT. ****P < 0.0001 calculated by two-sided Fisher exact test (TE10 and TT genomic background as control). b, Venn diagrams illustrate the overlap of KLF5- and SOX2-activated ERVs (expression downregulated upon shRNA-mediated knockdown) in human ESCC cell lines TT and KYSE70. P < 0.0001 calculated by two-sided Fisher exact test (TT and KYSE70 shKLF5 unchanged ERVs as control). c, Quantification of the ERV-4736, ERV-2101 and ERV-1379 mRNA expression (RNA-seq) after silencing SOX2 or KLF5 in TT and KYSE70 cell lines (n = 2 independent biological replicates). d, Representative SOX2, KLF5 and H3K27ac ChIP–seq tracks, showing SOX2/KLF5 binding and H3K27ac mark at multiple human ERV loci in human ESCC cell lines TT, KYSE70 and TE10. e, An illustrative diagram shows the epigenetic programs modulated by SOX2 overexpression in ESCC.

References

    1. Bass AJ et al. SOX2 is an amplified lineage-survival oncogene in lung and esophageal squamous cell carcinomas. Nat. Genet 41, 1238–1242 (2009). - PMC - PubMed
    1. Campbell JD et al. Distinct patterns of somatic genome alterations in lung adenocarcinomas and squamous cell carcinomas. Nat. Genet 48, 607–616 (2016). - PMC - PubMed
    1. Taylor AM et al. Genomic and functional approaches to understanding cancer aneuploidy. Cancer Cell 33, 676–689 e3 (2018). - PMC - PubMed
    1. Campbell JD et al. Genomic, pathway network, and immunologic features distinguishing squamous carcinomas. Cell Rep. 23, 194–212 e6 (2018). - PMC - PubMed
    1. Dotto GP & Rustgi AK Squamous cell cancers: a unified perspective on biology and genetics. Cancer Cell 29, 622–637 (2016). - PMC - PubMed

Publication types

MeSH terms

LinkOut - more resources