. 2021 Jun;53(6):809-816.
doi: 10.1038/s41588-021-00862-7. Epub 2021 May 10.

Ultrafast Sample placement on Existing tRees (UShER) enables real-time phylogenetics for the SARS-CoV-2 pandemic

Affiliations

Ultrafast Sample placement on Existing tRees (UShER) enables real-time phylogenetics for the SARS-CoV-2 pandemic

Yatish Turakhia et al. Nat Genet. 2021 Jun.

Abstract

As the SARS-CoV-2 virus spreads through human populations, the unprecedented accumulation of viral genome sequences is ushering in a new era of 'genomic contact tracing'-that is, using viral genomes to trace local transmission dynamics. However, because the viral phylogeny is already so large-and will undoubtedly grow many fold-placing new sequences onto the tree has emerged as a barrier to real-time genomic contact tracing. Here, we resolve this challenge by building an efficient tree-based data structure encoding the inferred evolutionary history of the virus. We demonstrate that our approach greatly improves the speed of phylogenetic placement of new samples and data visualization, making it possible to complete the placements under the constraints of real-time contact tracing. Thus, our method addresses an important need for maintaining a fully updated reference phylogeny. We make these tools available to the research community through the University of California Santa Cruz SARS-CoV-2 Genome Browser to enable rapid cross-referencing of information in new virus sequences with an ever-expanding array of molecular and structural biology data. The methods described here will empower research and genomic contact tracing for SARS-CoV-2 specifically for laboratories worldwide.


Figures

Extended Data Fig. 1 |
Extended Data Fig. 1 |. UShER is similarly robust to masked sites and nucleotide errors as IQ-TREE2 and FastTree 2.
We pruned 5 independent clades of roughly 1,000 lineages each and applied the same methods as in Fig. 2, masking 2.5, 5, 7.5, 10, 20…50 percent of sites (top, note that the X-axis does not use a linear scale), adding 10, 20…100 independently drawn random nucleotide substitutions across the lineages to be placed (center), and adding one error to 1, 2…10 of the genomes of interest (bottom). We then used UShER (blue), IQ-TREE 2 (orange), and FastTree 2 (purple) to reconstruct these clades. We determined the Robinson-Foulds distance of each to the original clade using TreeCmp, as well as the distance of randomly constructed trees to the far right (black, labeled ‘Null’) as a null model comparison. N = 5 independent replicates for each experiment. Each boxplot is centered on the median of the data and extends to the first and third quartiles, with whiskers extending to the minimum and maximum of the data set.
Extended Data Fig. 2 |
Extended Data Fig. 2 |. Addition of two perfectly correlated errors significantly reduces UShER accuracy.
As in Fig. 2, the Robinson-Foulds distances, proportion of sister nodes identical to the reference tree, distance from true placement and equally parsimonious placements, respecitvely, are shown for UShER experiments in placing 10 lineages, with two perfectly correlated errors added to 1, 2 … 10 of the lineages to be placed. To the far right in the left-most panel, labeled ‘Null’, the distribution of scores across 100 replicates in which 10 lineages were added randomly to the phylogeny is shown as a null model for comparison. N = 100 independent replicates for each experiment. The whiskers in the boxplot on the left are centered on the median of the data and extend to the first and third quartiles. In the error bars panel (second from the left), the data points are centered on the mean of the data and extend to the bounds of the 95% confidence interval, calculated by 1,000 iterations of bootstrapping.
Extended Data Fig. 3 |
Extended Data Fig. 3 |. UShER can output multiple trees to accommodate phylogenetic uncertainty.
(A): Composite of 239 trees with 424 samples, representing all possible parsimony-optimal placements of two samples on a starting tree having 422 samples, computed using DensiTree and plotted using the phangorn package (https://cran.r-project.org/web/packages/phangorn). All trees were scaled to be the same height. (B): Two of the trees from (A) compared in a tanglegram, colored according to COG-UK lineage assignments, with linker lines shown only for the two placed samples whose placements differ between topologies. As in Fig. 4, both trees in this tanglegram are ultrametric and branch lengths are arbitrary.
Extended Data Fig. 4 |
Extended Data Fig. 4 |. UCSC Genome Browser display of subtree where hypothetical example sequences have been placed by UShER.
Newly added samples are highlighted in blue and the tree displaying their relationships and placement on the global tree is shown to the left. Interactive view: https://genome.ucsc.edu/s/AngieHinrichs/UShER_example.
Extended Data Fig. 5 |
Extended Data Fig. 5 |. Nextstrain/Auspice view of subtree created by UShER placing the same hypothetical example samples.
As in Extended Data Fig. 4. Direct link: https://nextstrain.org/fetch/hgwdev.gi.ucsc.edu/~angie/usher_example.json.
Extended Data Fig. 6 |
Extended Data Fig. 6 |. A demonstration of our distance metric for placements.
To evaluate the accuracy of each placement in a new phylogeny, we compute the distance for each newly placed sample in the UShER tree (Tree 1) with the reference tree (Tree 2). The clade sets in the two trees are shown for each N1 and N2 value, representing the number of generations from the Sample D in Tree 1 and Tree 2, respectively. We compute the values of N1+N2–2 such that the descendant clades for both trees are identical. In case of newly placed Sample D, clades are identical when N1=2 and N2=2 and when N1=3 and N2=3, which are highlighted in bold. Hence the distance (smallest N1+N2–2) from the true placement is equal to 2.
Fig. 1 |
Fig. 1 |. Overview of UShER’s placement algorithm and data object.
a, Prior methods rely on a full MSA to inform phylogenetic structure (left), while UShER uses a mutation-annotated tree (right). The MSA shown is color-coded to match the mutations present in the tree above (A, red; C, yellow; G, purple; U, blue). b, UShER evaluations of the parsimony score for placing the sample S5 (blue) at each possible position (Methods) of our example phylogeny (shown in a). We considered the branch leading to a given node to be the parent branch. The branches that need to be modified or added to the phylogeny to accommodate S5 are shown in blue; back mutations (if present) are colored red and new nodes are circled. For example, if S5 is placed at S1, the new node 3 has children S1 and S5 and two back mutations (U4C and A6G) occur at the branch leading to S5, giving this placement a parsimony score of 2. Placing S5 at node 1 is optimal by parsimony. c, The final tree with S5 added, where an additional internal node 3 is added to support S5 (left); the mutation annotations for the final tree with S5 colored in blue are shown on the right. Note that the memory efficiency of the mutation-annotated tree can vary depending on the dataset. In all panels, the length of each branch is proportional to the number of mutations that occurred on that branch. Zero-length branches, which are not associated with any mutations (for example, those leading to node 3 in ‘at root’, ‘at S1’, ‘at S2’, ‘at S3’ and ‘at S4’ in b) are shown as very short branches for visibility.
Fig. 2 |
Fig. 2 |. The maximum parsimony algorithm used by UShER is robust to moderate rates of missing data and simulated errors in SARS-CoV-2 genomes.
Top: We independently masked sites at 10, 20, 30, 40 and 50 percent of sites for each of 10 simulated genomes to be added to the phylogeny and computed the Robinson–Foulds distance, the average number of lineages added that had identical sister node sets to those in the simulated reference tree, the distance from true placement for each lineage added (Methods) and the number of equally parsimonious sites per placement for each lineage added. Middle: We introduced random nucleotide substitutions to the genomes of the 10 lineages added to the tree by UShER at a rate of 1, 2, … 10 sites per genome, drawn independently, and computed the same measures of coherence to the reference tree, with the error bars representing the 95% confidence intervals. Bottom: We introduced one systematic error to 1, 2, … 10 of the genomes added to the tree by UShER and computed the same metrics as above. For each experiment, the distance from true placement was strongly correlated with the amount of missing data (P < 3.34 × 10−112 for all experiments; Spearman rank correlation test with 5,998, 10,998 and 10,998 d.f. for the masking, random error and systematic error experiments, respectively). For each panel depicting Robinson–Foulds scores, the distribution of scores across 100 replicates where 10 lineages were added randomly to the phylogeny is shown to the far right for a null model comparison and is labeled ‘Null’. n = 100 replicates for each experiment. Each box plot is centered on the median of the data and extends to the first and third quartiles, with the lower whiskers extending to the lowest data point within the first quartile minus 1.5 times the interquartile range and the upper whiskers extending to the highest data point within the third quartile plus 1.5 times the interquartile range. In the error bar panels (second from the left), the data points are centered on the mean of the data and extend to the bounds of the 95% confidence interval, calculated by 1,000 iterations of bootstrapping.
Fig. 3 |
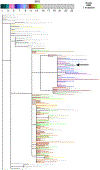
Fig. 3 |. The BPS statistic for a single sample across the global SARS-CoV-2 phylogeny.
The correct sample placement, which corresponds to the maximally parsimonious placement, is shown by the arrow and each branch is colored by the BPS for that sample on that branch. The phylogeny shown has been randomly subsampled to include only 250 samples for clarity of presentation. Branch lengths are measured in substitutions per genome. For the purposes of generating this illustrative figure, we placed only a single randomly selected sample (n = 1).
Fig. 4 |
Fig. 4 |. UShER is accurate using real data.
ac, Robinson–Foulds distance between 100 reference and UShER-generated trees produced by removing and re-adding 10 samples in each (a), distance from the reference placement for each of 1,000 placed samples (b) and number of equally parsimonious placements for each of the 1,000 placed samples (c) are shown. dg, Comparisons of subsets of the global phylogeny released on 11 July 2020 with reconstruction of this phylogeny using UShER. In each case, we pruned lineages colored in red from the phylogeny and added them back using UShER. UShER accurately placed randomly selected subtrees containing lineages collected in the western United States in March and April (d) and in Europe in March (e), as well as more distantly related lineages whose times and places of collection differed more widely (f,g). d, Differences in tree topology are highlighted in bold. eg, Other topologies are identical. All trees in this figure are ultrametric and branch lengths are arbitrary.

Update of

References

    1. Lam TT-Y et al. Identifying SARS-CoV-2-related coronaviruses in Malayan pangolins. Nature 583, 282–285 (2020). - PubMed
    1. Andersen KG, Rambaut A, Lipkin WI, Holmes EC & Garry RF The proximal origin of SARS-CoV-2. Nat. Med 26, 450–452 (2020). - PMC - PubMed
    1. Zhou P et al. A pneumonia outbreak associated with a new coronavirus of probable bat origin. Nature 579, 270–273 (2020). - PMC - PubMed
    1. Shu Y & McCauley J GISAID: global initiative on sharing all influenza data—from vision to reality. Euro Surveill. 22, 30494 (2017). - PMC - PubMed
    1. Stefanelli P et al. Whole genome and phylogenetic analysis of two SARS-CoV-2 strains isolated in Italy in January and February 2020: additional clues on multiple introductions and further circulation in Europe. Euro Surveill. 25, 2000305 (2020). - PMC - PubMed

Publication types