. 2021 Sep;17(9):954-963.
doi: 10.1038/s41589-021-00786-7. Epub 2021 May 10.

Sulfopin is a covalent inhibitor of Pin1 that blocks Myc-driven tumors in vivo

Affiliations

Sulfopin is a covalent inhibitor of Pin1 that blocks Myc-driven tumors in vivo

Christian Dubiella et al. Nat Chem Biol. 2021 Sep.

Abstract

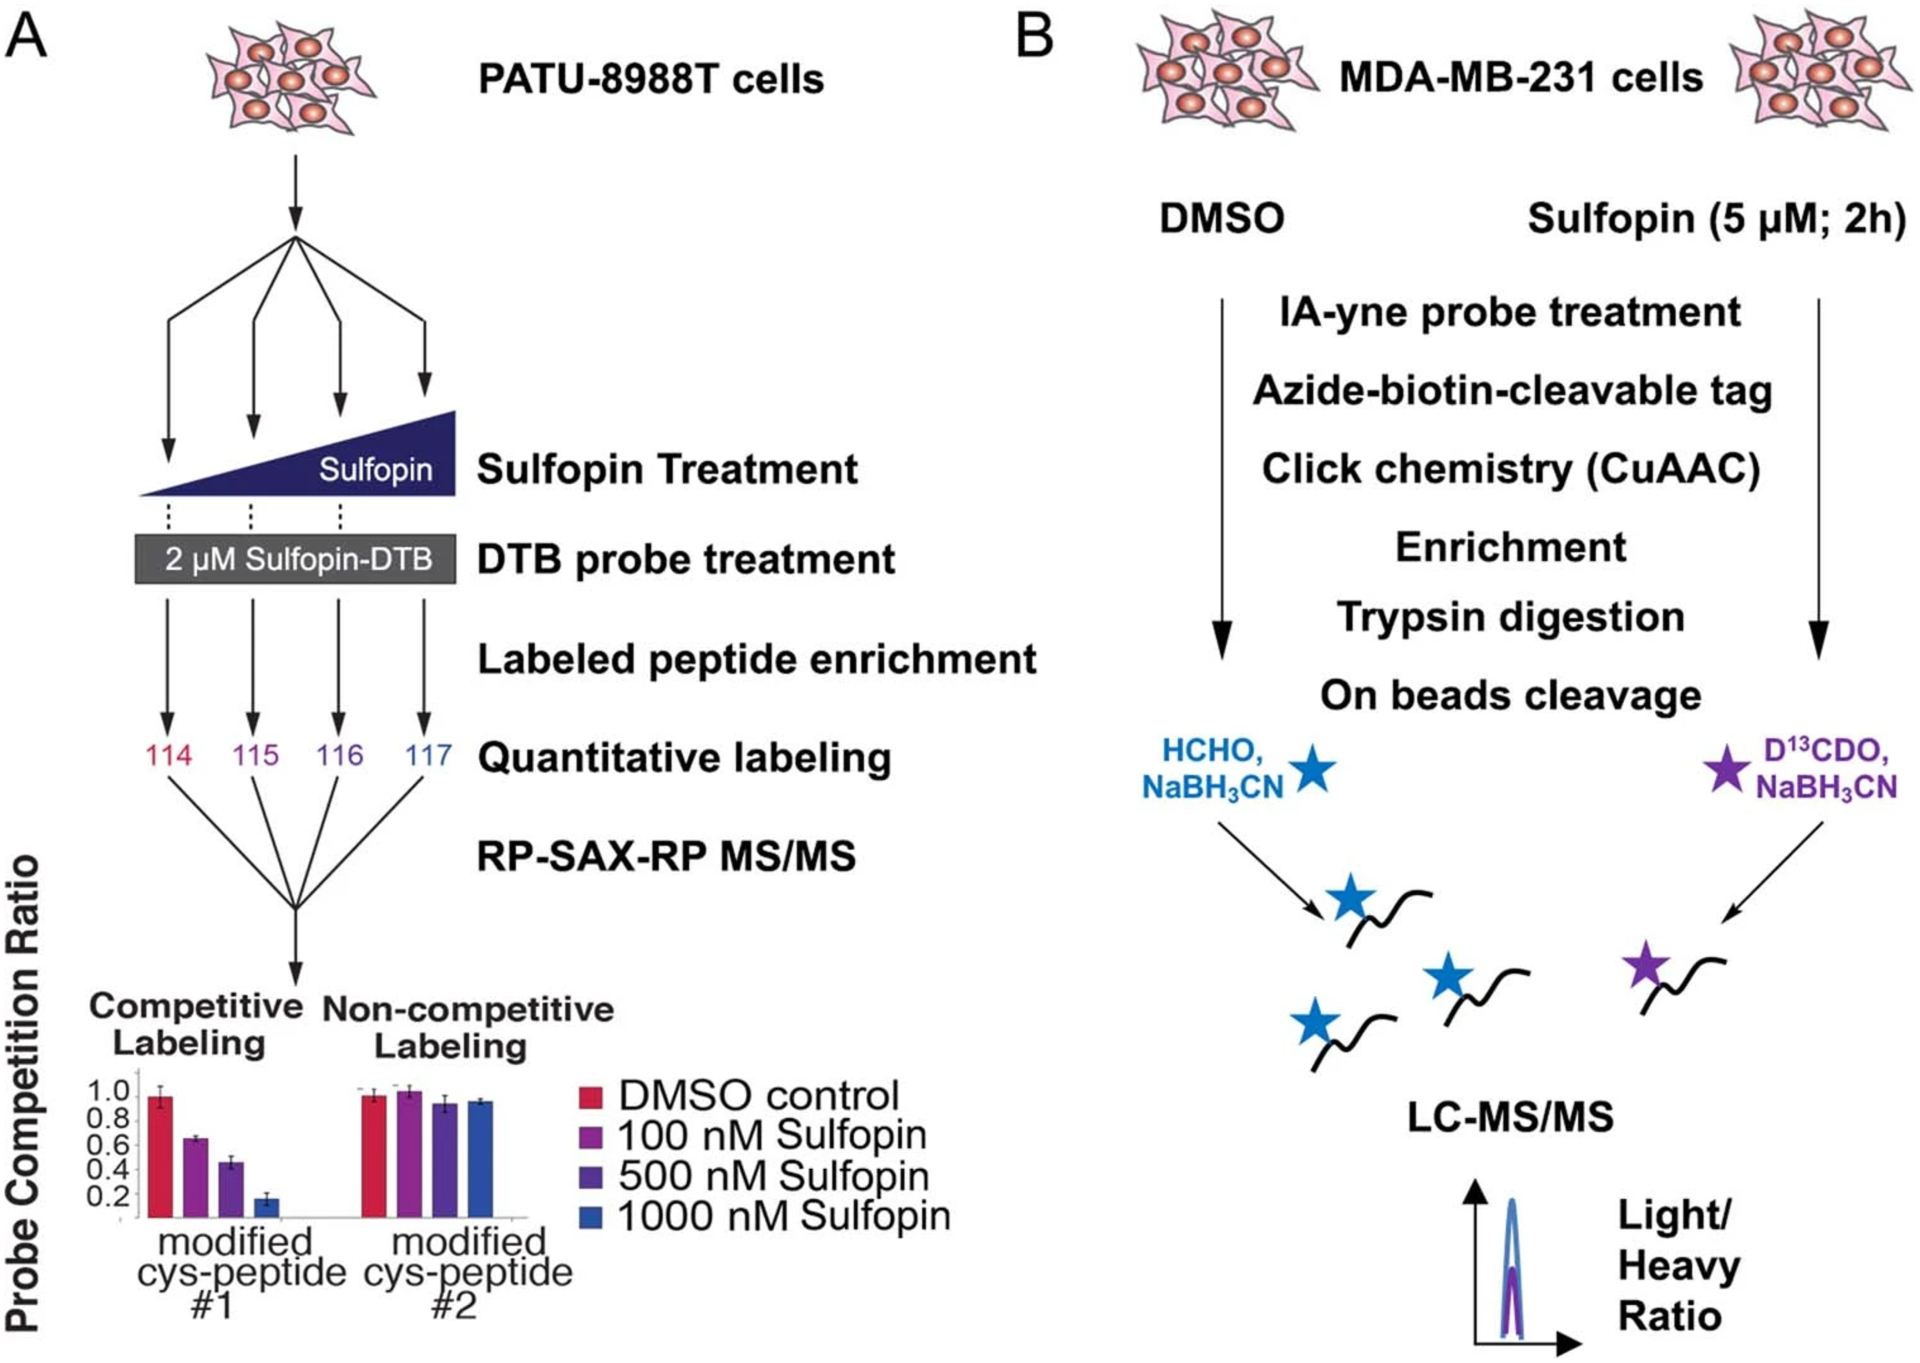
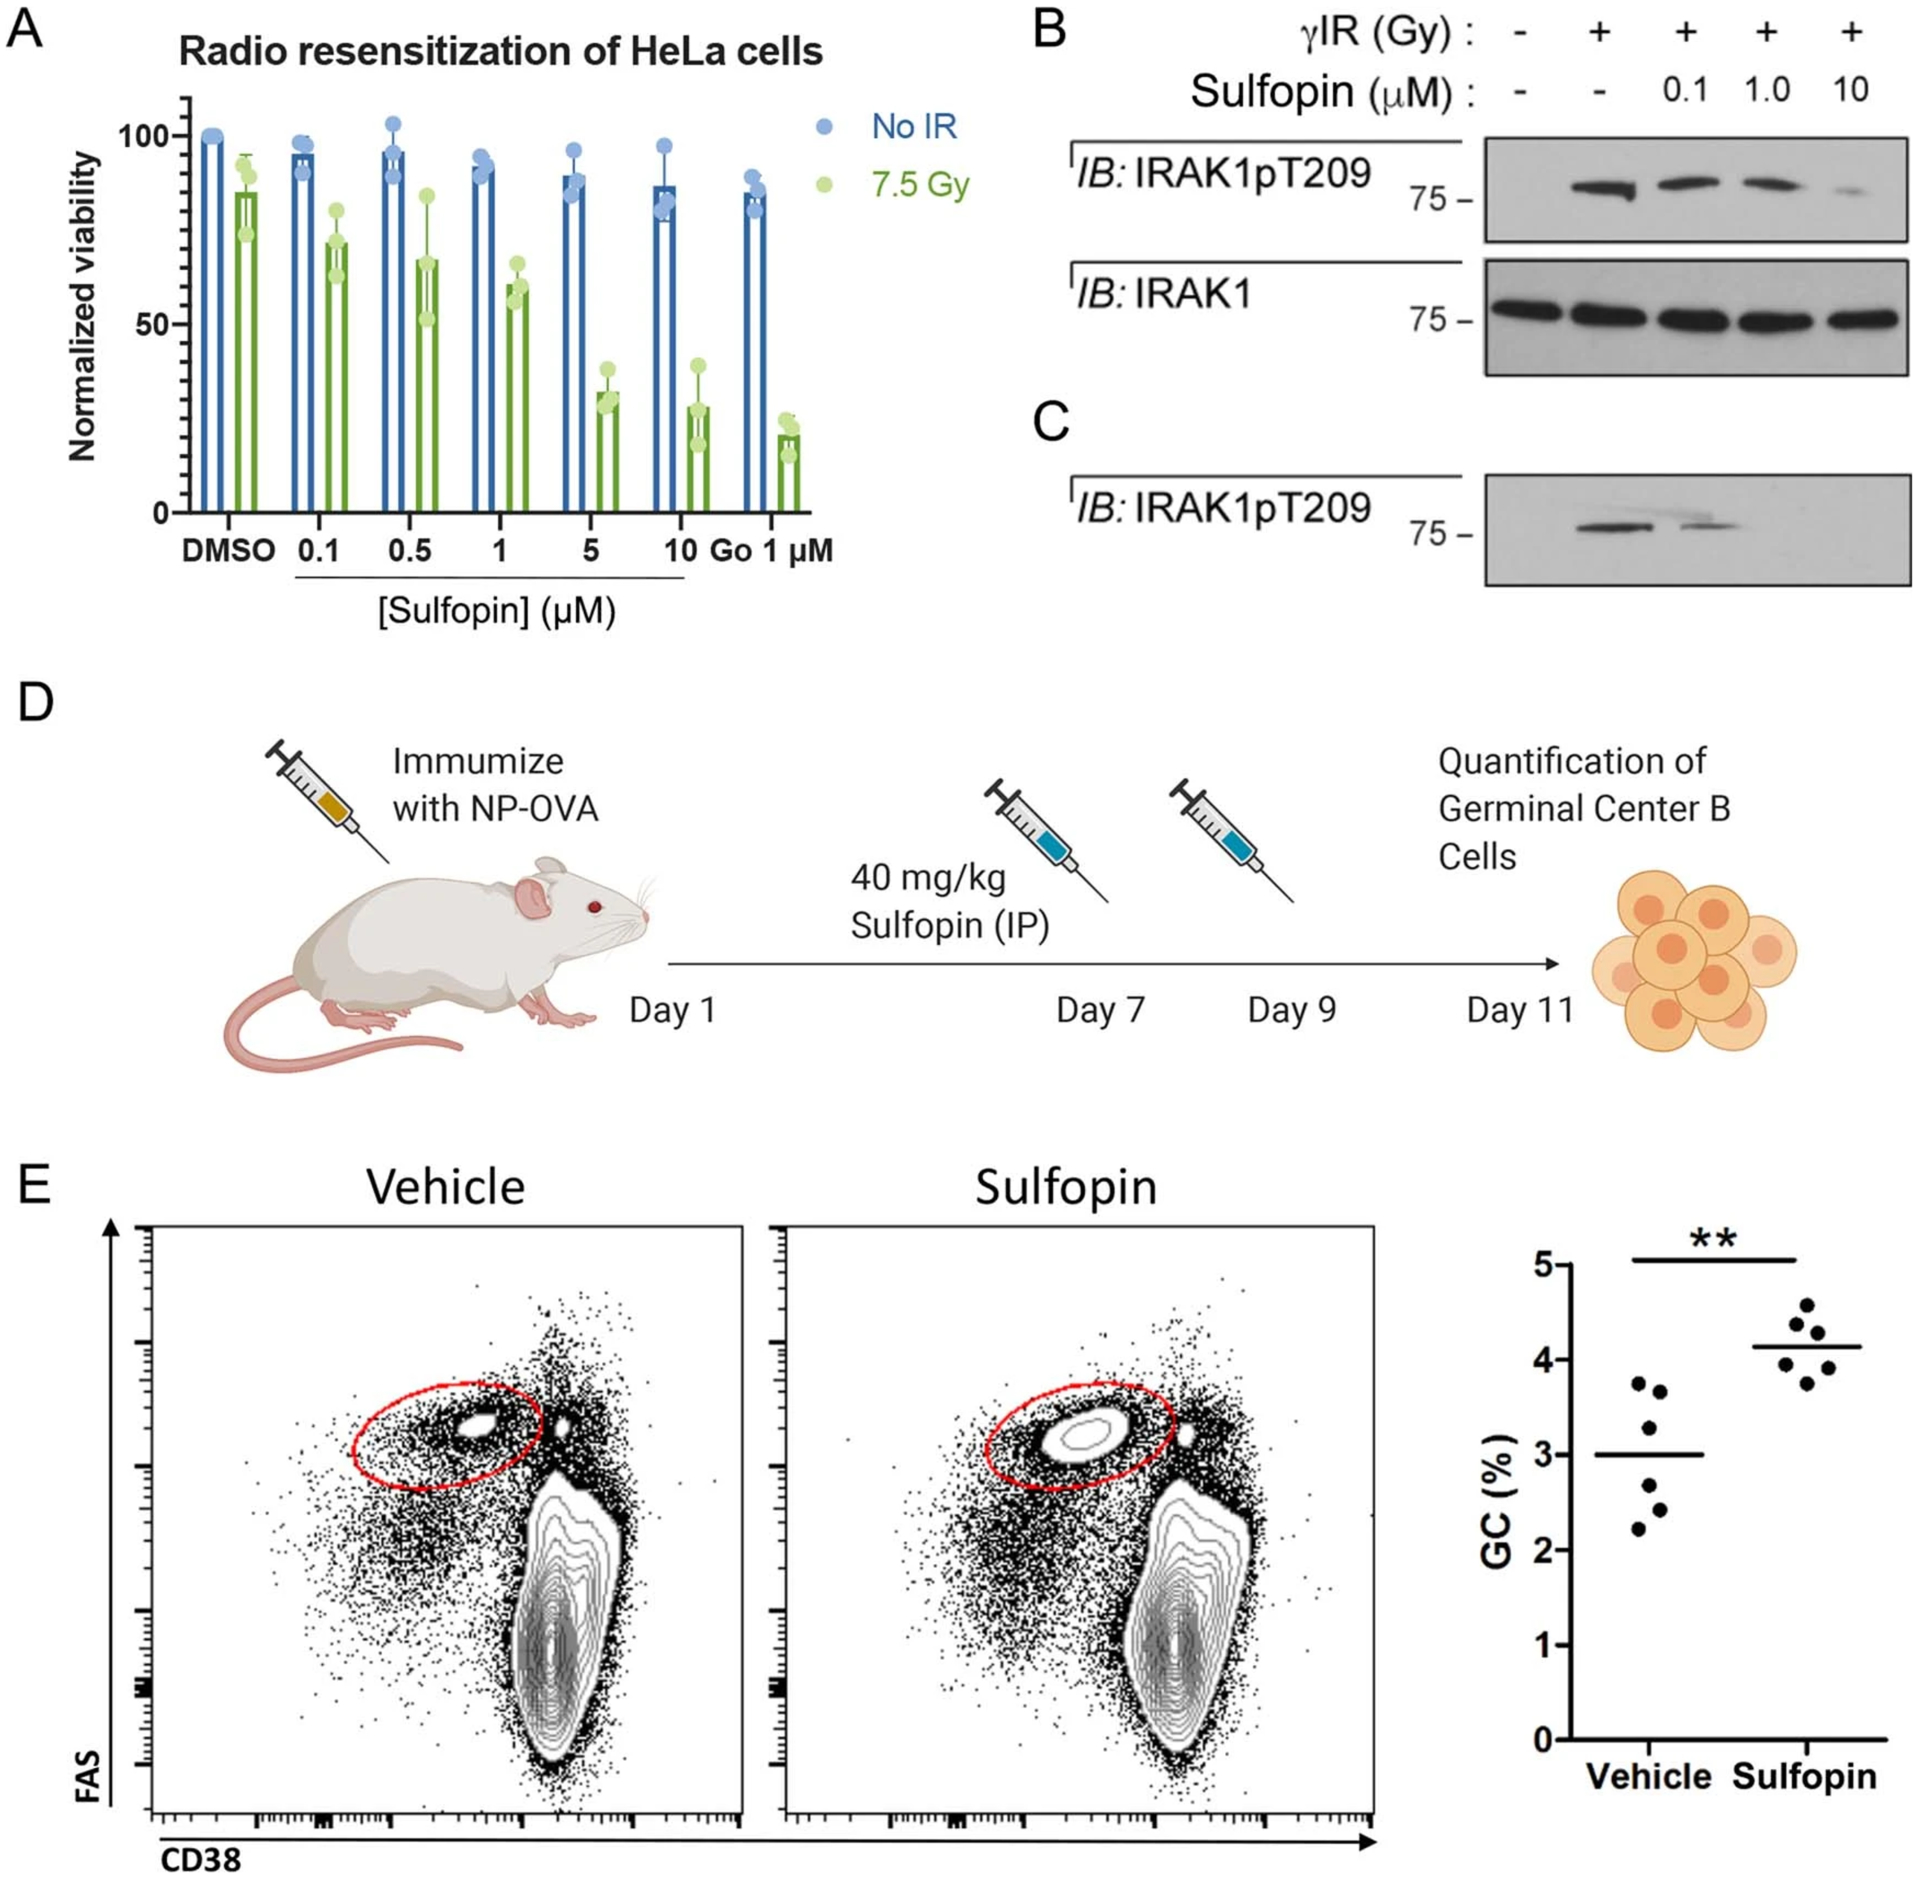
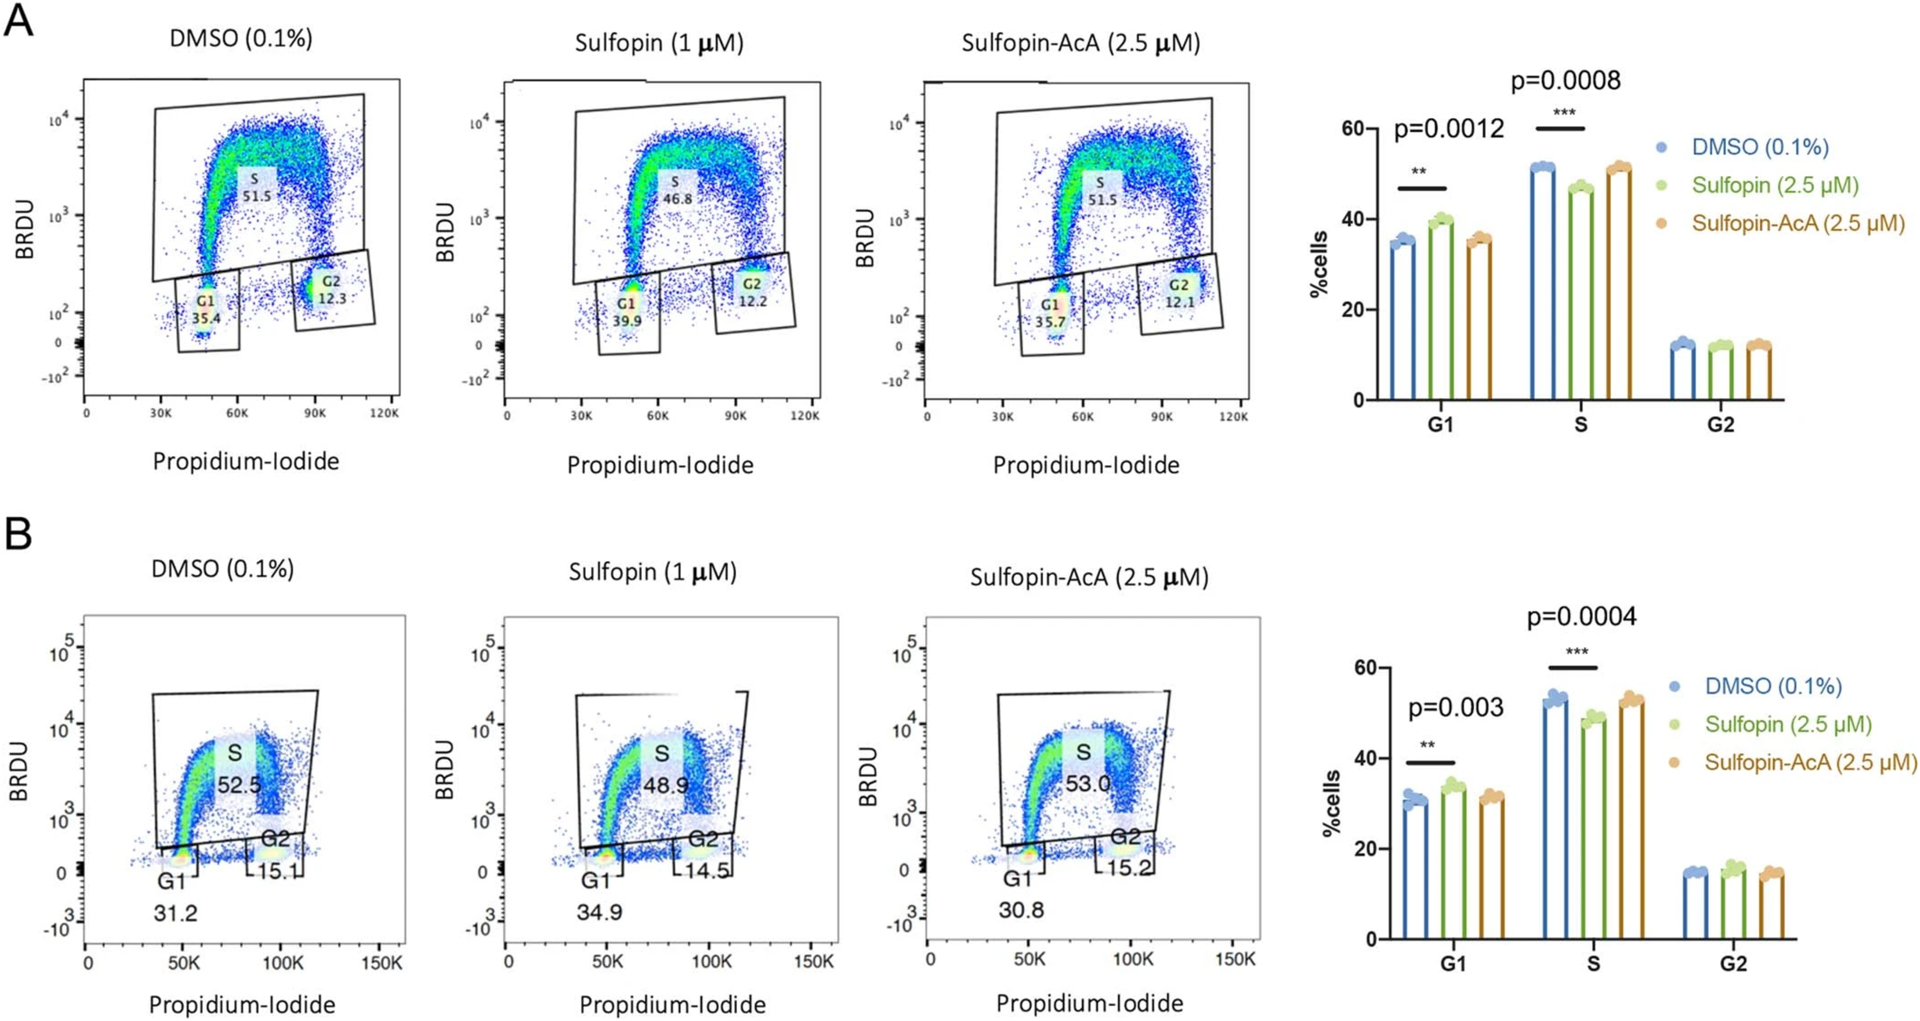
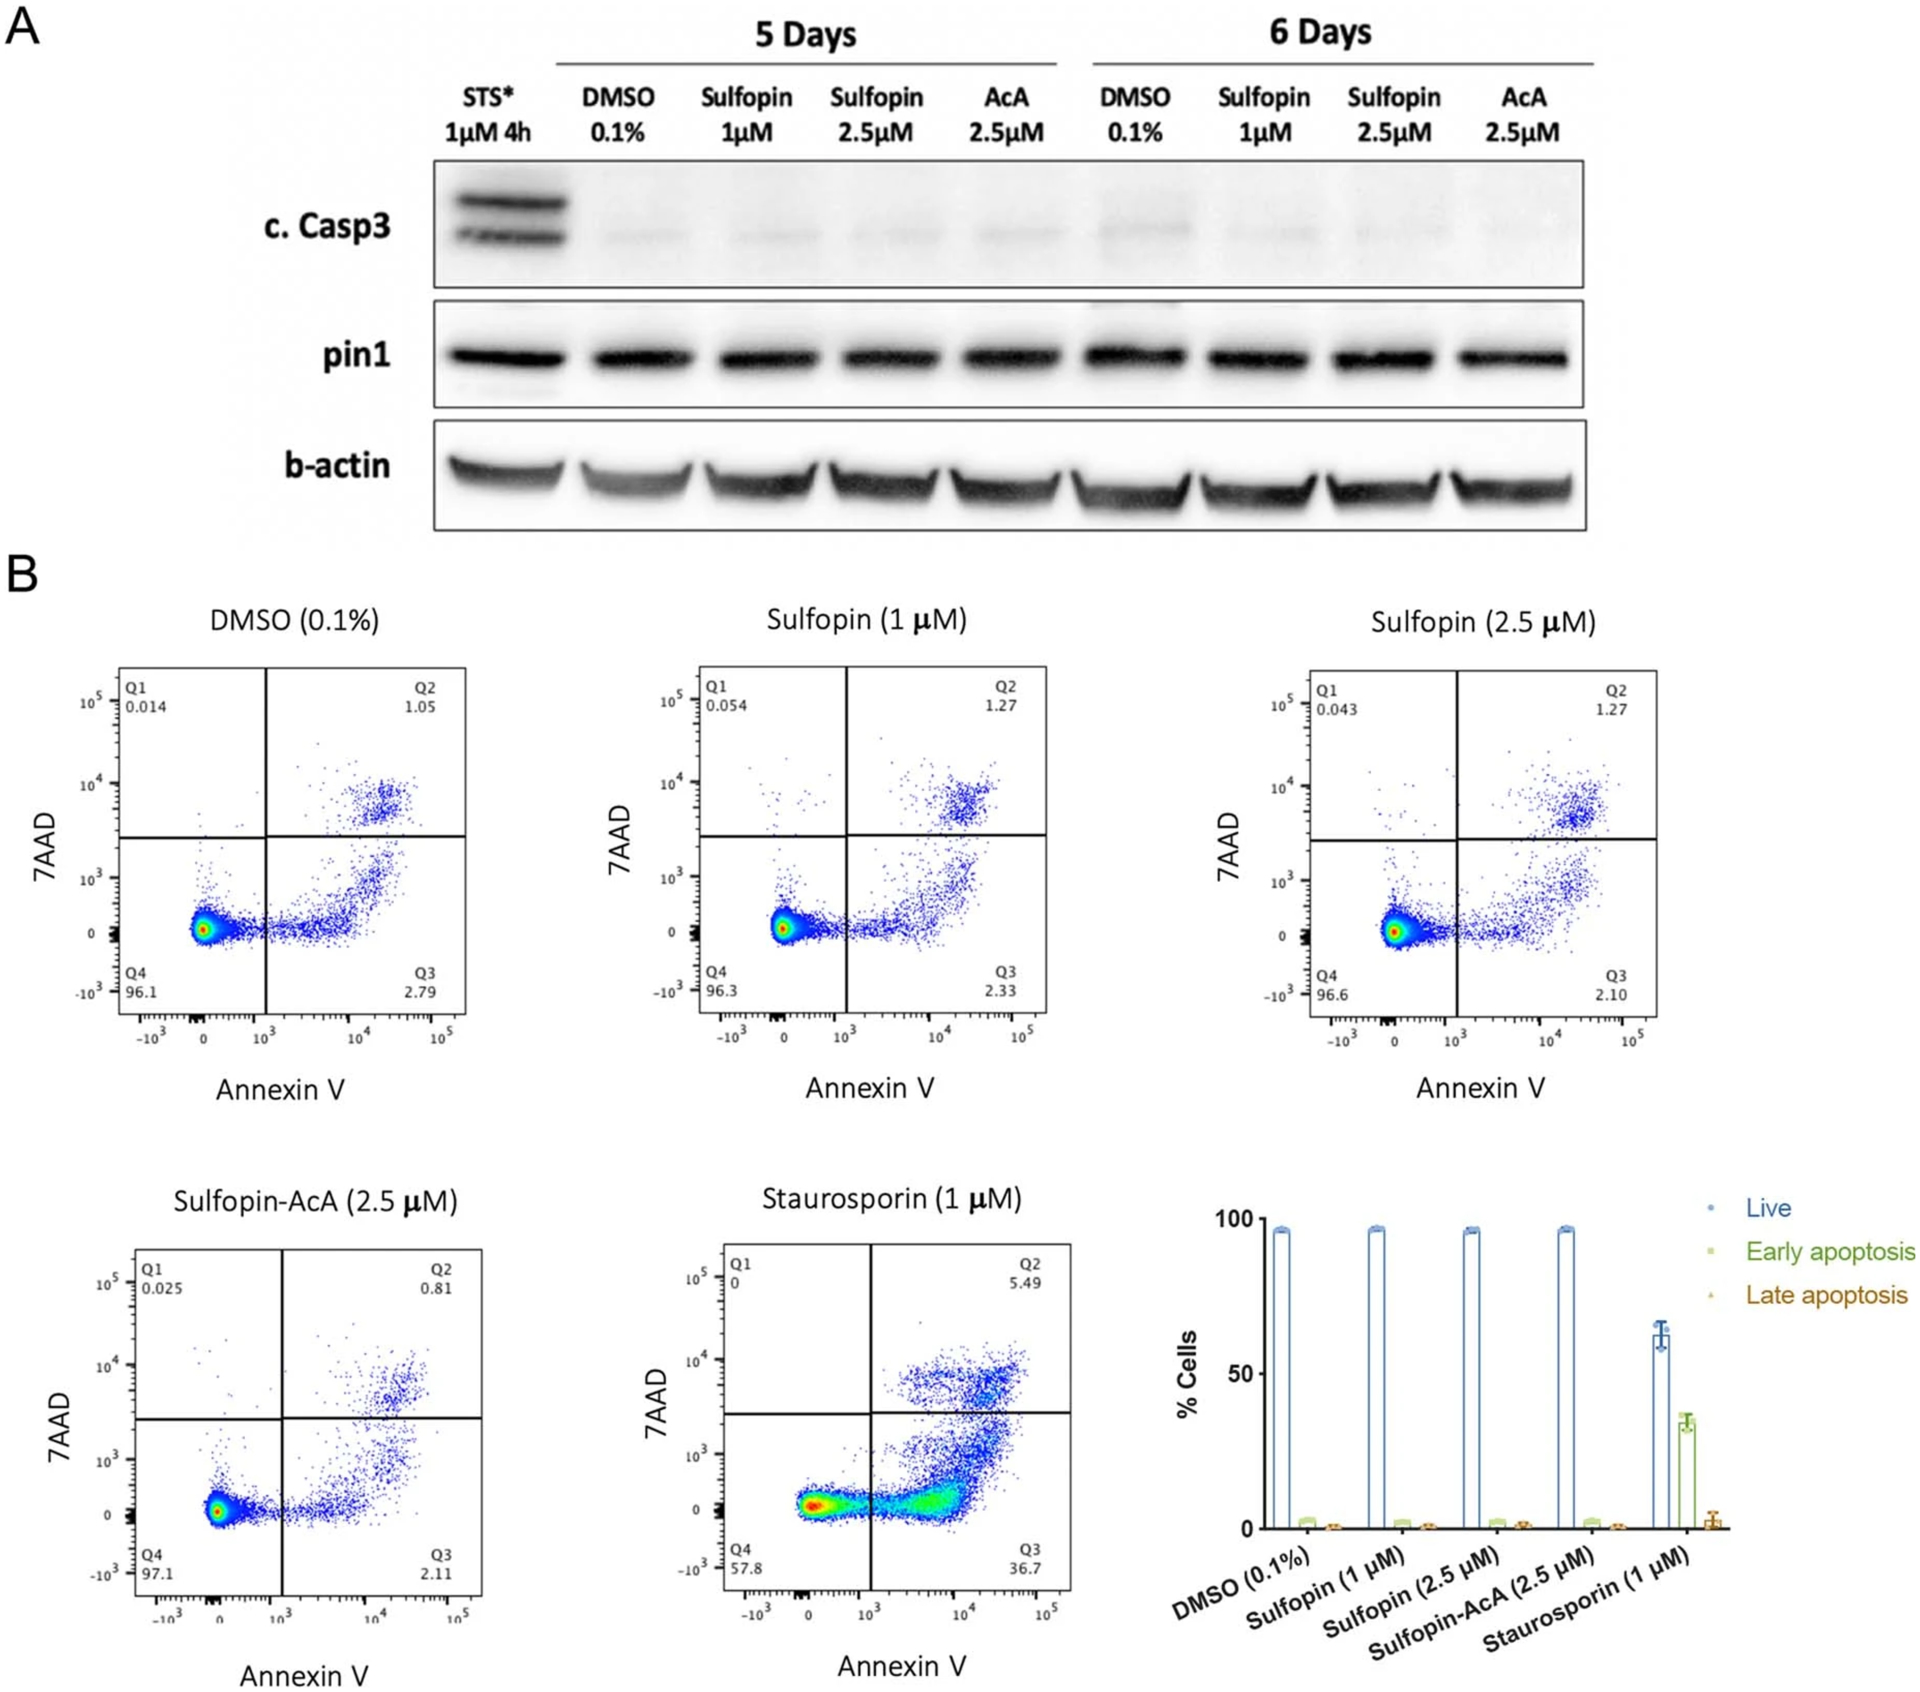
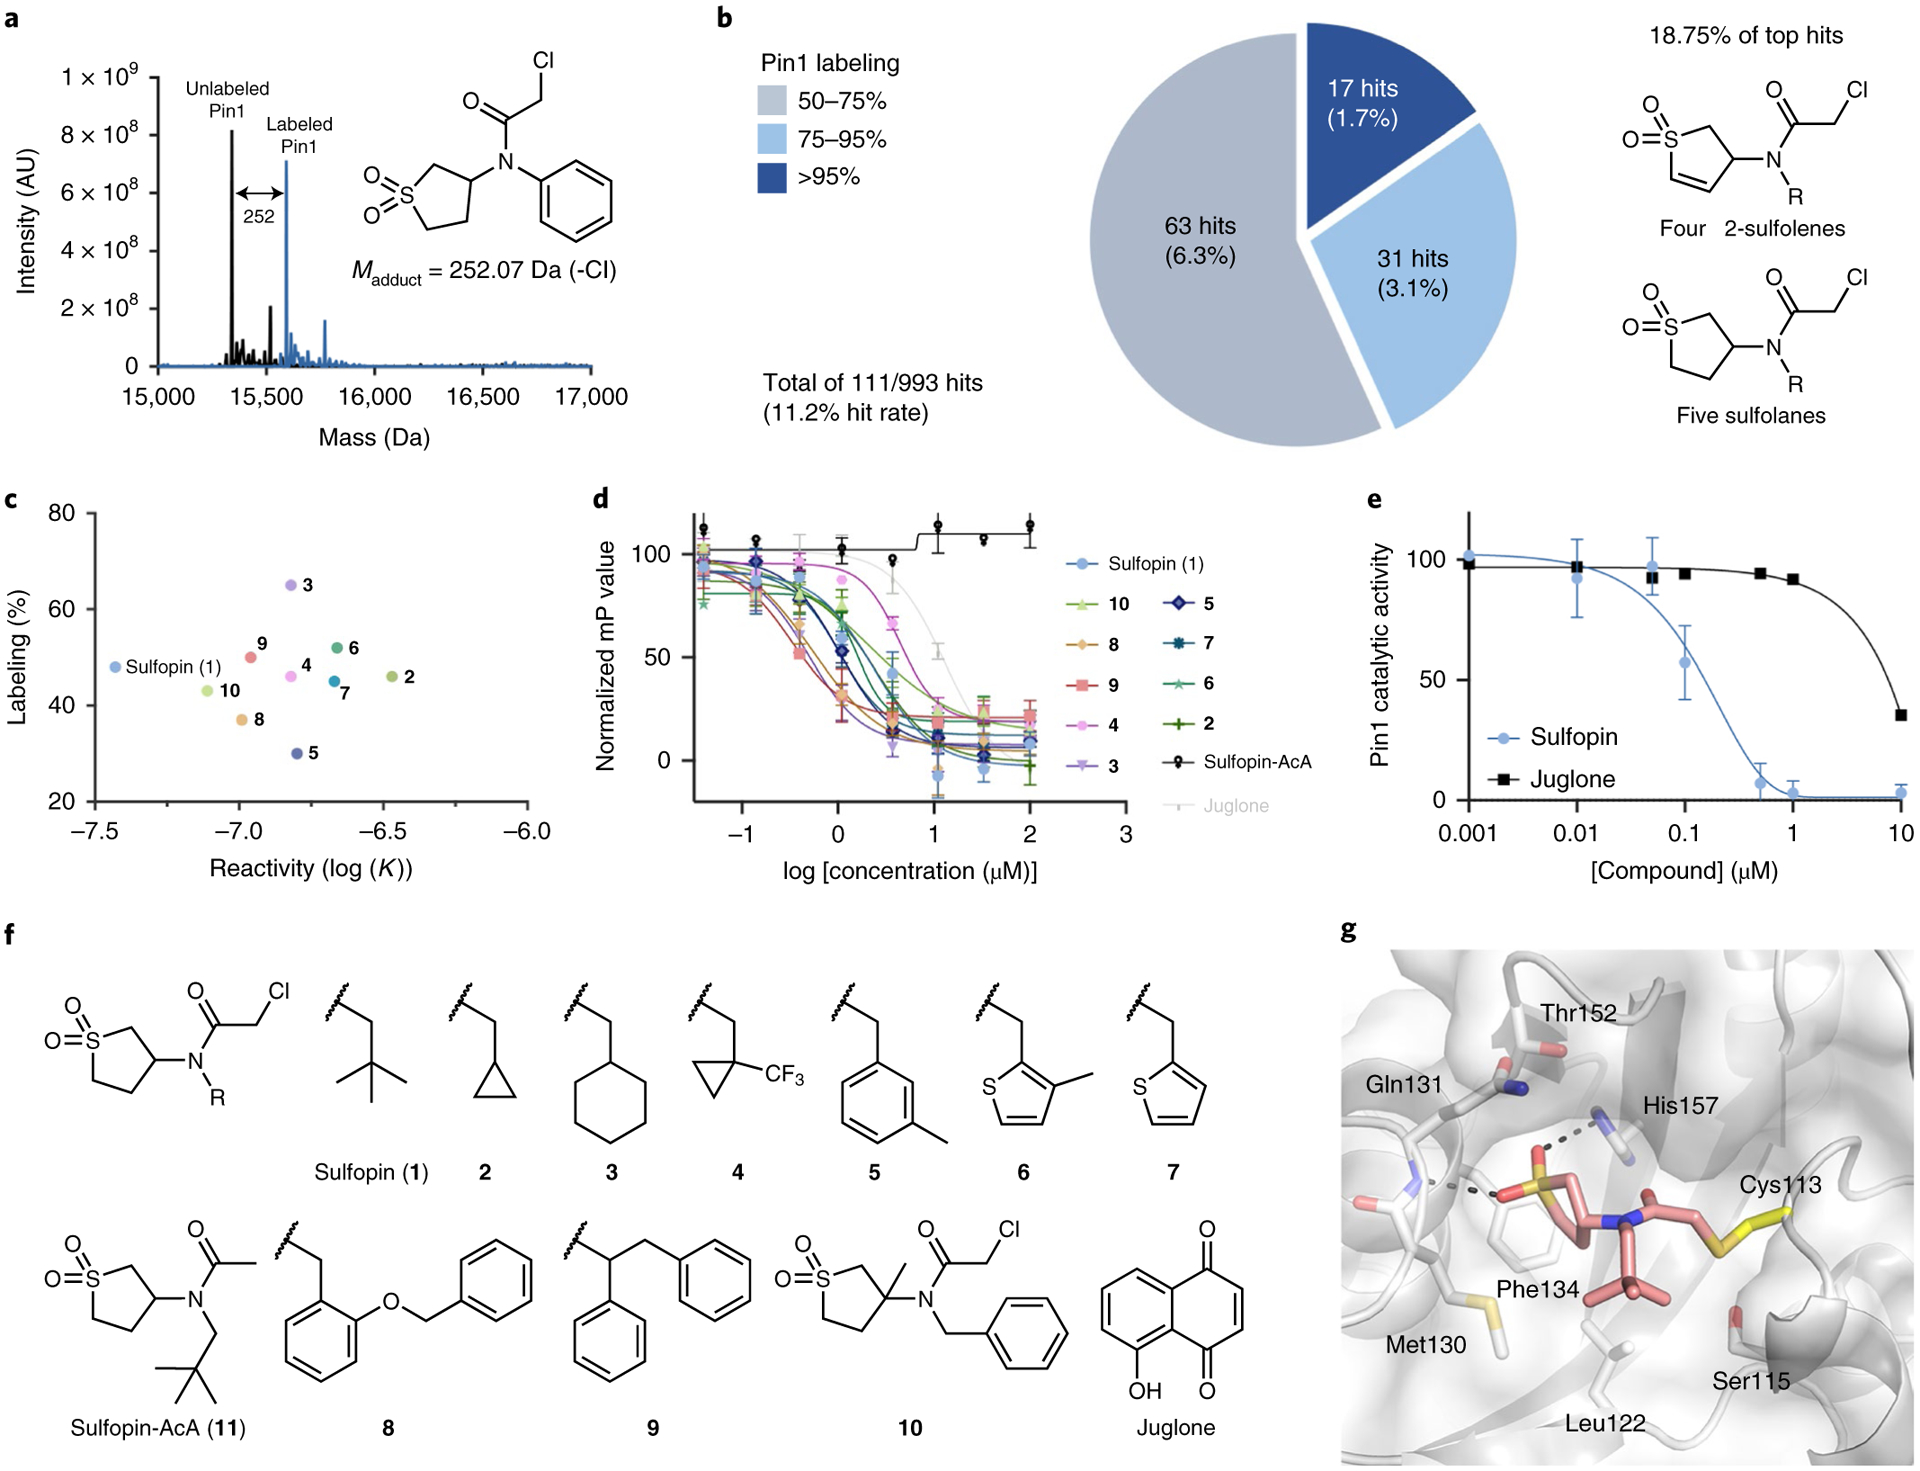
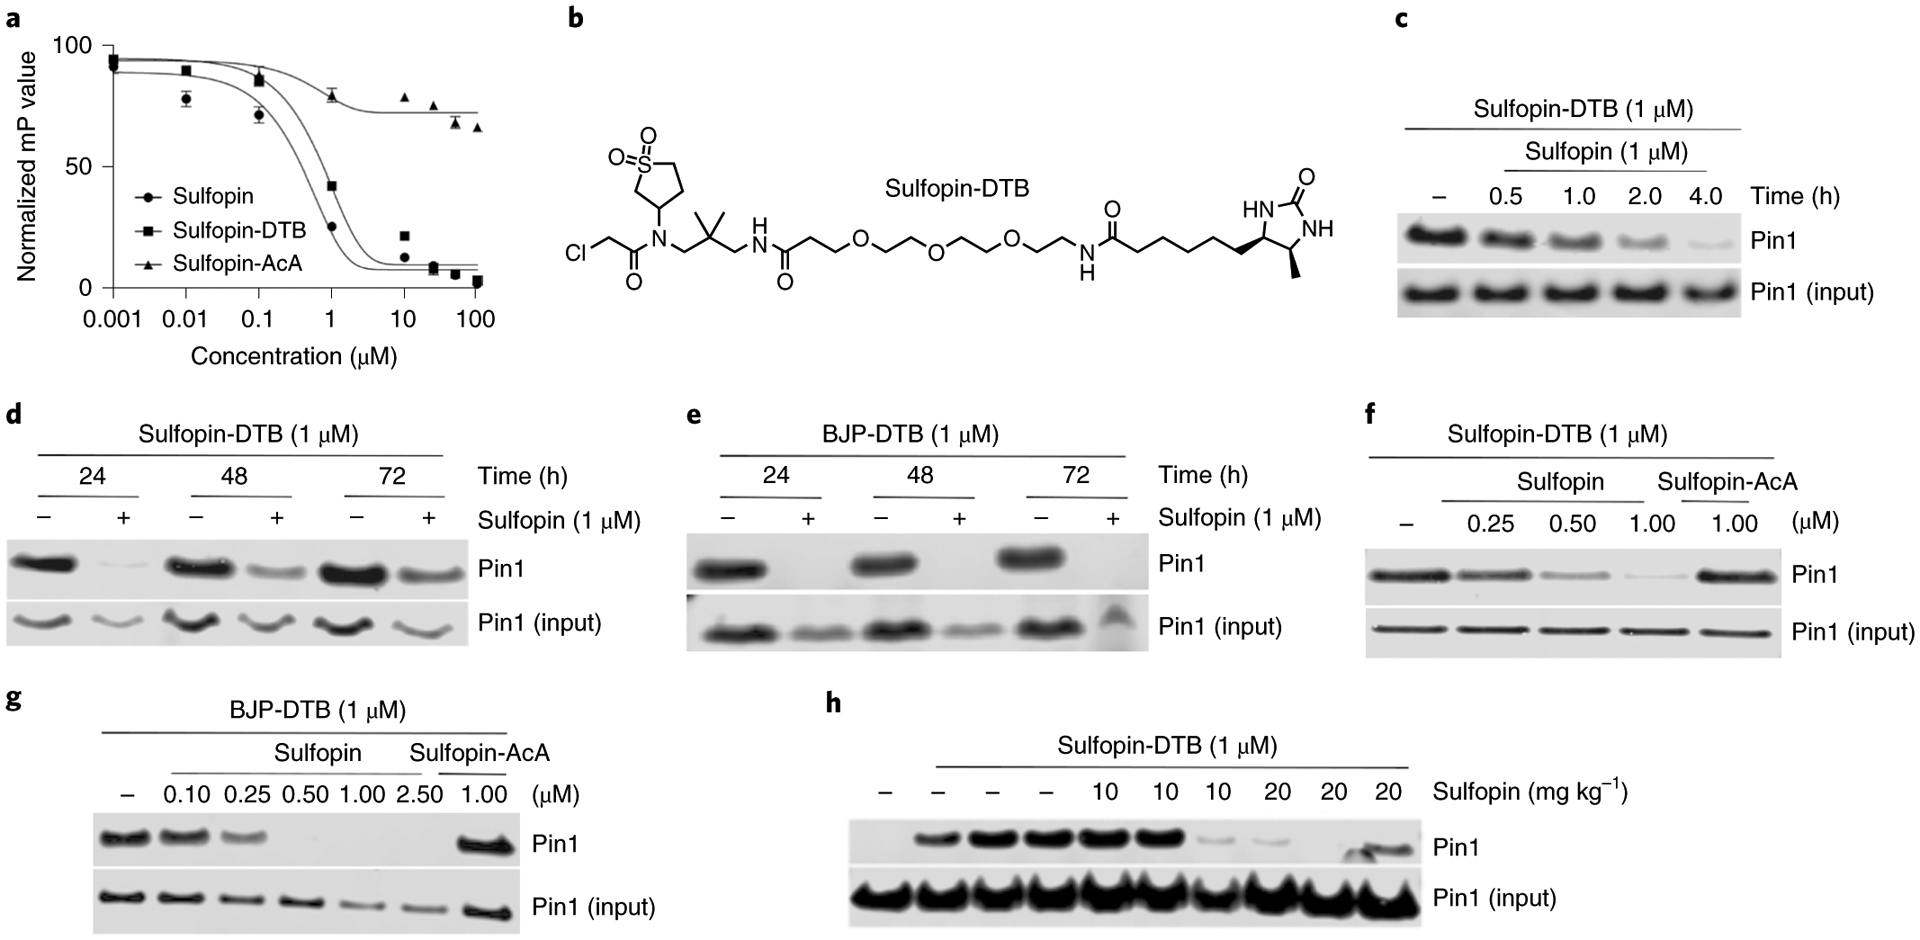
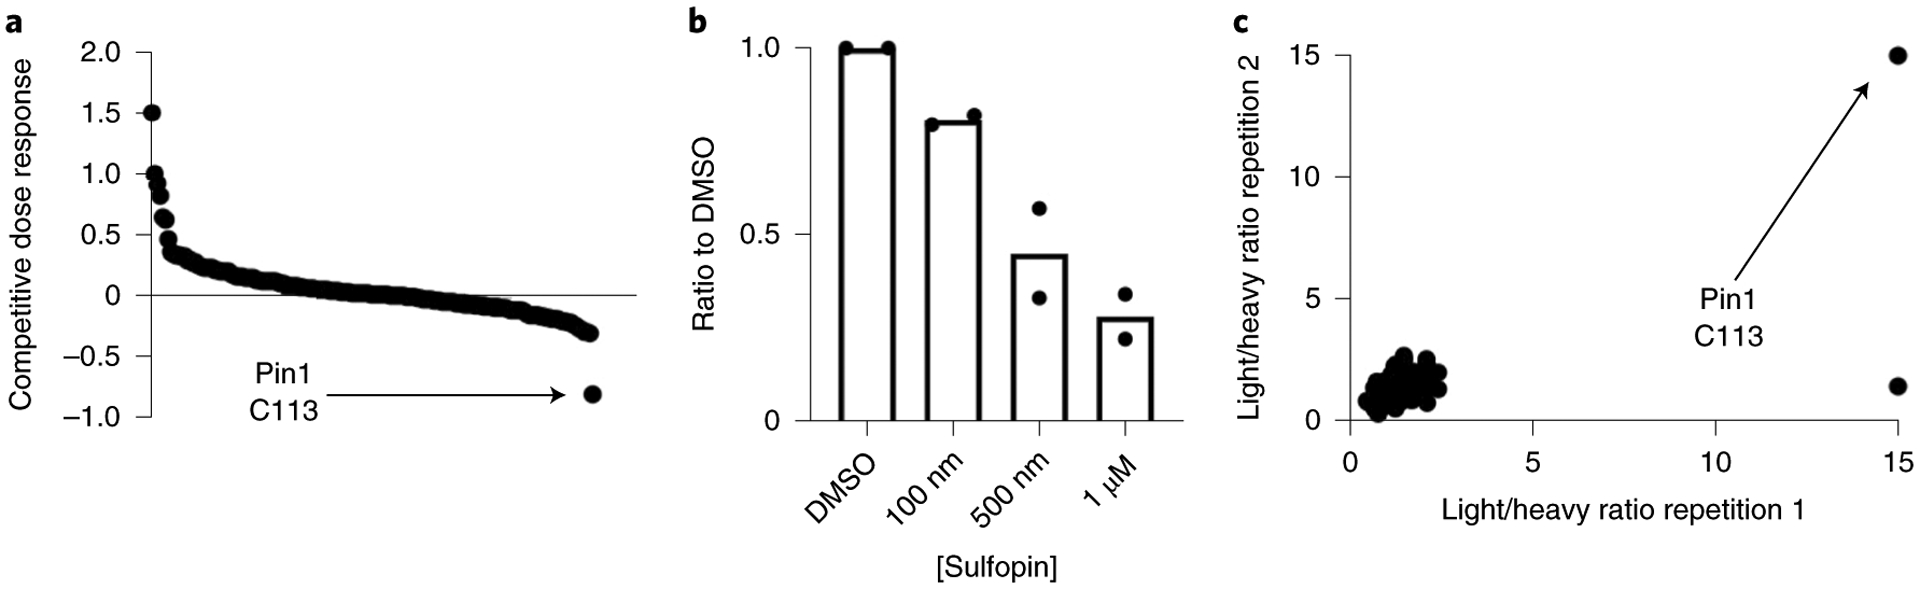
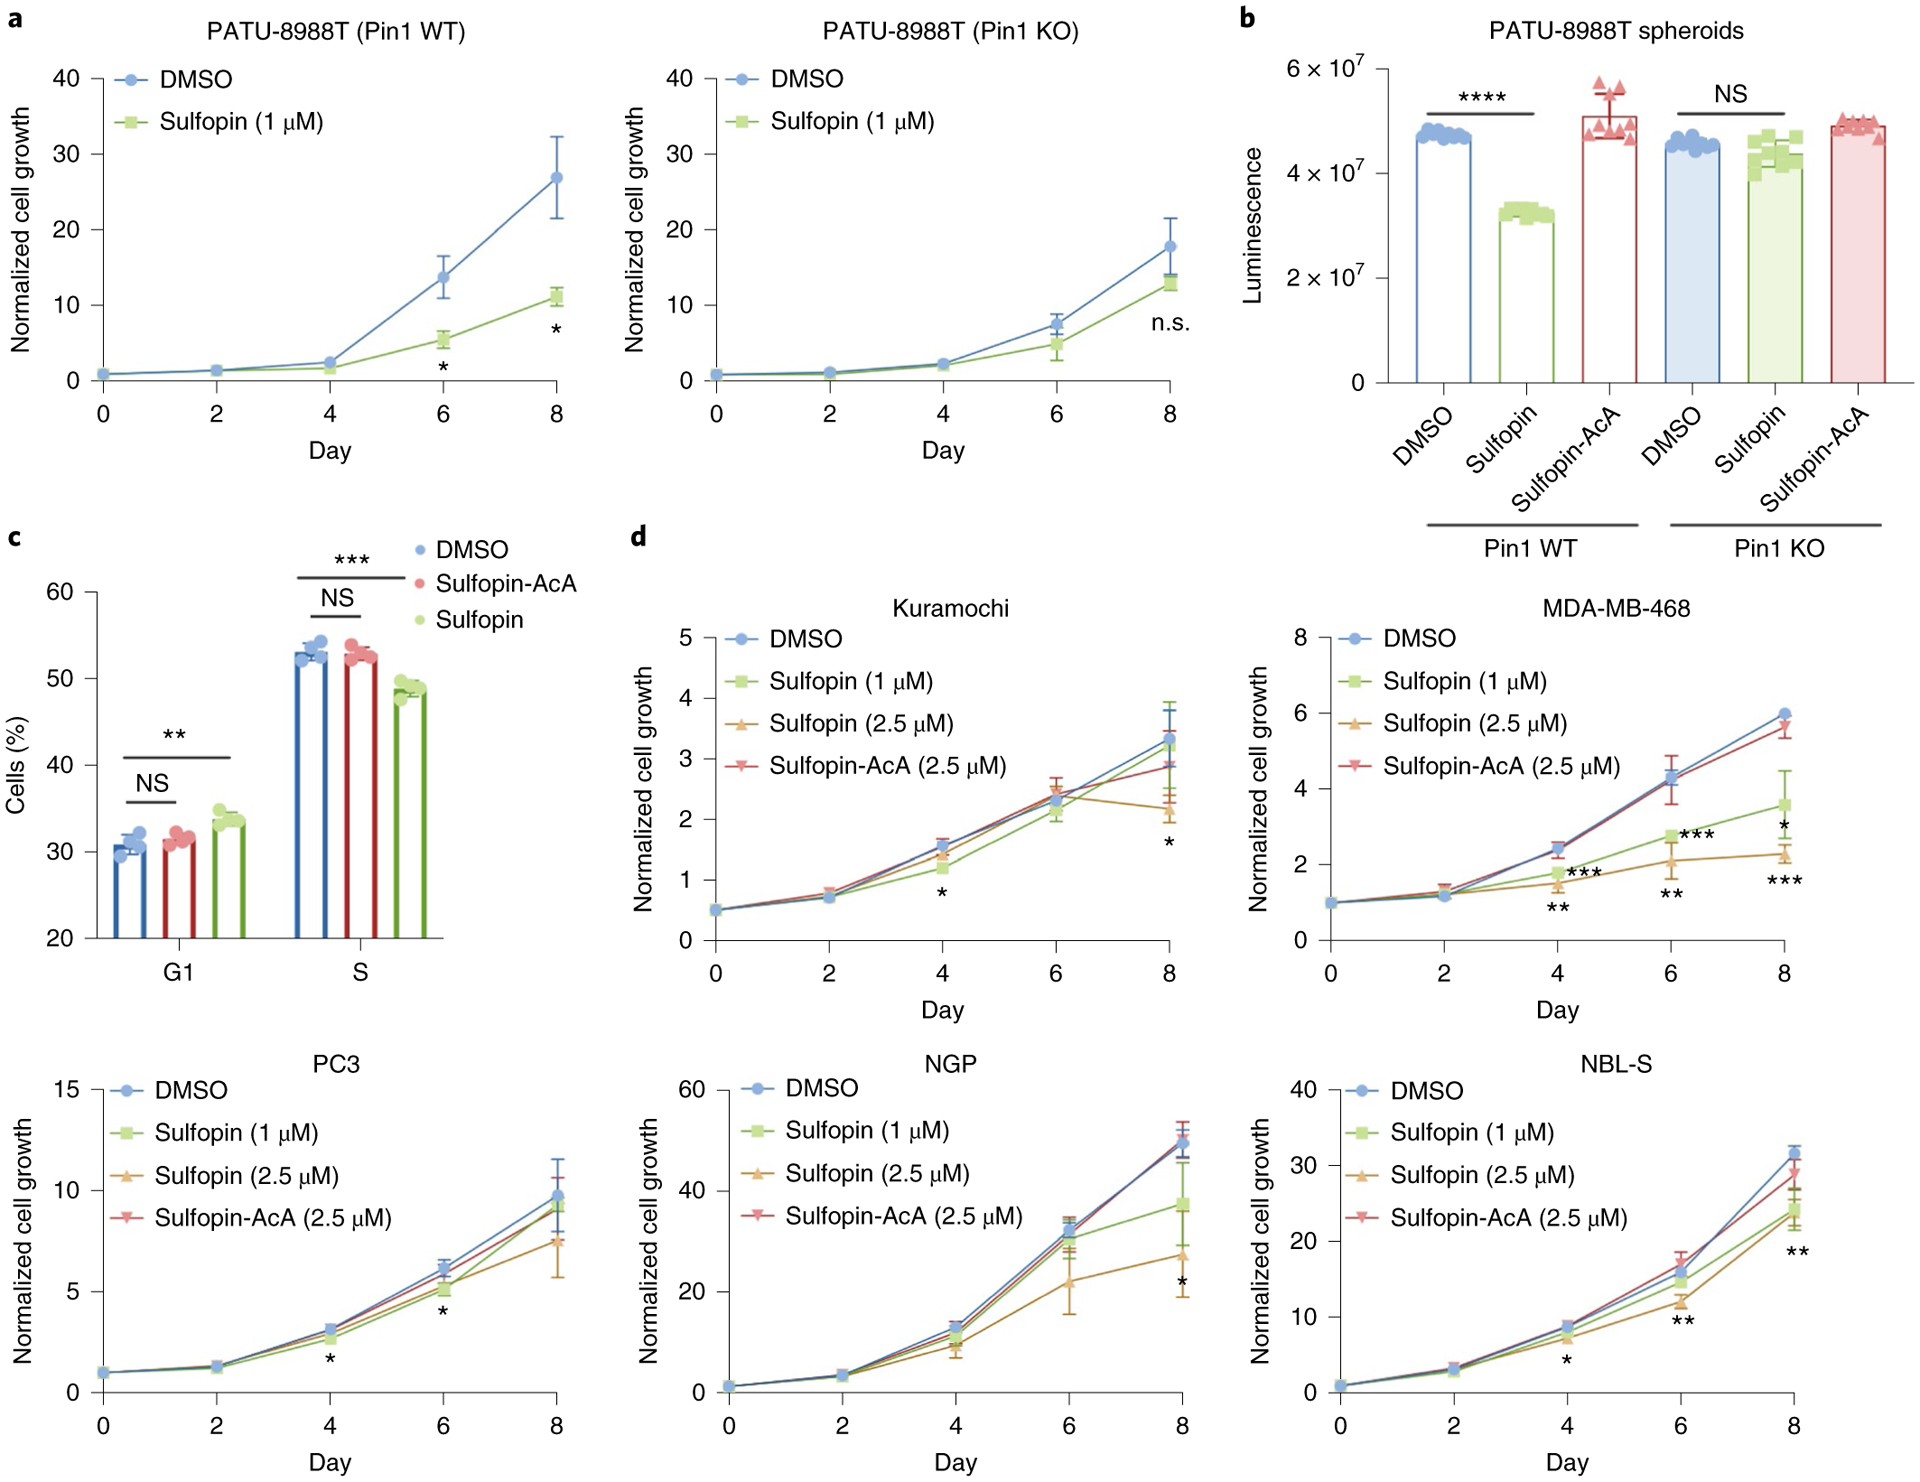
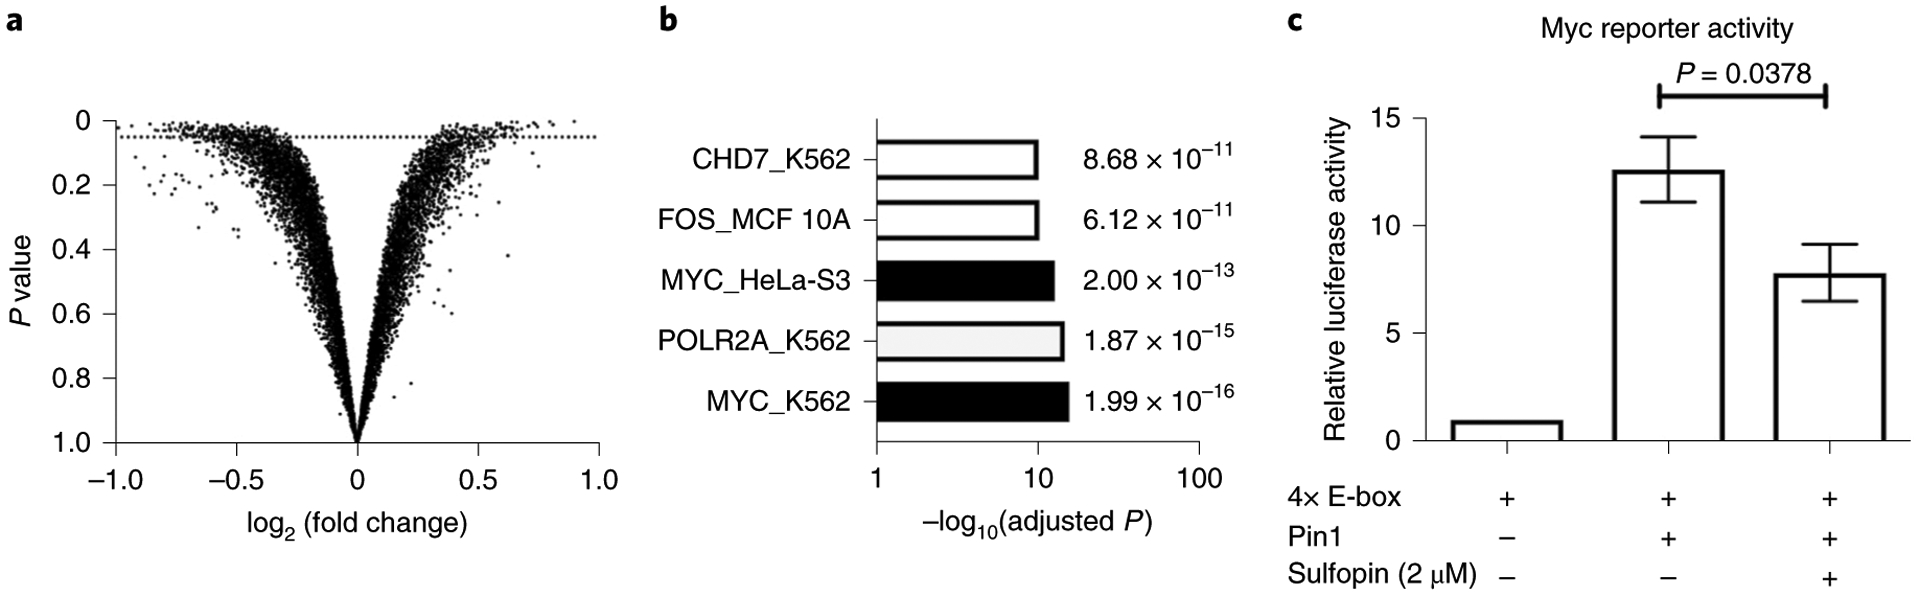
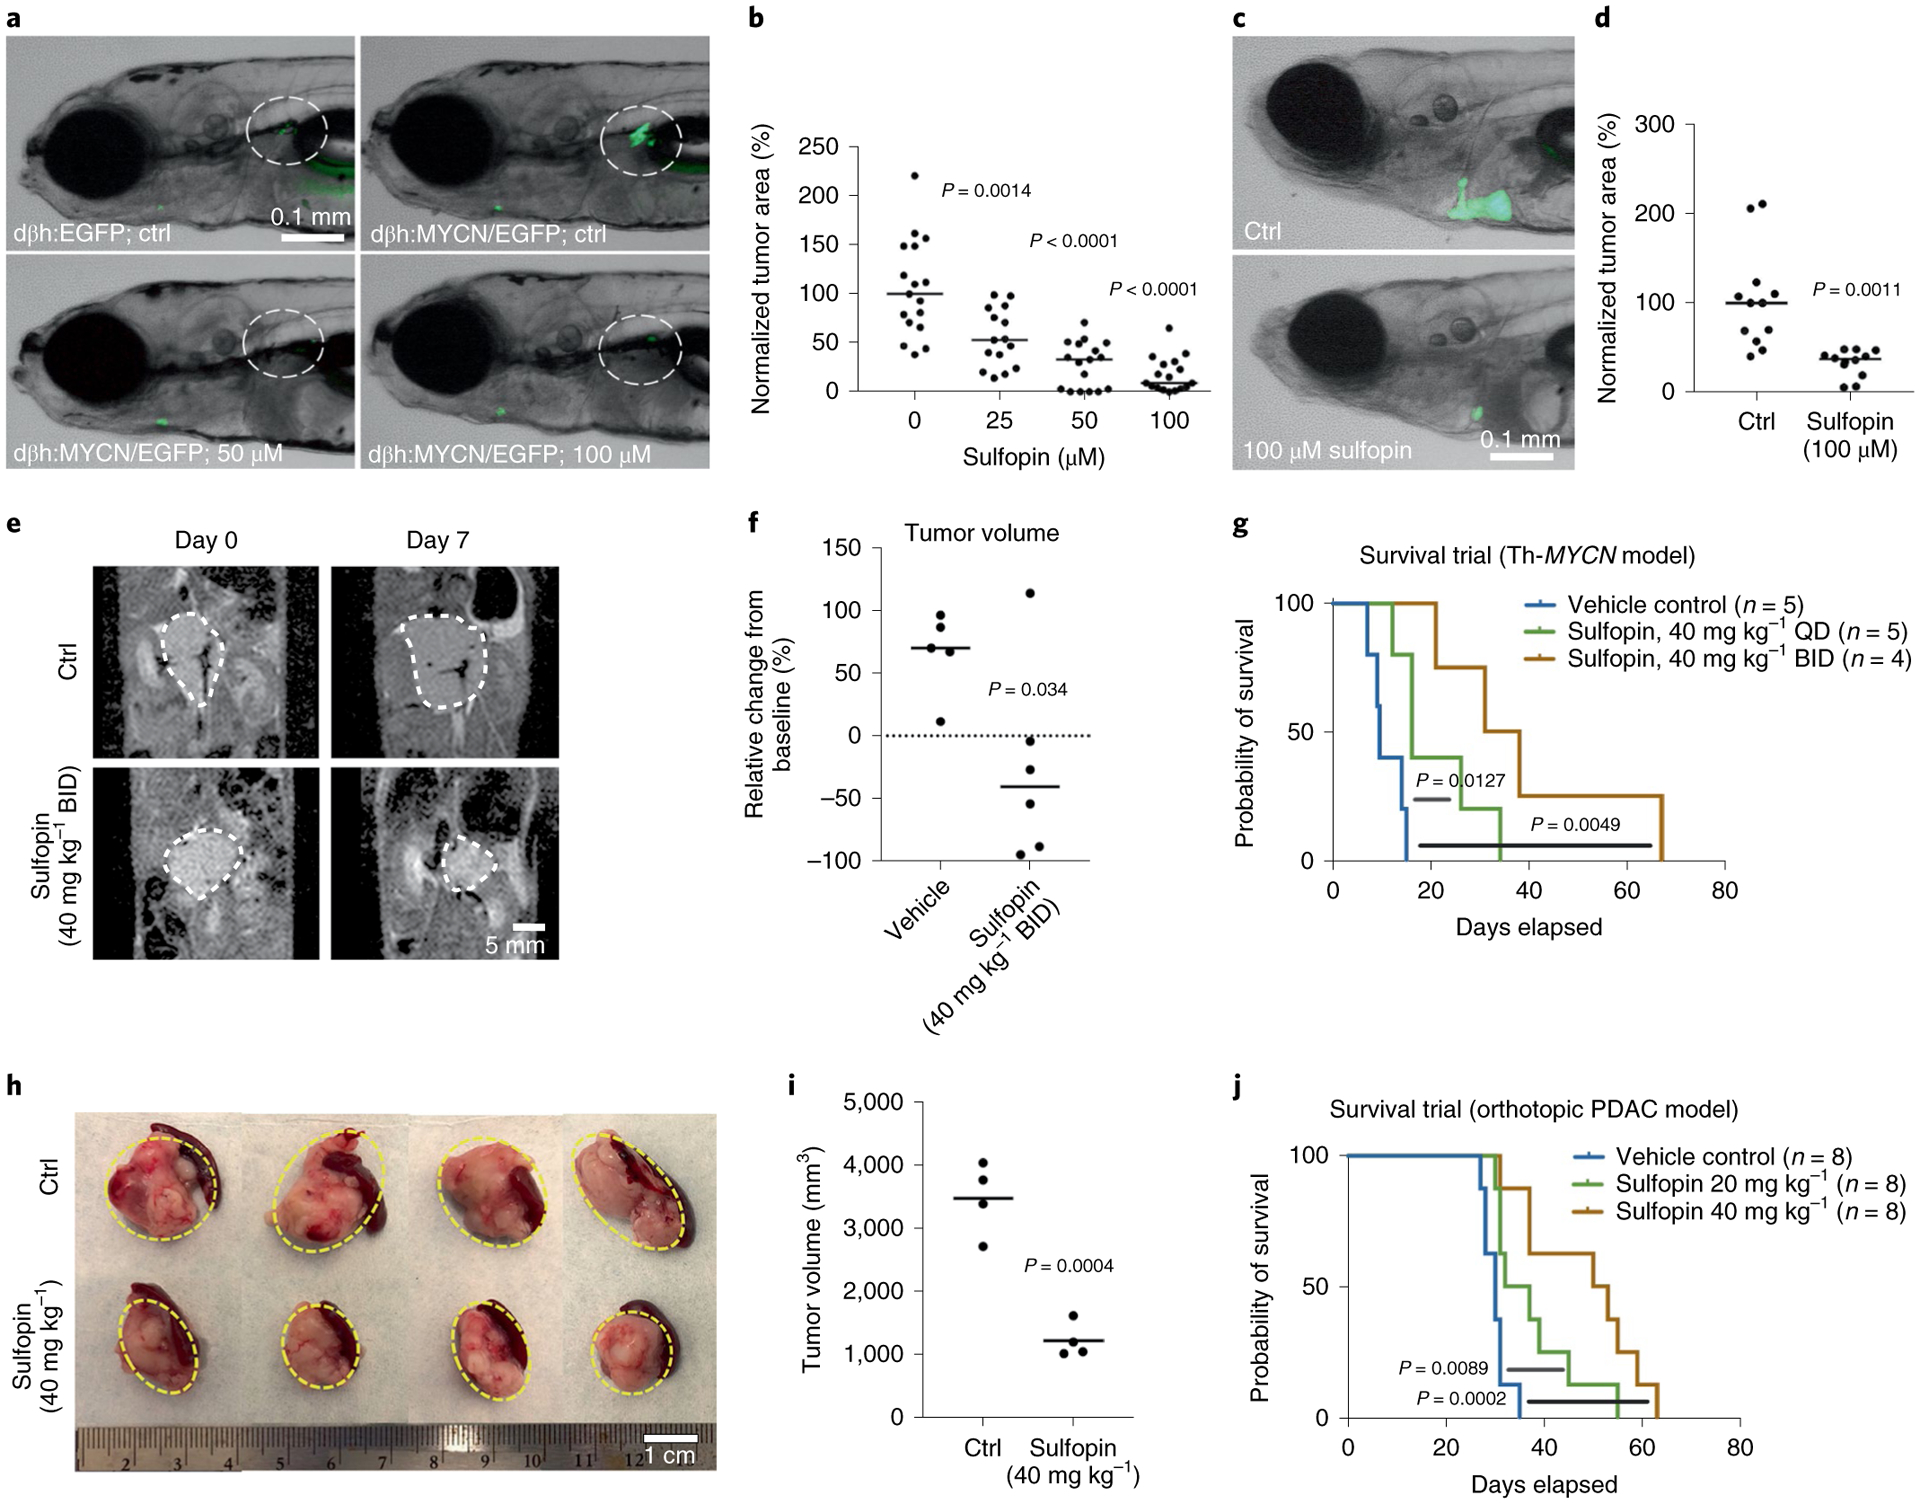
The peptidyl-prolyl isomerase, Pin1, is exploited in cancer to activate oncogenes and inactivate tumor suppressors. However, despite considerable efforts, Pin1 has remained an elusive drug target. Here, we screened an electrophilic fragment library to identify covalent inhibitors targeting Pin1's active site Cys113, leading to the development of Sulfopin, a nanomolar Pin1 inhibitor. Sulfopin is highly selective, as validated by two independent chemoproteomics methods, achieves potent cellular and in vivo target engagement and phenocopies Pin1 genetic knockout. Pin1 inhibition had only a modest effect on cancer cell line viability. Nevertheless, Sulfopin induced downregulation of c-Myc target genes, reduced tumor progression and conferred survival benefit in murine and zebrafish models of MYCN-driven neuroblastoma, and in a murine model of pancreatic cancer. Our results demonstrate that Sulfopin is a chemical probe suitable for assessment of Pin1-dependent pharmacology in cells and in vivo, and that Pin1 warrants further investigation as a potential cancer drug target.


Conflict of interest statement

Competing interests

N.S.G. is a Scientific Founder and member of the Scientific Advisory Board (SAB) of C4, Jengu, Inception, Larkspur, Syros, Soltego, Gatekeeper and Petra Pharmaceuticals and has received research funding from Novartis, Astellas, Taiho and Deerfield. N.L. is a member of the SAB of Totus medicines and Monte Rosa Therapeutics and has received research support from Teva and Pfizer. J.A.M. has received support through sponsored research agreements with AstraZeneca and Vertex. J.A.M. serves on the SAB of 908 Devices. C.M.B. is an employee of AstraZeneca. C.D., B.J.P., D.Z., S.H., X.L., K.P.L., X.Z.Z., T.L., N.S.G. and N.L. are inventors on a patent application related to the inhibitors described in this manuscript (no. PCT/IL2020/050043).

Figures

Extended Data Fig. 1 |
Extended Data Fig. 1 |. Chemoproteomic approaches to establish Sulfopin’s selectivity.
a, Schematic depiction of Covalent Inhibitor Target-Site Identification (CITe-Id) workflow, showing hypothetical results. CiTe-Id identifies Sulfopin-DTB modified sites across the proteome, and profiles competitively labeled cysteine residues following dose-response treatment with Sulfopin in live PATU-8988T cells. b, Schematic depicting the rdTOP-ABPP experimental workflow to assess Sulfopin proteomic selectivity in MDA-MB-231 cells.
Extended Data Fig. 2 |
Extended Data Fig. 2 |. Sulfopin phenocopies Pin1 knockout phenotypes.
a, HeLa cells were treated with either DMSO, Sulfopin, or Go6976 (a Chk1 inhibitor) and exposed to 7.5 Gy IR 1 h after drug treatment. Viability was assessed 3 days post-IR. Sulfopin shows a dose dependent sensitization of the cells to irradiation (n=3; data are represented as mean values with standard deviation). b, Western blot analysis was performed 24 h post-IR, showing Sulfopin blocked phosphorylation of Thr209 of IRAK1. c, A shorter exposure shows that Sulfopin inhibits IRAK1 phosphorylation already at concentrations of 0.1 μM. d, A scheme for testing the effect of Sulfopin in vivo on germinal center B cells in response to immunization. e, Representative flow cytometric plots with Vehicle and Sulfopin (left) and quantification (right) of FASHi CD38 germinal center (GC) cells in WT mice 11 days after immunization with NP-OVA. ** p<0.01, two tailed Student’s t test.
Extended Data Fig. 3 |
Extended Data Fig. 3 |. Sulfopin affects PATu-8988T cell cycle.
PATU-8988T cells were treated in triplicates or more for 4 days with either DMSO (0.1%), Sulfopin (2.5 M) or the non-covalent control Sulfopin-AcA (2.5 M). Cell cycle analysis was performed by BRDU and Propidium-Iodide staining, followed by FACS analysis. Sulfopin treatment reduces the % of cells in S-phase and in turn more cells are found in G1, while the non-covalent Sulfopin-AcA doesn’t show this effect. Representative FACS analysis graphs and a quantification of the results SD of two independent experiments are presented (A. n=3; B. n=4). Statistical significance was calculated using one-tailed Student’s t test (** = p < 0.01, *** = p < 0.001).
Extended Data Fig. 4 |
Extended Data Fig. 4 |. Sulfopin treatment does not induce apoptosis in cells.
a, PATU-8988T cells were treated for 5 or 6 days with either DMSO (0.1%), Sulfopin (1 μM, 2.5 μM) or the non-covalent control Sulfopin-AcA (2.5 μM). The cells were lysed and activation of caspase 3 and Pin1 levels were analysed by Western blot. As a positive control for caspase 3 activation the cells were treated with Staurosporin (1 μM, 4h; STS). See Supplementary Fig. 13a for the results of an additional independent experiment. Caspase 3 was not activated and Pin1 levels were not changed by the treatment with Sulfopin. b, PATU-8988T cells were treated in triplicates for 6 days with either DMSO (0.1%), Sulfopin (1 M, 2.5 M) or the non-covalent control Sulfopin-AcA (2.5 M). The cells were then stained with AnnexinV-FITC/ 7AAD and analysed by FACS. Staurosporin treatment (1 M, 4h) was used as a positive control for apoptosis. Representative FACS analysis graphs and a quantification of the results (n=3; data are represented as mean values with standard deviation). See Supplementary Fig. 13b for the results of an additional independent experiment. Live cells were defined as AnnexinV−/7AAD−, early apoptosis AnnexinV+/7AAD− and late apoptosis AnnexinV+/7AAD+.
Fig. 1 |
Fig. 1 |. Discovery of a covalent Pin1-binding fragment.
a, Intact protein LC–MS spectra of Pin1 (black) directly identify covalent binders (blue) in the electrophilic library screen (200 μM compound for 24 h). Madduct indicates the mass of the expected adduct for the indicated example. b, Distribution of hits in the Pin1 screening campaign and their corresponding labeling (%). Nine hits (18.75%) out of the 48 top hits that labeled Pin1 at >75% (dark and light blue) share sulfolene or sulfolane moieties. Labeling percentage calculated as previously described. c, 2D analysis of the top ten optimized binders (structures shown in f); labeling percentage in the LC–MS assay plotted against reactivity (log (K)) suggests Sulfopin for further biological evaluation. d, Fluorescence polarization assay with the top ten binders, including juglone and a nonreactive control (Sulfopin-AcA), after 14 h of preincubation with Pin1. Data points are plotted as the average of n = 3 independent samples ± s.e.m., and are representative of n = 2 independent experiments. See Supplementary Table 3 for apparent Ki. mP represents the polarization value. e, PPIase substrate activity assay of Pin1 with Sulfopin (n = 3) and juglone (n = 2). Data points are plotted as the average of independent experiments ± s.e.m. for Sulfopin. f, Structures of the top ten binders in the Pin1-labeling LC–MS assay, the nonreactive control Sulfopin-AcA and juglone. g, X-ray crystal structure of Pin1 in complex with Sulfopin (1.4-Å resolution, PDB code 6VAJ). Pin1 (white) with relevant side chains in stick representation; Sulfopin is shown in pink. Hydrogen bonds are depicted as dashed lines. AU, arbitrary units.
Fig. 2 |
Fig. 2 |. Sulfopin engages Pin1 in cells and in vivo.
a, Fluorescence polarization assay showing that the DTB-labeled probe, Sulfopin-DTB, binds Pin1 with similar potency to Sulfopin following 14 h of incubation with Pin1. Data points are plotted as the average of n = 3 independent samples ± s.e.m., and are representative of n = 2 independent experiments. b, Chemical structure of Sulfopin-DTB. c, Sulfopin shows time-dependent engagement in PATU-8988T cells. PATU-8988T cells were treated with Sulfopin (1 μM) for the indicated time points followed by cell lysis, incubation with Sulfopin-DTB (1 μM), streptavidin pulldown and immunoblot analysis. d,e, Sulfopin shows long-term engagement of Pin1. PATU-8988T (d) or HCT116 (e) cells were incubated with or without Sulfopin for the indicated time points, followed by cell lysis, incubation with DTB probe, streptavidin pulldown and immunoblot analysis. Substantial engagement (>50%) was still evident after 72 h. f,g, Sulfopin fully engages Pin1 in PATU-8988T cells at 1 μM and in HCT116 cells at 0.5 μM (see Supplementary Fig. 9b for the structure of BJP-DTB). PATU-8988T (f) or HCT116 (g) cells were incubated with Sulfopin at the indicated concentrations for 5 h, followed by cell lysis, DTB probe incubation (1 h, 1 μM), streptavidin pulldown and immunoblot analysis. The noncovalent control, Sulfopin-AcA, is unable to outcompete Pin1 pulldown. cg, Results are representative of n = 2 independent experiments. h, Sulfopin engages Pin1 in vivo. Mice were treated by oral gavage with the indicated amounts of Pin1 over 2 days for a total of three doses. Following this treatment, spleens were lysed for a competition pulldown experiment with Sulfopin-DTB. Results are representative of n = 2 independent pulldown experiments, starting from the same spleen lysates.
Fig. 3 |
Fig. 3 |. Sulfopin is highly selective for Pin1 C113 in cells.
a, CITe-Id profiling results showing Sulfopin-DTB-labeled cysteine sites, rank ordered by competitive dose response to Sulfopin. Out of 162 cysteine residues reproducibly labeled by Sulfopin-DTB in n = 2 independent experiments, Pin1 C113 was the only site identified with a competitive dose response >2 s.d. from the mean value of the null. (see Supplementary Dataset 3a for a full list of identified peptides, and Supplementary Fig. 10 for results with 12/24-h treatment). b, Waterfall plot showing competitive dose dependency of Pin1 C113 labeling in the CITe-Id experiment. Bars represent mean of n = 2 independent experiments. c, Out of 2,134 cysteines identified in the rdTOP-ABPP experiment, only two showed a light/heavy ratio of >2.5 and, of these, one did not replicate and only Pin1 C113 showed the maximal ratio of 15 in both replicates.
Fig. 4 |
Fig. 4 |. Sulfopin shows a Pin1-dependent viability effect following long-term exposure.
a, We previously generated a PATU-8988T Pin1 knockout (KO) cell line (Supplementary Fig. 12a). Sulfopin (1 μM) had a significant effect on cellular viability after 6 and 8 days (P = 0.01 and P = 0.01, respectively) in WT PATU-8988T cells (left), but showed no significant effect on viability in Pin1 KO cells (right); day 0-normalized growth rate for n = 3 biologically independent samples. b, Relative viability of PATU-8988T WT and Pin1 KO cells grown in 100% Matrigel domes following treatment with either Sulfopin (1 μM; n = 9 biologically independent samples; P = 1.24 × 10⁻¹⁸) or the noncovalent negative control, Sulfopin-AcA (1 μM; n = 9 biologically independent samples). Sulfopin-AcA showed no effect in any of the tested systems. c, Proportion of cells in various cell cycle stages as a function of Sulfopin treatment. The viability effects of Sulfopin are mediated by delayed cell cycle. PATU-8988T cells were treated with either DMSO, 2.5 μM Sulfopin or Sulfopin-AcA for 4 days. Cell cycle analysis was performed by BrdU and propidium iodide staining, followed by FACS analysis. Sulfopin treatment reduced the percentage of cells in S phase (P = 0.0004) and, in turn, increased the number of cells found in G1 phase (P = 0.003), while the noncovalent Sulfopin-AcA did not show this effect (n = 4; see Extended Data Fig. 3 for representative FACS analysis graphs and quantification of the results from two independent experiments). d, Cell culture growth curves. Sulfopin showed variation in antiproliferative effects across cancer cell lines Kuramochi, MDA-MB-468, NGP and NBL-S, with the most pronounced sensitivity observed in MDA-MB-468 cells (day 0-normalized growth rate for n = 3 biologically independent samples; P values for 2.5 μM Sulfopin after 4, 6 and 8 days were 0.007, 0.004 and 0.0004, respectively). Importantly we noted significant viability effects in Myc-high neuroblastoma cell lines NGP and NBL-S (P = 0.018 and 0.002, respectively for 2.5 μM Sulfopin after 8 days). Data points were plotted as the average of n = 3 biologically independent samples ± s.e.m. Statistical significance for all panels was calculated using one-tailed Student’s t-test with unequal variance (NS, not significant; P > 0.05, *P < 0.05, **P < 0.01, ***P < 0.001, ****P < 0.0001).
Fig. 5 |
Fig. 5 |. Sulfopin downregulates Myc transcription.
a, Results of an RNA-seq experiment comparing changes in RNA levels between Mino B cells treated with either Sulfopin (1 μM, 6 h, in triplicate) or DMSO. Each dot represents log2 fold change of a transcript (x axis) versus the P value for significance of that change (y axis; Wald test, as implemented in DESeq2). The dotted line indicates P = 0.05; 206 genes were significantly downregulated. b, Results of gene set enrichment analysis using Enrichr against the ENCODE TF chromatin immunoprecipitation–sequencing set. Two of the sets most enriched were Myc target genes from different cell lines. c, HEK293 cells were transfected with 4× E-box luciferase reporter for Myc transcriptional activity levels. Cotransfection with Pin1 increased reporter activity, while 48-h treatment with Sulfopin significantly (one-tailed Student’s t-test) reduced this activity compared to DMSO (n = 3; error bars indicate s.d.).
Fig. 6 |
Fig. 6 |. Sulfopin abrogates neuroblastoma and PDAC growth in vivo.
a, PSNS cells in the primordial SCG and IRG (highlighted by dotted circles) in representative embryos of Tg(dβh:EGFP) (upper left) and Tg(dβh:MYCN;dβh:EGFP) (upper right) transgenic zebrafish at 7 dpf. Representative 7-dpf Tg(dβh:MYCN;dβh:EGFP) zebrafish treated with 50 μM Sulfopin (bottom left) and 100 μM Sulfopin (bottom right). b, Quantification of green fluorescent protein (GFP)+ cells in primordial SCG and IRG of 7-dpf Tg(dβh:MYCN;dβh:EGFP) embryos treated with Sulfopin at multiple doses. A Mann–Whitney test with confidence intervals of 95% was used for analysis of significance (P value), and quantitative data are reported as median. c, Representative zebrafish embryos transplanted with neuroblastoma cells isolated from 4-month-old Tg(dβh:MYCN;dβh:EGFP) donor zebrafish and treated with DMSO control (upper) or 100 μM Sulfopin added to the water (lower). d, Quantification of enhanced GFP (eGFP)+ tumor area in zebrafish embryos treated with DMSO control and 100 μM Sulfopin added to the fish water. A Mann–Whitney test with confidence intervals of 95% was used for analysis of significance (P value), and quantitative data are reported as median. e, Representative MRI images of Th-MYCN mice pre- and post-7-day treatment with vehicle or 40 mg kg−1 BID Sulfopin. f, Significant differences in MRI-derived relative changes in tumor size of Th-MYCN mice after 7-day treatment with either vehicle (n = 5) or 40 mg kg−1 Sulfopin BID (n = 6) (P = 0.034, two-tailed Student’s t-test). Note the actual reduction in tumor size observed in five out of six treated mice. g, QD-treated mice showed significant (P = 0.0127) increase in overall survival, with an average increase of 10 days. BID-treated mice showed significant (P = 0.0049) increase in overall survival, with an average increase of 28 days. h, KPC mouse-derived pancreatic cancer cells were orthotopically transplanted into B6 mouse pancreas tail. One week after transplantation, mice were treated daily IP with either vehicle control, 20 mg kg–1 Sulfopin or 40 mg kg−1 Sulfopin. When maximum tumor length in control mice reached 2 cm, mice were euthanized and tumors collected and measured. i, Quantification of tumor volume (n = 4). Sulfopin-treated mice showed significant decrease in tumor volume (P = 0.0004, two-tailed Student’s t-test). j, Survival trial (Kaplan–Meier survival analysis, n = 8). Treated mice showed a significant increase in overall survival (P = 0.0002), with an average of 18.125 days. All mice survival significance data were evaluated using a Mantel–Cox test. Ctrl, control.

Comment in

  • Pinning down an elusive target.
    Crunkhorn S. Crunkhorn S. Nat Rev Drug Discov. 2021 Jul;20(7):508. doi: 10.1038/d41573-021-00092-w. Nat Rev Drug Discov. 2021. PMID: 34040180 No abstract available.

References

    1. Pawson T & Scott JD Protein phosphorylation in signaling—50 years and counting. Trends Biochem. Sci 30, 286–290 (2005). - PubMed
    1. Lu KP & Zhou XZ The prolyl isomerase PIN1: a pivotal new twist in phosphorylation signalling and disease. Nat. Rev. Mol. Cell Biol 8, 904–916 (2007). - PubMed
    1. Lam PB et al. Prolyl isomerase Pin1 is highly expressed in Her2-positive breast cancer and regulates erbB2 protein stability. Mol. Cancer 7, 91 (2008). - PMC - PubMed
    1. Shen M, Stukenberg PT, Kirschner MW & Lu KP The essential mitotic peptidyl-prolyl isomerase Pin1 binds and regulates mitosis-specific phosphoproteins. Genes Dev. 12, 706–720 (1998). - PMC - PubMed
    1. Ryo A, Nakamura M, Wulf G, Liou YC & Lu KP Pin1 regulates turnover and subcellular localization of beta-catenin by inhibiting its interaction with APC. Nat. Cell Biol 3, 793–801 (2001). - PubMed

Publication types

MeSH terms