. 2021 Jul;7(7):914-923.
doi: 10.1016/j.eng.2021.03.017. Epub 2021 May 6.

Assessing the Effect of Global Travel and Contact Restrictions on Mitigating the COVID-19 Pandemic

Affiliations

Assessing the Effect of Global Travel and Contact Restrictions on Mitigating the COVID-19 Pandemic

Shengjie Lai et al. Engineering (Beijing). 2021 Jul.

Abstract

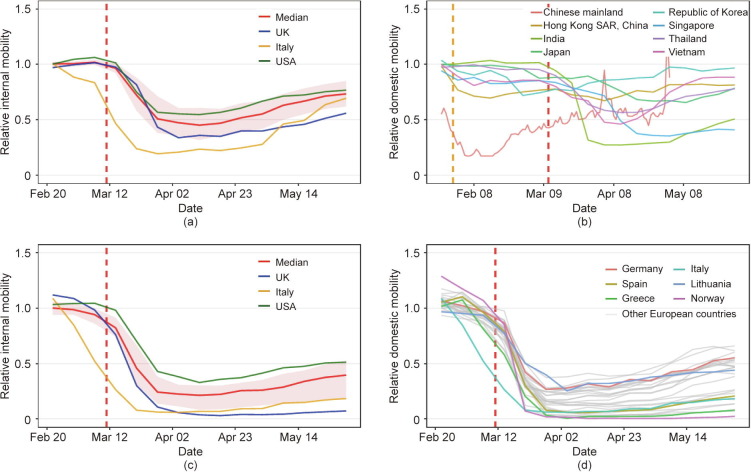
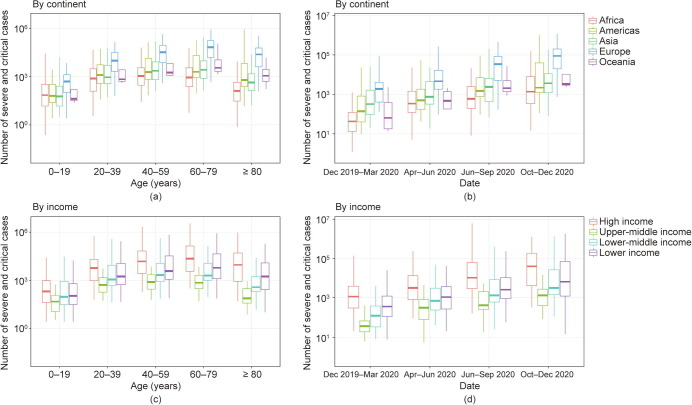
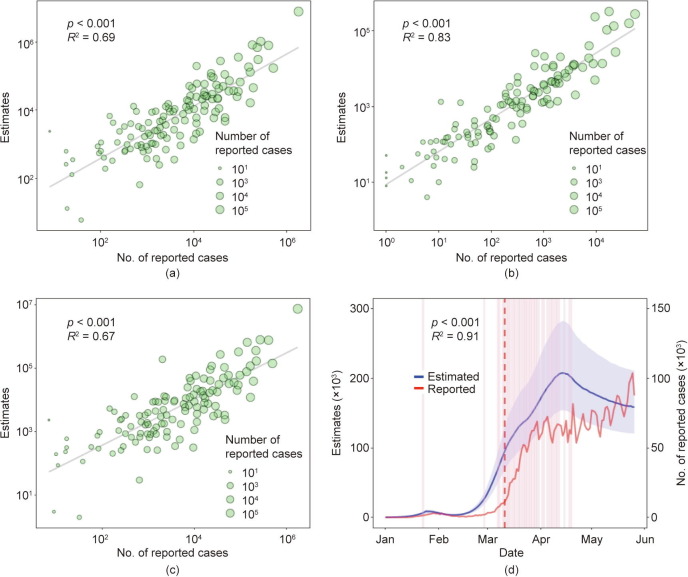
Travel restrictions and physical distancing have been implemented across the world to mitigate the coronavirus disease 2019 (COVID-19) pandemic, but studies are needed to understand their effectiveness across regions and time. Based on the population mobility metrics derived from mobile phone geolocation data across 135 countries or territories during the first wave of the pandemic in 2020, we built a metapopulation epidemiological model to measure the effect of travel and contact restrictions on containing COVID-19 outbreaks across regions. We found that if these interventions had not been deployed, the cumulative number of cases could have shown a 97-fold (interquartile range 79-116) increase, as of May 31, 2020. However, their effectiveness depended upon the timing, duration, and intensity of the interventions, with variations in case severity seen across populations, regions, and seasons. Additionally, before effective vaccines are widely available and herd immunity is achieved, our results emphasize that a certain degree of physical distancing at the relaxation of the intervention stage will likely be needed to avoid rapid resurgences and subsequent lockdowns.

Keywords: COVID-19; Pandemic; Physical distancing; Population mobility; Travel restriction.


Figures

Fig. 1
Fig. 1
Changing patterns of domestic and international population movements across countries or territories, as of May 30, 2020. (a) Domestic weekly movements within 127 countries or territories, with movements from January 5 to February 15, 2020 as a reference; (b) domestic population movements within eight Asian countries/regions (the daily mobility within Chinese mainland from January 23 to May 2, 2020 was derived from Baidu location-based data, standardized by averaged travel flow from January 5 to 22 before Wuhan’s lockdown on January 23, 2020, and all other country or region curves were derived from weekly Google location history data, with movements from January 5 to 25 as a reference); (c) relative international outflows from 104 countries with available international mobility data; (d) relative international outflows from all European countries (the weekly international mobility measures, derived from Google data, took movements from January 5 to February 15 as a reference). The orange and red vertical dashed lines indicate the dates the World Health Organization (WHO) declared COVID-19 a Public Health Emergency of International Concern and a pandemic, respectively. The median (red line) and interquartile range (pink areas) are provided in (a) and (c), with the curves of Italy, the UK, and the USA presented. Each curve in (b) and (d) represents the relative travel pattern of a country or territory.
Fig. 2
Fig. 2
Estimated epidemic curves of COVID-19 under different intervention scenarios across 135 countries or territories in 2020. (a) Implementing travel and physical distancing interventions during various periods (the median and interquartile ranges of estimates are shown); (b) 8-week interventions with various levels of travel and contact rates (in panels (a) and (b), the travel and contact levels after relaxing interventions were assumed to be 70% of normal level before the outbreaks, if the travel and contact rates in a country or territory were lower than 70%); (c) scenarios of various travel and contact rates after lifting 8-week interventions; (d) the estimated epidemic curves under interventions up until December 31, 2020 based on travel and contact levels by May 2, 2020: 14 countries/territories with travel and contact rates higher than or equal to 70%, and 121 countries/territories with the rate less than 70% at any week; (e) estimated epidemic curves under interventions implemented earlier than actual timing, under the scenario of interventions implemented by December 31, 2020; (f) estimated epidemic curves under interventions implemented later than actual timing, under the scenario of interventions implemented up until December 31, 2020. The orange and red vertical dashed lines indicate the dates the WHO declared COVID-19 a Public Health Emergency of International Concern and a pandemic, respectively. The pink vertical lines indicate the dates that lockdown/physical distancing measures were implemented by each country or territory.
Fig. 3
Fig. 3
Estimates of severe and critical COVID-19 cases in 135 countries or territories. (a) Estimates by age and continent; (b) estimates by season and continent; (c) estimates by age and income classification of each country or territory (low income was less than 1026 USD·a−1 per capita; lower-middle income was from 1026 to 3995 USD·a−1 per capita; upper-middle income was from 3996 to 12 375 USD·a−1 per capita; high income was higher than 12 375 USD·a−1 per capita); (d) estimates by season and income classification of each country or territory. The estimates were based on the scenario of 8-week travel and physical distancing interventions as of May 30, 2020. If the travel and contact rates in a country or territory were lower than 70% of normal levels before the outbreak, the rates were assumed to return to 70% after relaxing the interventions. The estimates of severe and critical infections were preliminarily based on the age structures of populations in each country/territory in 2020 and the age-specific severity risk of confirmed COVID-19 cases reported from Wuhan .
Fig. 4
Fig. 4
Comparing the estimated and reported numbers of COVID-19 cases across 135 countries or territories. (a) Estimates versus reported case counts by country/territory; (b) estimates versus reported numbers of cases before implementing lockdown/physical distancing measures; (c) estimates versus reported case counts after implementing lockdown/physical distancing measures; (d) estimated versus reported epidemic curves. The median and interquartile range of estimates are provided here. The reported case counts were obtained from European Centre for Disease Prevention and Control, as of June 1, 2020. To be comparable between estimated and reported data, time series of daily reported cases were moved back six days to account for the delay from illness onset to reporting. The red vertical dashed line indicates the date of COVID-19 pandemic declared by the WHO. The pink vertical lines indicate the dates of lockdown/nationwide physical distancing measures implemented by each country/territory. The Pearson’s correlations between estimated and reported case numbers are presented with the p values of two-sided t-test.

Similar articles

Cited by

References

    1. Coronavirus disease (COVID-19) pandemic [Internet]. Geneva: World Health Organization; 2020 [cited 2020 Feb 29]. Available from: https://www.who.int/emergencies/diseases/novel-coronavirus-2019.
    1. Bonaccorsi G., Pierri F., Cinelli M., Flori A., Galeazzi A., Porcelli F. Economic and social consequences of human mobility restrictions under COVID-19. Proc Natl Acad Sci USA. 2020;117(27):15530–15535. - PMC - PubMed
    1. Yang J, Li J, Lai S, Ruktanonchai CW, Xing W, Carioli A, et al. Uncovering two phases of early intercontinental COVID-19 transmission dynamics. J Travel Med 2020;27(8):taaa200. - PMC - PubMed
    1. Walker PGT, Whittaker C, Watson OJ, Baguelin M, Winskill P, Hamlet A, et al. The impact of COVID-19 and strategies for mitigation and suppression in low- and middle-income countries. Science 2020;369(6502):413–22. - PMC - PubMed
    1. Flaxman S., Mishra S., Gandy A., Unwin H.J.T., Mellan T.A., Coupland H. Estimating the effects of non-pharmaceutical interventions on COVID-19 in Europe. Nature. 2020;584(7820):257–261. - PubMed

LinkOut - more resources