[Preprint]. 2021 May 4:2021.05.04.442548.
doi: 10.1101/2021.05.04.442548.

ORAI1 establishes resistance to SARS-CoV-2 infection by regulating tonic type I interferon signaling

Affiliations

ORAI1 establishes resistance to SARS-CoV-2 infection by regulating tonic type I interferon signaling

Beibei Wu et al. bioRxiv. .

Update in

Abstract

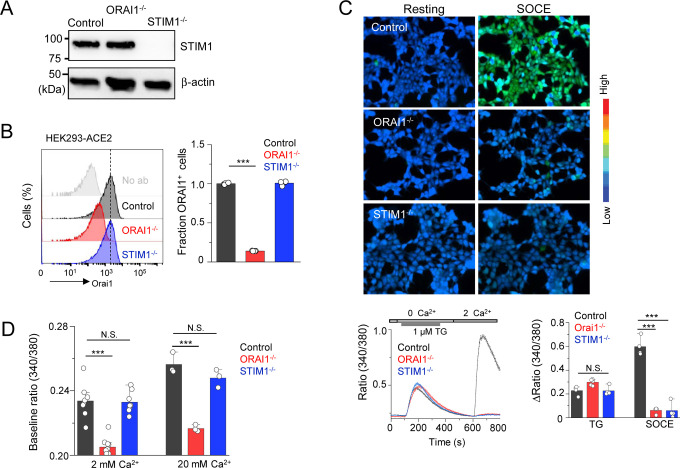
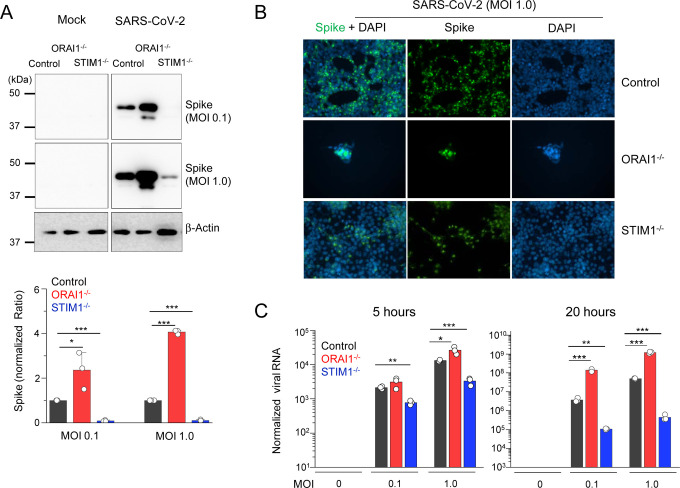
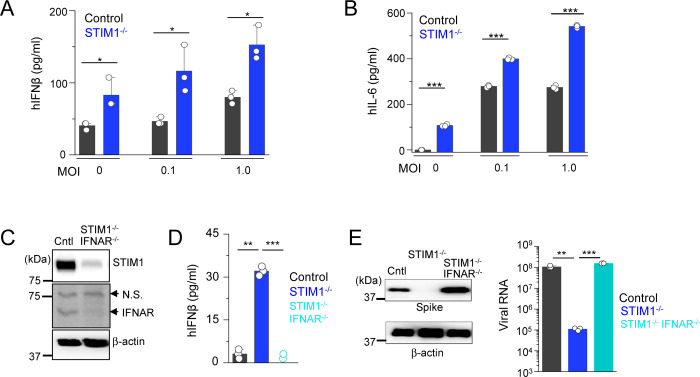
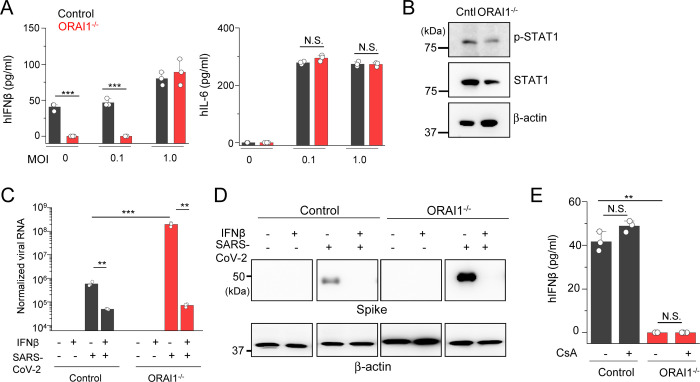
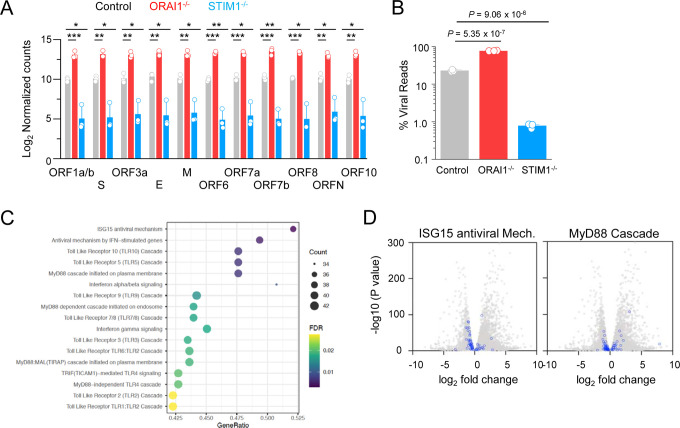
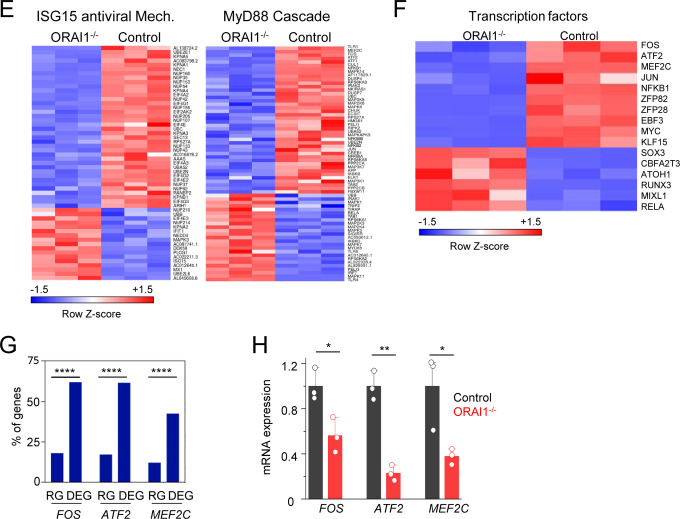
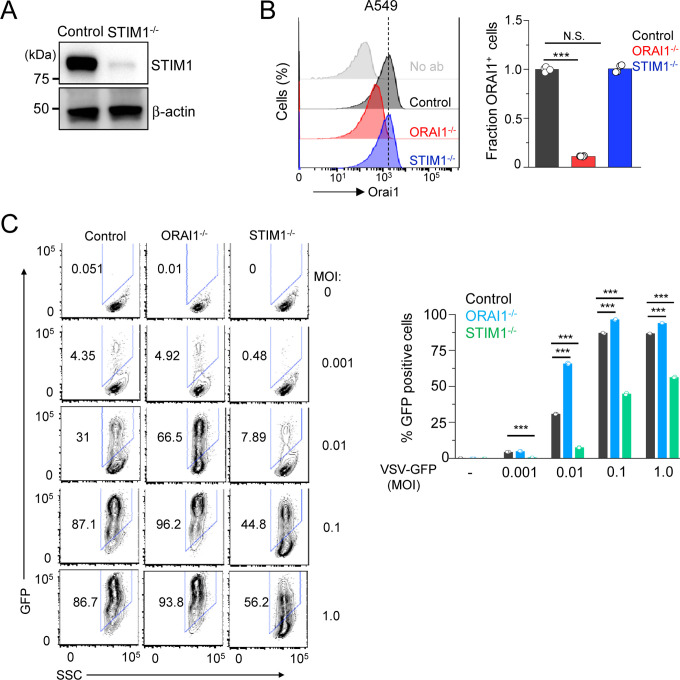
ORAI1 and STIM1 are the critical mediators of store-operated Ca 2+ entry by acting as the pore subunit and an endoplasmic reticulum-resident signaling molecule, respectively. In addition to Ca 2+ signaling, STIM1 is also involved in regulation of a cytosolic nucleic acid sensing pathway. Using ORAI1 and STIM1 knockout cells, we examined their contribution to the host response to SARS-CoV-2 infection. STIM1 knockout cells showed strong resistance to SARS-CoV-2 infection due to enhanced type I interferon response. On the contrary, ORAI1 knockout cells showed high susceptibility to SARS-CoV-2 infection as judged by increased expression of viral proteins and a high viral load. Mechanistically, ORAI1 knockout cells showed reduced homeostatic cytoplasmic Ca 2+ concentration and severe impairment in tonic interferon signaling. Transcriptome analysis showed downregulation of multiple cellular defense mechanisms, including antiviral signaling pathways in ORAI1 knockout cells, which are likely due to reduced expression of the Ca 2+ -dependent transcription factors of the activator protein 1 (AP-1) family and MEF2C . Our results identify a novel role of ORAI1-mediated Ca 2+ signaling in regulating the baseline type I interferon level, which is a determinant of host resistance to SARS-CoV-2 infection.


Conflict of interest statement

COMPETING FINANCIAL INTERESTS

The authors do not have any competing financial interests.

Figures

Figure 1.
Figure 1.. Loss of ORAI1 reduces basal Ca2+ concentration and abrogates SOCE in HEK293-ACE2 cells
(A) Representative immunoblot showing expression of STIM1 in lysates from control, ORAI1−/−, or STIM1−/− HEK293-ACE2 cells. β-actin – loading control. Data are representative of two independent experiments. (B) Representative histograms showing levels of total ORAI1 protein in control, ORAI1−/−, and STIM1−/− HEK293-ACE2 cells after permeabilization and intracellular staining with anti-ORAI1 antibody. The bar graph shows average (± s.e.m.) from three independent experiments. (C) Representative pseudocoloured epifluorescence images of indicated cells under resting conditions or at the peak of SOCE. Below - Representative traces showing averaged SOCE from control (39 cells), ORAI1−/− (35 cells) and STIM1−/− (42 cells) HEK293-ACE2 cells after passive depletion of intracellular Ca2+ stores with thapsigargin (TG – 1 μM) in Ca2+-free external solution. SOCE was measured after replacing external solution with that containing 2 mM CaCl2. Bar graph on the right shows averaged baseline subtracted ER Ca2+ stores (TG) and SOCE (± s.e.m.) from four independent experiments. (D) Bar graph shows baseline Ca2+ levels (as depicted by Fura-2 ratio) ± s.e.m. in indicated cell types upon perfusion with extracellular solution containing either 2 mM or 20 mM CaCl2. Each dot represents data obtained from an independent experiment. ***P<0.0005 (two-tailed t test).
Figure 2.
Figure 2.. Loss of ORAI1 or STIM1 affects cellular susceptibility to SARS-CoV-2 infection
(A) Representative immunoblot showing expression of SARS-CoV-2 proteins in indicated HEK293-ACE2 cells under mock conditions or after infection with SARS-CoV-2 at indicated multiplicity of infection (MOIs). β-actin – loading control. Bar graph below shows densitometry analysis of normalized ratio of SARS-N-CoV-2 to β-actin (± s.e.m.) from three independent experiments. (B) Representative epifluorescence images showing expression of spike protein (green) in control, ORAI1−/−, or STIM1−/− HEK293-ACE2 cells after infection with SARS-CoV-2 at MOI 1.0. Cells were co-stained with DAPI for detection of nuclei. ORAI1−/− HEK293-ACE2 cells were all detached due to high virus load. (C) Quantitative RT-PCR analysis of viral genome from indicated cell types under mock conditions or after infection with SARS-CoV-2 at indicated MOI for 5 (left graph) or 20 (right graph) hours. Shown is one representative triplicate from two independent experiments. * P<0.05, ** P<0.005, ***P<0.0005 (two-tailed t test).
Figure 3.
Figure 3.. Loss of STIM1 imparts resistance to SARS-CoV-2 infection by enhancing interferon β signaling pathway.
(A) Levels of IFN-β in culture supernatants from control or STIM1−/− HEK293-ACE2 cells under mock conditions or 20 h after infection with SARS-CoV-2 at indicted MOIs. (B) Levels of IL-6 in culture supernatants from control or STIM1−/− HEK293-ACE2 cells. (C) Representative immunoblot showing expression of STIM1 and interferon α receptor subunit 1 (IFNAR1) in control HEK293-ACE2 cells or those deleted for both STIM1 and IFNAR1 using CRISPR/Cas9-mediated recombination. β-actin – loading control. Data are representative of two independent experiments. N.S., non-specific band. (D) Levels of IFN-β in culture supernatants from control, STIM1−/−, or STIM1−/− IFNAR−/− HEK293-ACE2 cells under resting conditions. (E) Representative immunoblot showing expression of SARS-CoV-2 proteins in indicated HEK293-ACE2 cells under mock conditions or after infection with SARS-CoV-2 at MOI 0.1. β-actin – loading control. Data are representative of two independent infection experiments. Right - Quantitative RT-PCR analysis of viral genome from indicated cell types under mock conditions or after infection with SARS-CoV-2 at MOI 0.1 for 20 hours. In bar graphs in panels (A), (B), (D), and (E) representative triplicates from two independent experiments are shown. * P<0.05, ** P<0.005, ***P<0.0005 (two-tailed t test).
Figure 4.
Figure 4.. Loss of ORAI1 imparts susceptibility to SARS-CoV-2 infection by abrogating baseline interferon β levels.
(A) Levels of IFNβ and IL-6 in culture supernatants from control or ORAI1−/− HEK293-ACE2 cells under mock conditions or 20 hours after infection with SARS-CoV-2 at indicted MOIs. (B) Representative immunoblot showing expression of phosphorylated STAT1 (p-STAT1) or total STAT1 in lysates from control or ORAI1−/− HEK293-ACE2 cells. β-actin – loading control. Data are representative of three independent experiments. (C) Quantitative RT-PCR analysis of viral genome from indicated cell types with or without pre-treatment with 100 U/ml of IFN-β (for 20 hours) under mock conditions or after infection with SARS-CoV-2 at MOI 0.1 for 20 h. (D) Representative immunoblot showing expression of SARS-CoV-2 proteins in indicated HEK293-ACE2 cells with or without pre-treatment with 100 U/ml of IFN-β (for 20 hours) under mock conditions or after infection with SARS-CoV-2 at MOI 0.1. β-actin – loading control. Data are representative of two independent infection experiments. (E) Levels of IFN-β in culture supernatants from control or ORAI1−/− HEK293-ACE2 cells with or without pre-treatment with 1μM cyclosporine A (CsA, 20 hours). P<0.05, ** P<0.005, ***P<0.0005 (two-tailed t test).
Figure 5.
Figure 5.. Transcriptome analysis of control and ORAI1−/− HEK293-ACE2 cells.
(A) Normalized read counts (log2) of SARS-CoV-2 RNA products, showing transcriptional enrichment of viral genes in SARS-CoV-2 infected cells when compared to uninfected cells. (B) Bar graph shows proportion of total reads comprising SARS-CoV-2 transcripts in indicated cell types. The proportion of virus-aligned reads over total reads is shown for each sample. Error bars represent average (± s.d.m.) from three biological replicates. (C) Dot plot visualization of enriched pathways in ORAI1−/− HEK293-ACE2 cells. Reactome pathway enrichment analysis was performed in PANTHER. The size of the dots represents the percentage of genes enriched in the total gene set, while its color represents the false discovery rate (FDR, p-adjusted) value for each enriched pathway. (D) Volcano plots with all DEGs from ORAI1−/− and control mock (uninfected) samples in gray and the indicated gene sets of anti-viral ISG15 signaling (left) and MyD88 signaling (right) highlighted in blue (FDR <0.01). (E) Heat map illustrating z-scores as expression levels of the differentially expressed genes involved in antiviral signaling and MyD88 signaling pathways as show in panel D. Blue and red colors represent down- and upregulated genes, respectively. (F) Heat map depicting z-scores as expression levels of selected transcription factors differentially expressed between control and ORAI1−/− HEK293-ACE2 cells. (G) Transcription factor binding sites at the promoters of genes (TSS ± 1 Kb) of the entire genome (from ChiP Atlas) or among differentially expressed genes (DEG) in ORAI1−/− HEK293-ACE2 cells. The hypergeometric P values (**** P<0.0001) were calculated by comparing background (complete gene sets of the reference host; RG) to genes from DEGs to see enrichment of binding sites of indicated transcription factors. (H) Quantitative RT-PCR analysis of indicated genes from control and ORAI1−/− HEK293-ACE2 cells under resting conditions. P<0.05, ** P<0.005, ***P<0.0005 (two-tailed t test).
Figure 6.
Figure 6.. Loss of ORAI1 or STIM1 influences host resistance to vesicular stomatitis virus.
(A) Representative immunoblot showing expression of STIM1 in lysates from control and STIM1−/− A549 cells. β-actin – loading control. Data are representative of two independent experiments. (B) Representative histograms showing levels of total ORAI1 protein in control, ORAI1−/−, and STIM1−/− A549 cells after permeabilization and intracellular staining with anti-ORAI1 antibody. The bar graph shows average (± s.e.m.) from three independent experiments. (C) Representative flow plots showing frequency of GFP-positive population in VSV-GFP-infected (at indicated MOIs for 20 hours) control, ORAI1−/−, or STIM1−/− A549 cells. Bar graph (right) shows averaged frequency of VSV-GFP-positive populations from three independent experiments. ***P<0.0005 (two-tailed t test).

Similar articles

References

    1. Ban N., Yamada Y., Someya Y., Ihara Y., Adachi T., Kubota A., Watanabe R., Kuroe A., Inada A., Miyawaki K., et al. (2000). Activating transcription factor-2 is a positive regulator in CaM kinase IV-induced human insulin gene expression. Diabetes 49, 1142–1148. - PubMed
    1. Bastard P., Rosen L.B., Zhang Q., Michailidis E., Hoffmann H.H., Zhang Y., Dorgham K., Philippot Q., Rosain J., Beziat V., et al. (2020). Autoantibodies against type I IFNs in patients with life-threatening COVID-19. Science 370. - PMC - PubMed
    1. Blanco-Melo D., Nilsson-Payant B.E., Liu W.C., Uhl S., Hoagland D., Moller R., Jordan T.X., Oishi K., Panis M., Sachs D., et al. (2020). Imbalanced Host Response to SARS-CoV-2 Drives Development of COVID-19. Cell 181, 1036–1045 e1039. - PMC - PubMed
    1. Brandman O., Liou J., Park W.S., and Meyer T. (2007). STIM2 is a feedback regulator that stabilizes basal cytosolic and endoplasmic reticulum Ca2+ levels. Cell 131, 1327–1339. - PMC - PubMed
    1. Chen G., Wu D., Guo W., Cao Y., Huang D., Wang H., Wang T., Zhang X., Chen H., Yu H., et al. (2020). Clinical and immunological features of severe and moderate coronavirus disease 2019. J Clin Invest 130, 2620–2629. - PMC - PubMed

Publication types