

Normalisation of glucose metabolism by exendin-4 in the chronic phase after stroke promotes functional recovery in male diabetic mice
- PMID: 33973246
- PMCID: PMC8820185
- DOI: 10.1111/bph.15524
Normalisation of glucose metabolism by exendin-4 in the chronic phase after stroke promotes functional recovery in male diabetic mice
Abstract
Background and purpose: Glucagon-like peptide-1 (GLP-1) receptor activation decreases stroke risk in people with Type 2 diabetes (T2D), while animal studies have shown the efficacy of this strategy to counteract stroke-induced acute brain damage. However, whether GLP-1 receptor activation also improves recovery in the chronic phase after stroke is unknown. We investigated whether post-acute, chronic administration of the GLP-1 receptor agonist, exendin-4, improves post-stroke recovery and examined possible underlying mechanisms in T2D and non-T2D mice.
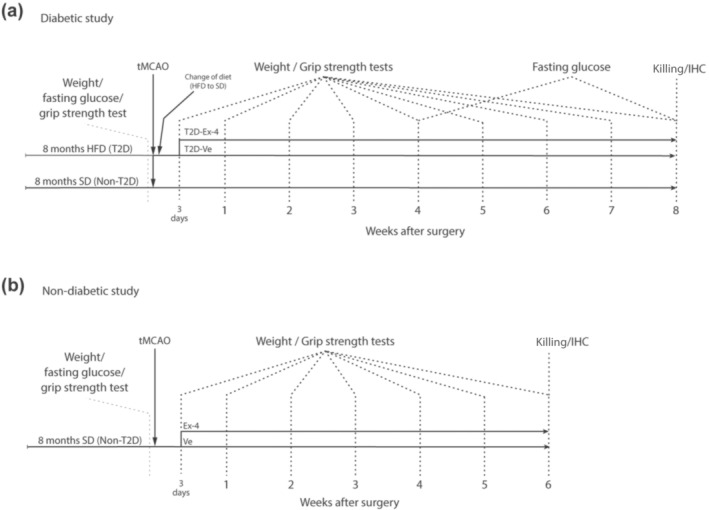
Experimental approach: We induced stroke via transient middle cerebral artery occlusion (tMCAO) in T2D/obese mice (8 months of high-fat diet) and age-matched controls. Exendin-4 was administered for 8 weeks from Day 3 post-tMCAO. We assessed functional recovery by weekly upper-limb grip strength tests. Insulin sensitivity and glycaemia were evaluated at 4 and 8 weeks post-tMCAO. Neuronal survival, stroke-induced neurogenesis, neuroinflammation, atrophy of GABAergic parvalbumin+ interneurons, post-stroke vascular remodelling and fibrotic scar formation were investigated by immunohistochemistry.
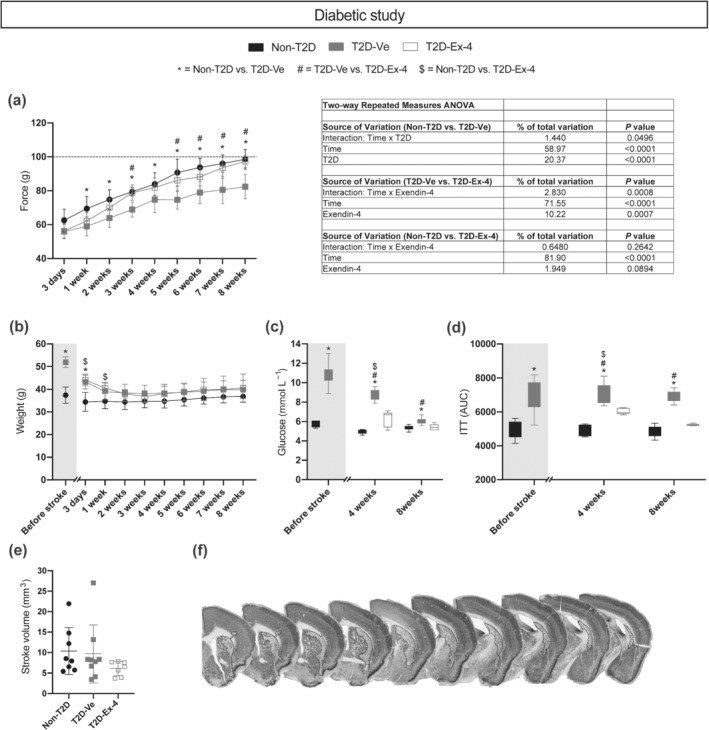
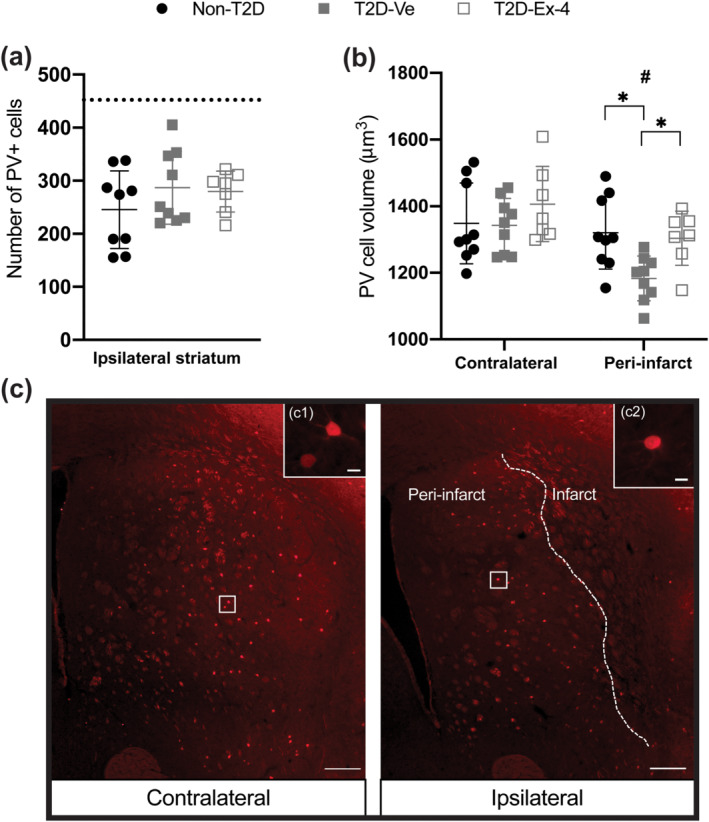
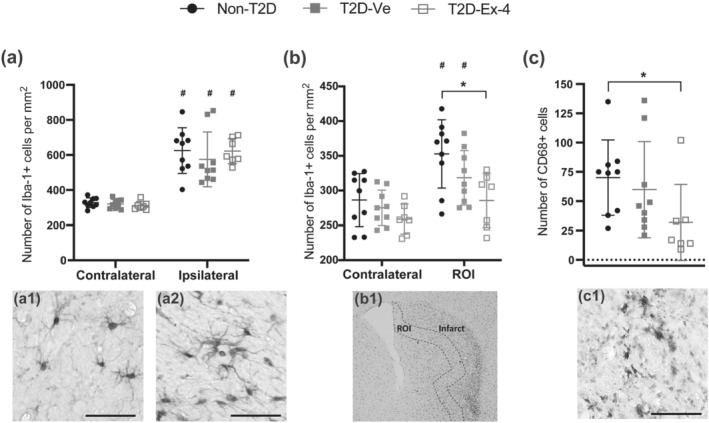
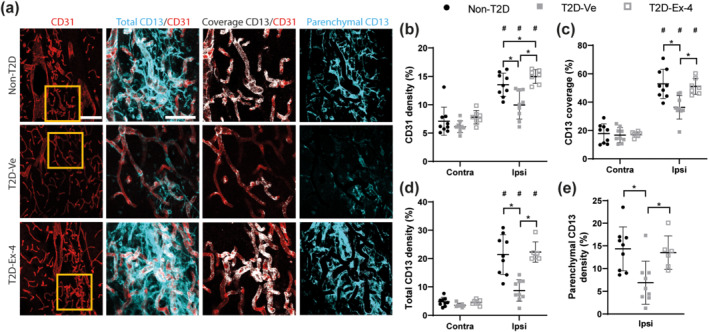
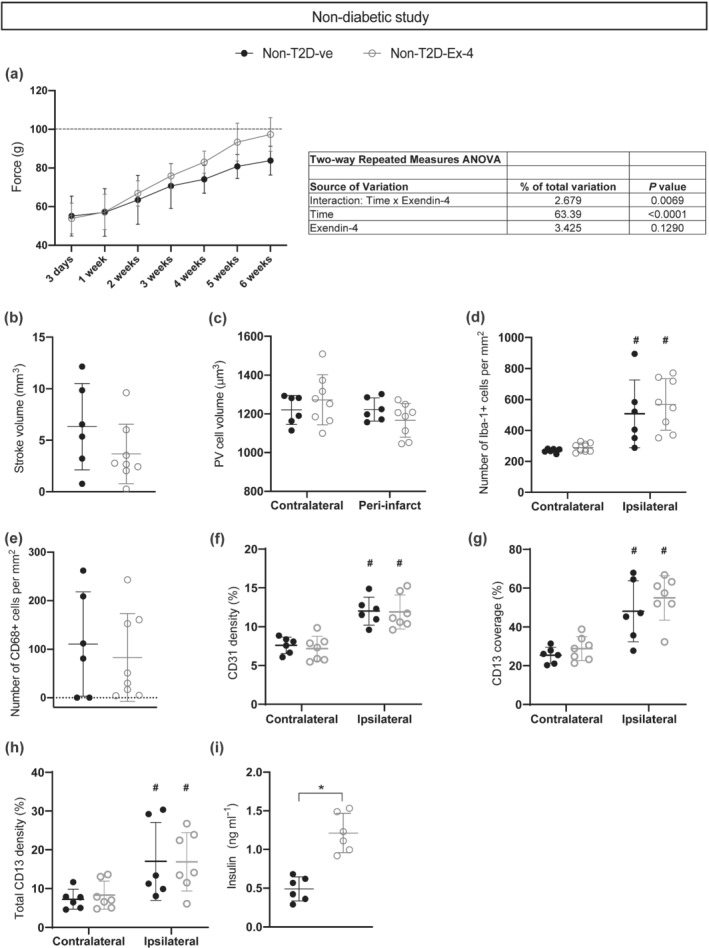
Key results: Exendin-4 normalised T2D-induced impairment of forepaw grip strength recovery in correlation with normalised glycaemia and insulin sensitivity. Moreover, exendin-4 counteracted T2D-induced atrophy of parvalbumin+ interneurons and decreased microglia activation. Finally, exendin-4 normalised density and pericyte coverage of micro-vessels and restored fibrotic scar formation in T2D mice. In non-T2D mice, the exendin-4-mediated recovery was minor.
Conclusion and implications: Chronic GLP-1 receptor activation mediates post-stroke functional recovery in T2D mice by normalising glucose metabolism and improving neuroplasticity and vascular remodelling in the recovery phase. The results warrant clinical trial of GLP-1 receptor agonists for rehabilitation after stroke in T2D.
Linked articles: This article is part of a themed issue on GLP1 receptor ligands (BJP 75th Anniversary). To view the other articles in this section visit http://onlinelibrary.wiley.com/doi/10.1111/bph.v179.4/issuetoc.
Keywords: GLP-1R agonist; T2D; fibrotic scar; neurological recovery; stroke; vascular remodelling.
© 2021 The Authors. British Journal of Pharmacology published by John Wiley & Sons Ltd on behalf of British Pharmacological Society.
Conflict of interest statement
T.N. has received unrestricted grants from AstraZeneca and consultancy fees from Boehringer Ingelheim, Eli Lilly, Novo Nordisk, Merck and Sanofi‐Aventis. The other authors declare that they have no competing interests.
Figures
Similar articles
-
Exendin-4 improves cerebral ischemia by relaxing microvessels, rapidly increasing cerebral blood flow after reperfusion.Basic Res Cardiol. 2025 Apr;120(2):423-441. doi: 10.1007/s00395-025-01096-y. Epub 2025 Mar 23. Basic Res Cardiol. 2025. PMID: 40121575
-
Obesity-induced type 2 diabetes impairs neurological recovery after stroke in correlation with decreased neurogenesis and persistent atrophy of parvalbumin-positive interneurons.Clin Sci (Lond). 2019 Jul 1;133(13):1367-1386. doi: 10.1042/CS20190180. Print 2019 Jul 15. Clin Sci (Lond). 2019. PMID: 31235555
-
Regulation of Glycemia in the Recovery Phase After Stroke Counteracts the Detrimental Effect of Obesity-Induced Type 2 Diabetes on Neurological Recovery.Diabetes. 2020 Sep;69(9):1961-1973. doi: 10.2337/db20-0095. Epub 2020 Jun 15. Diabetes. 2020. PMID: 32540876
-
The role of glia in the physiology and pharmacology of glucagon-like peptide-1: implications for obesity, diabetes, neurodegeneration and glaucoma.Br J Pharmacol. 2022 Feb;179(4):715-726. doi: 10.1111/bph.15683. Epub 2021 Nov 23. Br J Pharmacol. 2022. PMID: 34519040 Free PMC article. Review.
-
Glucagon-like peptide-1 (GLP-1) receptor agonists and their cardiovascular benefits-The role of the GLP-1 receptor.Br J Pharmacol. 2022 Feb;179(4):659-676. doi: 10.1111/bph.15462. Epub 2021 May 6. Br J Pharmacol. 2022. PMID: 33764504 Free PMC article. Review.
Cited by
-
Exendin-4 improves cerebral ischemia by relaxing microvessels, rapidly increasing cerebral blood flow after reperfusion.Basic Res Cardiol. 2025 Apr;120(2):423-441. doi: 10.1007/s00395-025-01096-y. Epub 2025 Mar 23. Basic Res Cardiol. 2025. PMID: 40121575
-
The Pre-Stroke Induction and Normalization of Insulin Resistance Respectively Worsens and Improves Functional Recovery.Int J Mol Sci. 2023 Feb 16;24(4):3989. doi: 10.3390/ijms24043989. Int J Mol Sci. 2023. PMID: 36835405 Free PMC article.
-
Diet-induced weight loss in obese/diabetic mice normalizes glucose metabolism and promotes functional recovery after stroke.Cardiovasc Diabetol. 2021 Dec 22;20(1):240. doi: 10.1186/s12933-021-01426-z. Cardiovasc Diabetol. 2021. PMID: 34937562 Free PMC article.
-
Glucagon-like peptide-1 receptor modulates cerebrospinal fluid secretion and intracranial pressure in rats.Fluids Barriers CNS. 2025 Apr 24;22(1):41. doi: 10.1186/s12987-025-00652-x. Fluids Barriers CNS. 2025. PMID: 40275284 Free PMC article.
-
Effect of Diabetes on Post-stroke Recovery: A Systematic Narrative Review.Front Neurol. 2021 Dec 14;12:747878. doi: 10.3389/fneur.2021.747878. eCollection 2021. Front Neurol. 2021. PMID: 34970205 Free PMC article.
References
-
- Alexander S. P. H., Kelly E., Mathie A., Peters J. A., Veale E. L., Armstrong J. F., Faccenda E., Harding S. D., Pawson A. J., Sharman J. L., Southan C., Buneman O. P., Cidlowski J. A., Christopoulos A., Davenport A. P., Fabbro D., Spedding M., Striessnig J., Davies J. A., … Wong S. S. (2019). The Concise Guide to PHARMACOLOGY 2019/20: Introduction and Other Protein Targets. British Journal of Pharmacology, 176(S1), 10.1111/bph.14747 - DOI - PMC - PubMed
-
- Alexander, S. P. H. , Roberts, R. E. , Broughton, B. R. S. , Sobey, C. G. , George, C. H. , Stanford, S. C. , Cirino, G. , Docherty, J. R. , Giembycz, M. A. , Hoyer, D. , Insel, P. A. , Izzo, A. A. , Ji, Y. , MacEwan, D. J. , Mangum, J. , Wonnacott, S. , & Ahluwalia, A. (2018). Goals and practicalities of immunoblotting and immunohistochemistry: A guide for submission to the British Journal of Pharmacology . British Journal of Pharmacology, 175, 407–411. 10.1111/bph.14112 - DOI - PMC - PubMed
-
- Alfayez, O. M. , Almohammed, O. A. , Alkhezi, O. S. , Almutairi, A. R. , & Al Yami, M. S. (2020). Indirect comparison of glucagon like peptide‐1 receptor agonists regarding cardiovascular safety and mortality in patients with type 2 diabetes mellitus: Network meta‐analysis. Cardiovascular Diabetology, 19, 96. 10.1186/s12933-020-01070-z - DOI - PMC - PubMed
Publication types
MeSH terms
Substances
LinkOut - more resources
Full Text Sources
Other Literature Sources
Medical
