

hu.MAP 2.0: integration of over 15,000 proteomic experiments builds a global compendium of human multiprotein assemblies
- PMID: 33973408
- PMCID: PMC8111494
- DOI: 10.15252/msb.202010016
hu.MAP 2.0: integration of over 15,000 proteomic experiments builds a global compendium of human multiprotein assemblies
Abstract
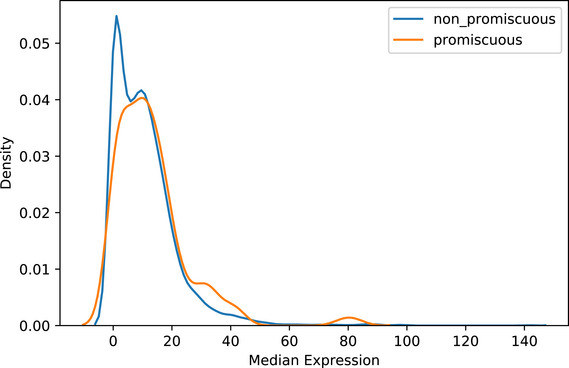
A general principle of biology is the self-assembly of proteins into functional complexes. Characterizing their composition is, therefore, required for our understanding of cellular functions. Unfortunately, we lack knowledge of the comprehensive set of identities of protein complexes in human cells. To address this gap, we developed a machine learning framework to identify protein complexes in over 15,000 mass spectrometry experiments which resulted in the identification of nearly 7,000 physical assemblies. We show our resource, hu.MAP 2.0, is more accurate and comprehensive than previous state of the art high-throughput protein complex resources and gives rise to many new hypotheses, including for 274 completely uncharacterized proteins. Further, we identify 253 promiscuous proteins that participate in multiple complexes pointing to possible moonlighting roles. We have made hu.MAP 2.0 easily searchable in a web interface (http://humap2.proteincomplexes.org/), which will be a valuable resource for researchers across a broad range of interests including systems biology, structural biology, and molecular explanations of disease.
Keywords: data integration; human protein complexes; mass spectrometry; moonlighting proteins.
© 2021 The Authors. Published under the terms of the CC BY 4.0 license.
Conflict of interest statement
The authors declare that they have no conflict of interest.
Figures
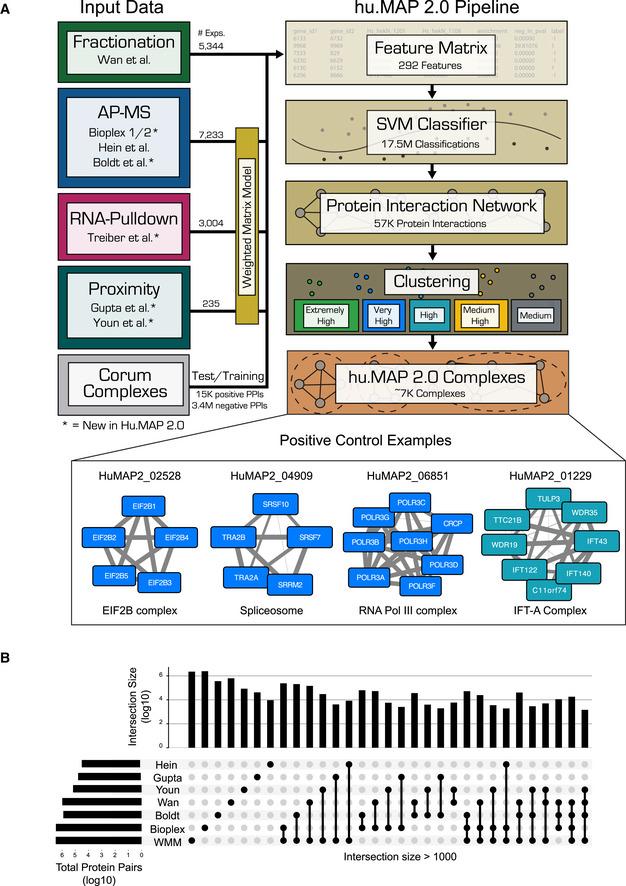
Graphical description of computational pipeline to integrate > 15,000 mass spectrometry experiments. Number of experiments used is listed next to each technique (see also Table 1). A Support Vector Machine (SVM) classifier was trained using numerical measures (i.e., features) on pairs of proteins calculated from original mass spectrometry data and training labels from literature‐curated complexes (CORUM). The classifier was then used to construct a protein interaction network by calculating a confidence score for all pairs of proteins for their propensity to interact. Clustering parameters were then learned from training complexes, and five final sets of clusters were chosen ranked in order of confidence from “Extremely High” to “Medium”. The union of these selected clusterings represents the final set of hu.MAP 2.0 complexes. Networks of previously known protein complexes identified by this pipeline which were not in the training set of complexes are shown as positive control examples.
“UpSet” plot (Lex et al, 2014) displaying the intersections of protein pairs for all integrated datasets. Each set of connected black dots represents the intersection of the respective datasets. Vertical bar plot displays protein pair count of intersection. Light gray dots are datasets not included in the intersection. Single unconnected black dots represent protein pairs that are only present in a single dataset. Horizontal bar plot represents total protein pair count in each dataset. The plot shows the Weighted Matrix Model (single black WMM dot) provides additional information for many pairs of proteins (> 2.2 × 10E6) that would be limited otherwise.
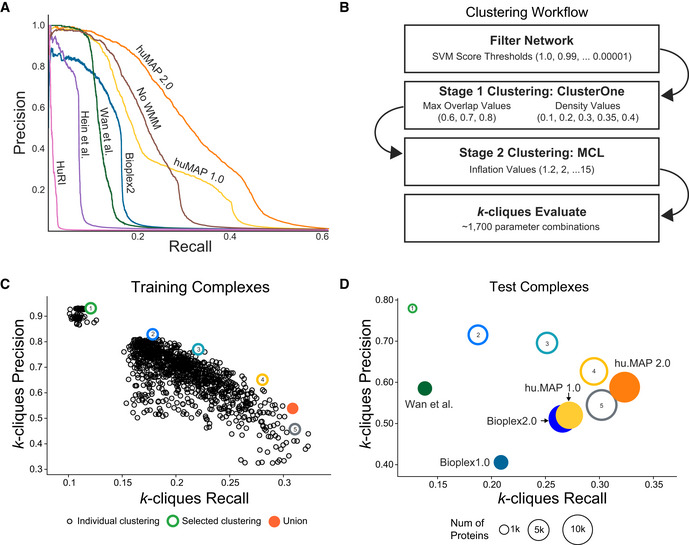
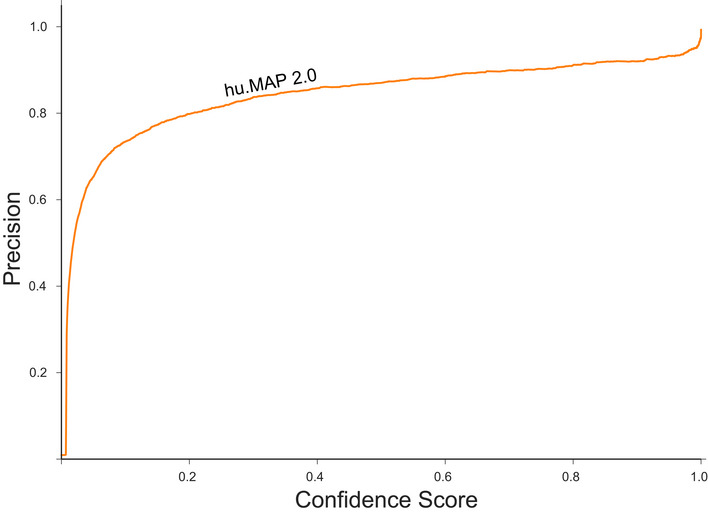
Precision‐Recall (PR) plot evaluated on a test (leave‐out) set of literature‐curated co‐complex pairwise protein interactions. The plot shows hu.MAP 2.0 is more accurate and comprehensive than previous published datasets. The plot also evaluates the performance of predictions without the Weighted Matrix Model (WMM) and shows the WMM substantially improves performance.
Clustering workflow used to identify protein complexes in hu.MAP 2.0 protein interaction network. The network is first filtered based on the confidence score produced by the Support Vector Machine (SVM). The filtered network is then clustered using a two‐stage approach, clustering first using ClusterOne, and then further clustering with MCL. The resulting clusters are then evaluated using the k‐clique method (see Materials and Methods) on training complexes. Approximately 1,700 parameter combinations were evaluated, each producing a unique set of clusters, sweeping SVM score filter thresholds, and clustering parameters (i.e., ClusterOne Max Overlap, ClusterOne Density, and MCL Inflation).
k‐clique Precision‐Recall (kPR) scatter plot of 1,700 clustering parameter sets. Five clusterings (colored hollow circles) were selected representing varying degrees of confidence balancing the trade‐off between precision and recall. The five selected clusterings were combined as a final set of clusters (orange filled circle).
kPR scatter plot of hu.MAP 2.0 complexes (orange filled circle) and other published complex maps (colored filled circles) evaluated on a test set of literature‐curated complexes. hu.MAP 2.0 complexes increase in both precision and recall relative to other maps. Also plotted are the five sets of complexes at different levels of confidence (colored hollow circles) demonstrating consistency between the level of confidence determined from training set (B) and test set.
- A, B
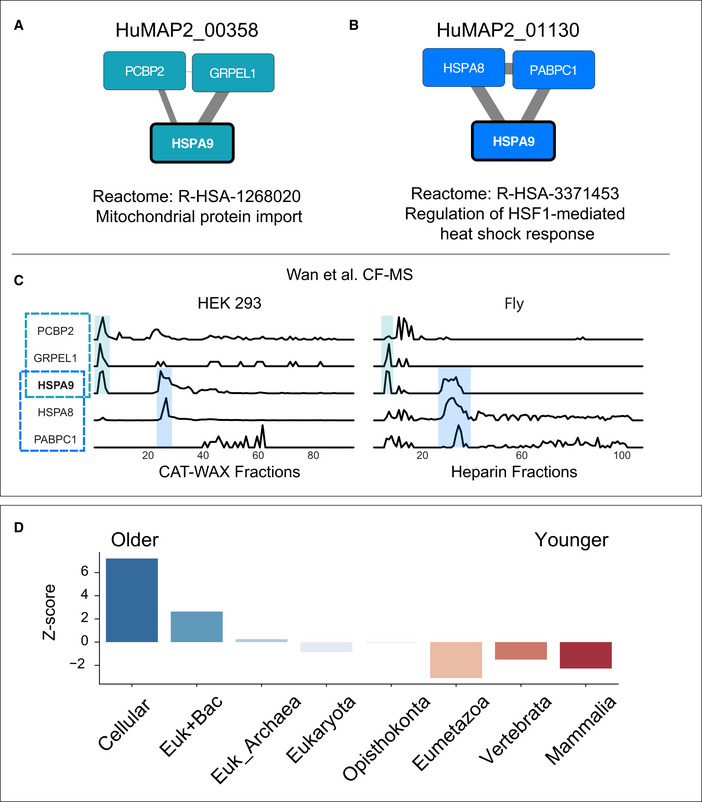
Multifunctional protein HSPA9 participates in two distinct complexes, HuMAP2_00358 (A) and HuMAP2_01130 (B). HuMAP2_00358 (turquoise, “high” confidence) is enriched for Reactome annotation “Mitochondrial protein import”, a known function of HSPA9. HuMAP2_01130 (blue, “very high” confidence) is enriched for Reactome annotation “Regulation of HSF1‐mediated heat shock response”, another known function of HSPA9. Weight of network edges represent confidence of interactions.
- C
Sparkline elution profiles from two orthogonal biochemical fractionation experiments. HEK 293 cell lysate was separated using a mixed bed ion‐exchange column and Drosophila melanogaster embryo lysate was separated using a heparin column (Wan et al, 2015). HSPA9 elutes in two distinct peaks (shaded) which co‐elute with members of the two complexes. X‐axis represents fraction collected along biochemical separation. Y‐axis for each row represents observed protein abundance.
- D
Promiscuous proteins are older on average than single complex proteins. Z‐scores for each protein age group were determined by comparing the number of promiscuous proteins to a randomly sampled background set consisting of non‐promiscuous proteins (i.e., participating in only one complex).
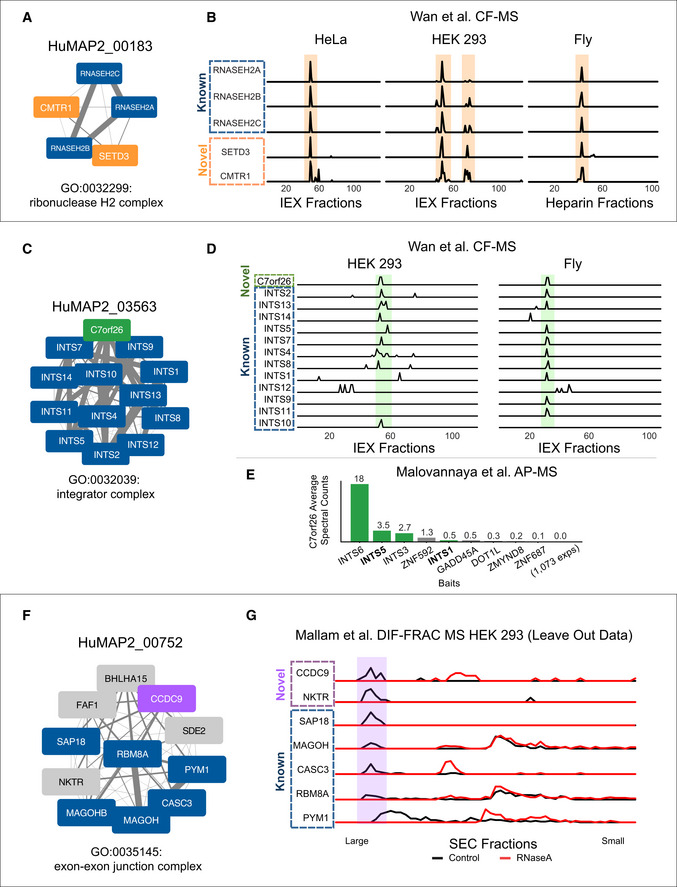
SETD3 and CMTR1 are identified as co‐complex interactors with the Ribonuclease H2 complex which provides a possible mechanistic explanation for their role in viral infection.
Sparkline elution profiles from multiple orthogonal co‐fractionation experiments demonstrate a strong degree of co‐elution among subunits in the SETD3‐CMTR1‐RNAse H2 complex. Weight of network edges represents confidence of interactions. X‐axis represents fraction collected along biochemical separation. Y‐axis for each row represents observed protein abundance.
The uncharacterized protein, C7orf26, is identified as part of the Integrator complex.
Sparkline elution profiles show a high degree of correlation between C7orf26 and subunits of the Integrator complex from multiple orthogonal co‐fractionation experiments.
The association of C7orf26 and Integrator complex is additionally supported by affinity purification mass spectrometry (AP‐MS) experiment where C7orf26 is pulled down with Integrator subunit baits.
The uncharacterized protein, CCDC9, is identified as co‐complex with the exon–exon junction complex (EJC), a ribonucleoprotein complex involved in splicing.
Sparkline elution profiles from the independently collected RNA DIF‐FRAC size exclusion chromatography (SEC) experiment show CCDC9 co‐elutes with known subunits of the EJC when RNA is present (black). The elution profiles also show CCDC9 is sensitive to RNAse A treatment (shift of elution peak between black and red profiles) as are the subunits of the EJC further supporting CCDC9's participation in this known ribonucleoprotein complex.
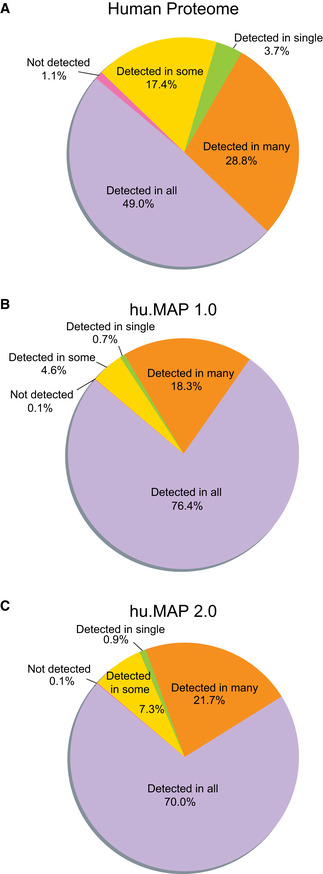
Coverage of all human proteins shows a broad distribution of proteins classified into a range of specificity classes, from detected in all tissues and cells to detected in only a single tissue or cell type.
Coverage of hu.MAP 1.0 proteins show a narrower distribution of proteins classified into specificity classes with the majority of proteins detected in many or all tissues and cell types. This suggests hu.MAP 1.0 represented the core cellular machinery.
Coverage of hu.MAP 2.0 proteins show a distribution representative of the core cellular machinery shared among all or many tissue and cell types but also shows an increase in cell type specificity with gains in proteins that are only detected in some tissues/cell types.
References
-
- Alberts B (1998) The cell as a collection of protein machines: preparing the next generation of molecular biologists. Cell 92: 291–294 - PubMed
-
- Baltz A, Munschauer M, Schwanhäusser B, Vasile A, Murakawa Y, Schueler M, Youngs N, Penfold‐Brown D, Drew K, Milek M et al (2012) The mRNA‐bound proteome and its global occupancy profile on protein‐coding transcripts. Mol Cell 46: 674–690 - PubMed
Publication types
MeSH terms
Substances
Grants and funding
LinkOut - more resources
Full Text Sources
Other Literature Sources
Molecular Biology Databases
Miscellaneous
