

Ventilation Assessment by Carbon Dioxide Levels in Dental Treatment Rooms
- PMID: 33973494
- PMCID: PMC8120146
- DOI: 10.1177/00220345211014441
Ventilation Assessment by Carbon Dioxide Levels in Dental Treatment Rooms
Abstract
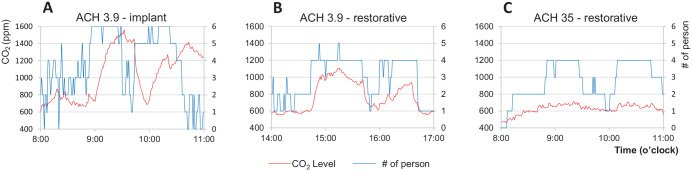
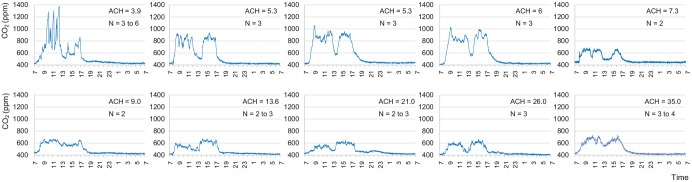
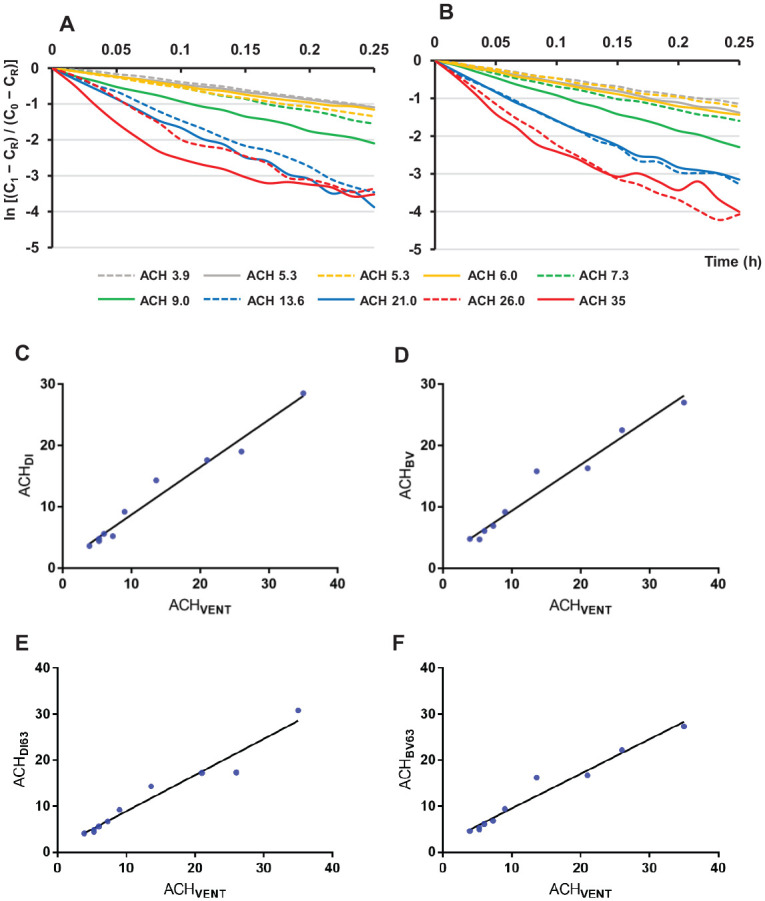
It is important for dental care professionals to reliably assess carbon dioxide (CO2) levels and ventilation rates in their offices in the era of frequent infectious disease pandemics. This study was to evaluate CO2 levels in dental operatories and determine the accuracy of using CO2 levels to assess ventilation rate in dental clinics. Mechanical ventilation rate in air change per hour (ACHVENT) was measured with an air velocity sensor and airflow balancing hood. CO2 levels were measured in these rooms to analyze factors that contributed to CO2 accumulation. Ventilation rates were estimated using natural steady-state CO2 levels during dental treatments and experimental CO2 concentration decays by dry ice or mixing baking soda and vinegar. We compared the differences and assessed the correlations between ACHVENT and ventilation rates estimated by the steady-state CO2 model with low (0.3 L/min, ACHSS30) or high (0.46 L/min, ACHSS46) CO2 generation rates, by CO2 decay constants using dry ice (ACHDI) or baking soda (ACHBV), and by time needed to remove 63% of excess CO2 generated by dry ice (ACHDI63%) or baking soda (ACHBV63%). We found that ACHVENT varied from 3.9 to 35.0 in dental operatories. CO2 accumulation occurred in rooms with low ventilation (ACHVENT ≤6) and overcrowding but not in those with higher ventilation. ACHSS30 and ACHSS46 correlated well with ACHVENT (r = 0.83, P = 0.003), but ACHSS30 was more accurate for rooms with low ACHVENT. Ventilation rates could be reliably estimated using CO2 released from dry ice or baking soda. ACHVENT was highly correlated with ACHDI (r = 0.99), ACHBV (r = 0.98), ACHDI63% (r = 0.98), and ACHBV63% (r = 0.98). There were no statistically significant differences between ACHVENT and ACHDI63% or ACHBV63%. We conclude that ventilation rates could be conveniently and accurately assessed by observing the changes in CO2 levels after a simple mixing of household baking soda and vinegar in dental settings.
Keywords: COVID-19; air filter; baking soda; dentistry; indoor air quality; pathogen transmission.
Conflict of interest statement
Figures
References
-
- ASHRAE. 2007. Ventilation for acceptable indoor air quality. ANSI/ASHRAE Standard 62.1-2007. Atlanta (GA): ASHRAE. p. 1–48.
-
- ASHRAE. 2017. Measurement, testing, adjusting and balancing of building HVAC systems. ASHRAE/ANSI Standard 111-2008 (RA 2017). Atlanta (GA): ASHRAE.
-
- Azuma K, Kagi N, Yanagi U, Osawa H. 2018. Effects of low-level inhalation exposure to carbon dioxide in indoor environments: a short review on human health and psychomotor performance. Environ Int. 121(Pt 1):51–56. - PubMed
-
- Cheng PL, Li X. 2014. Air change rate measurements using tracer gas carbon dioxide from dry ice. Int J Vent. 13(3):235–246.
Publication types
MeSH terms
Substances
LinkOut - more resources
Full Text Sources
Other Literature Sources
