. 2021 May 11:10:e59696.
doi: 10.7554/eLife.59696.

Limited inhibition of multiple nodes in a driver network blocks metastasis

Affiliations

Limited inhibition of multiple nodes in a driver network blocks metastasis

Ali Ekrem Yesilkanal et al. Elife. .

Abstract

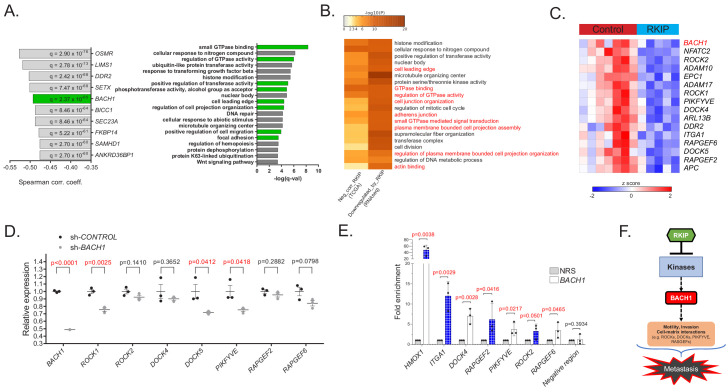
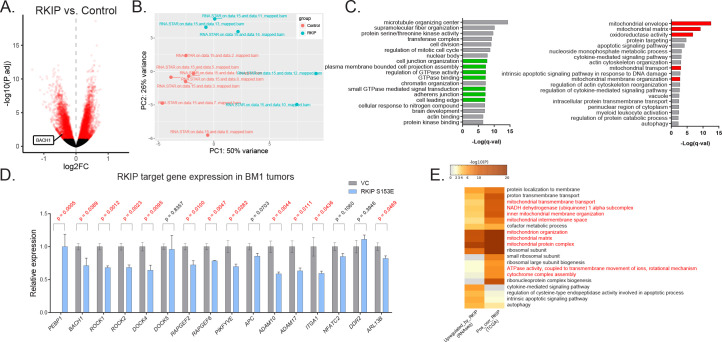
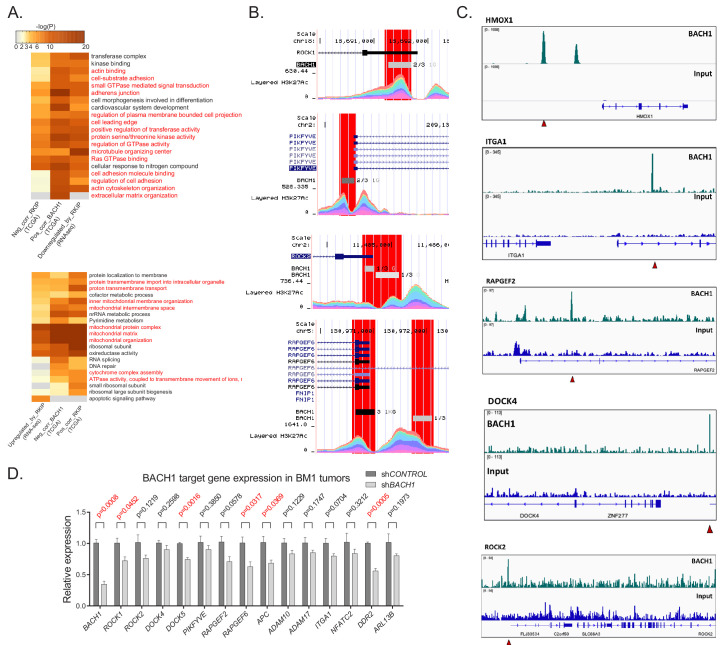
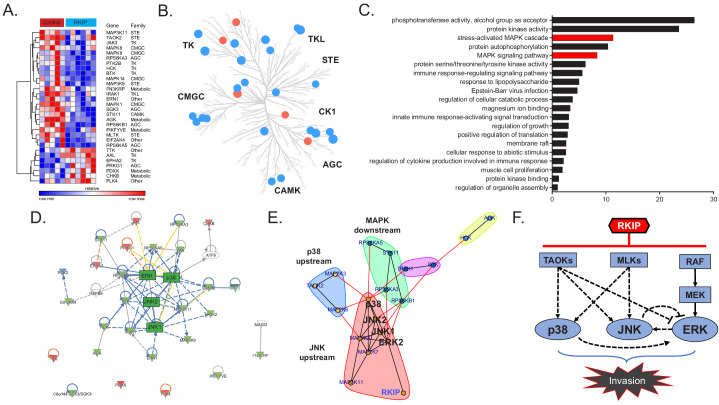
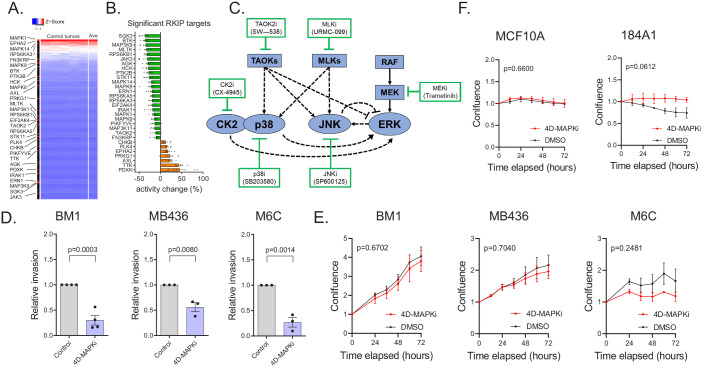
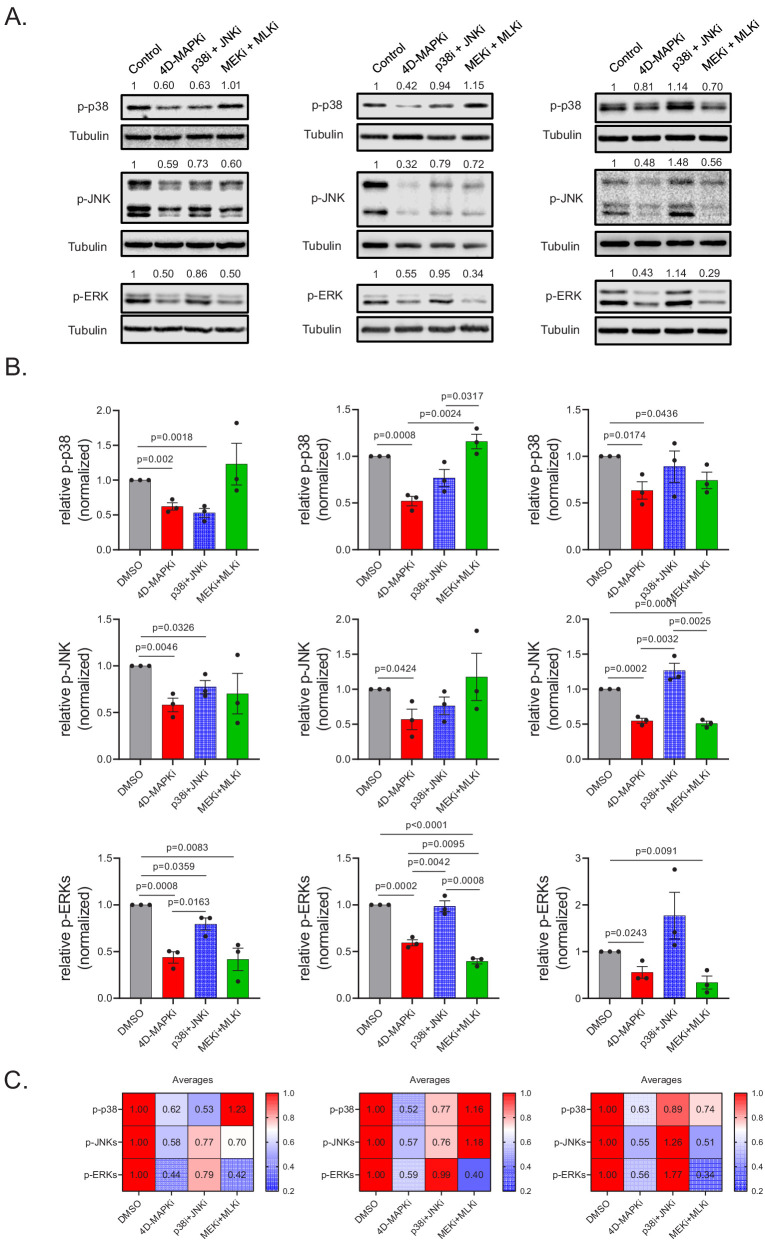
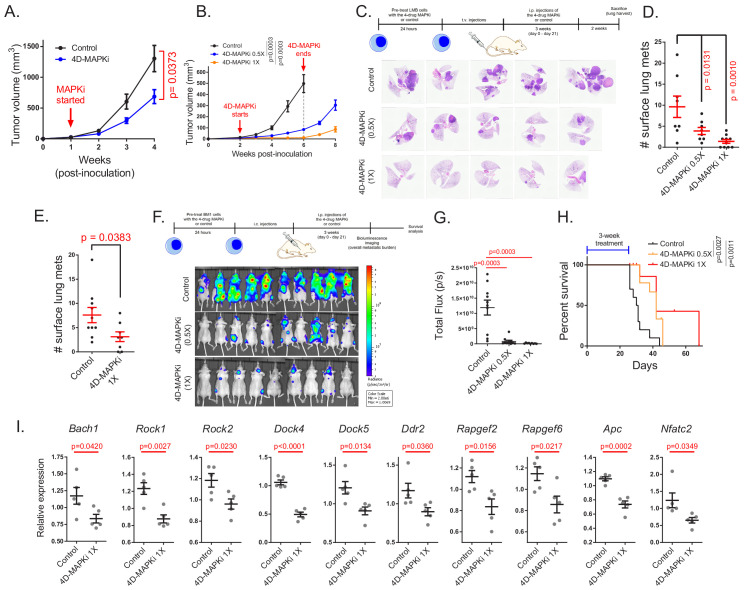
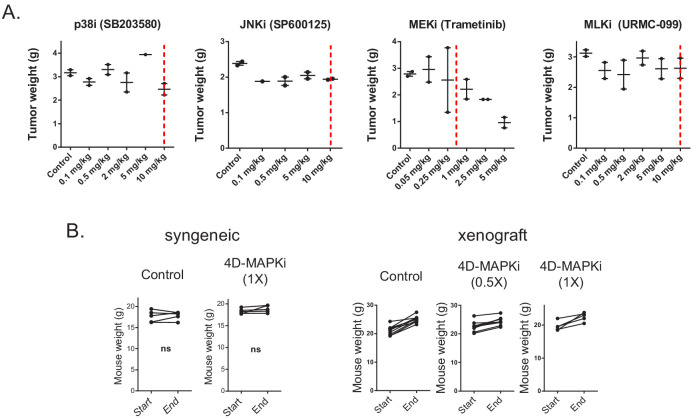
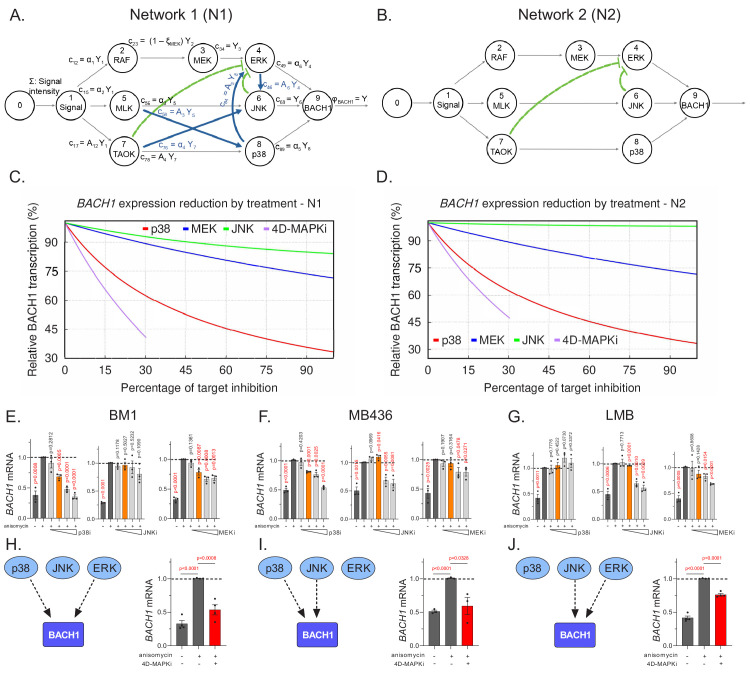
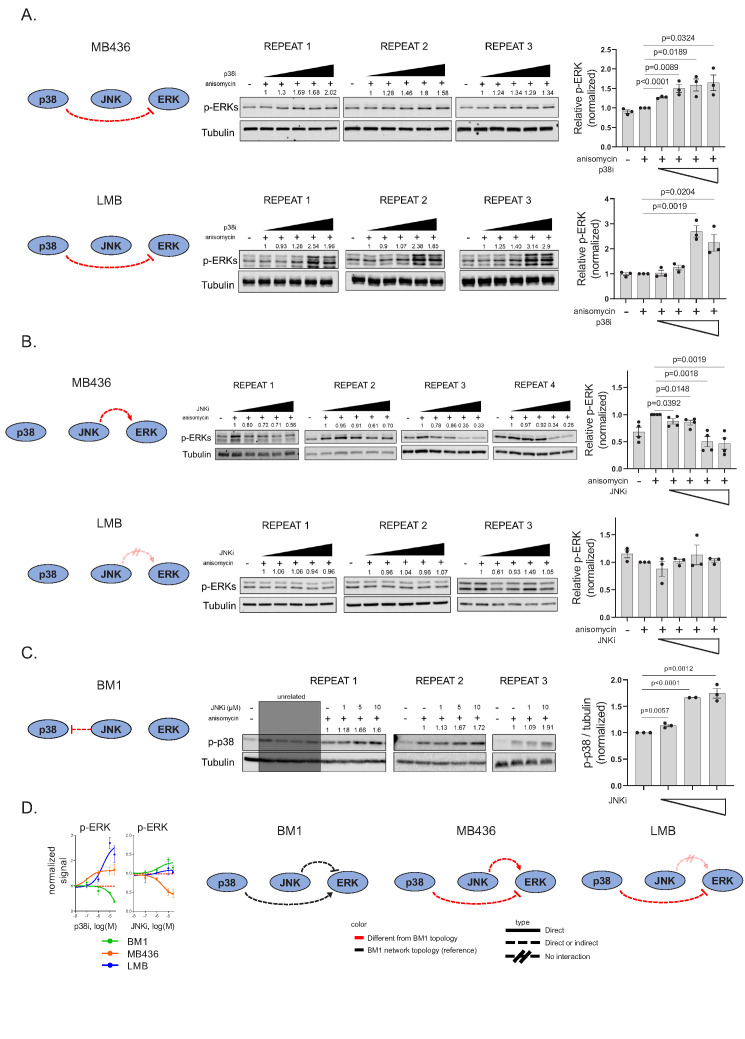
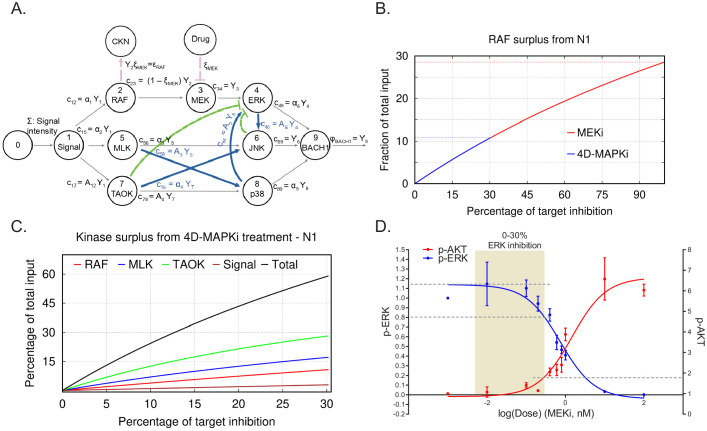
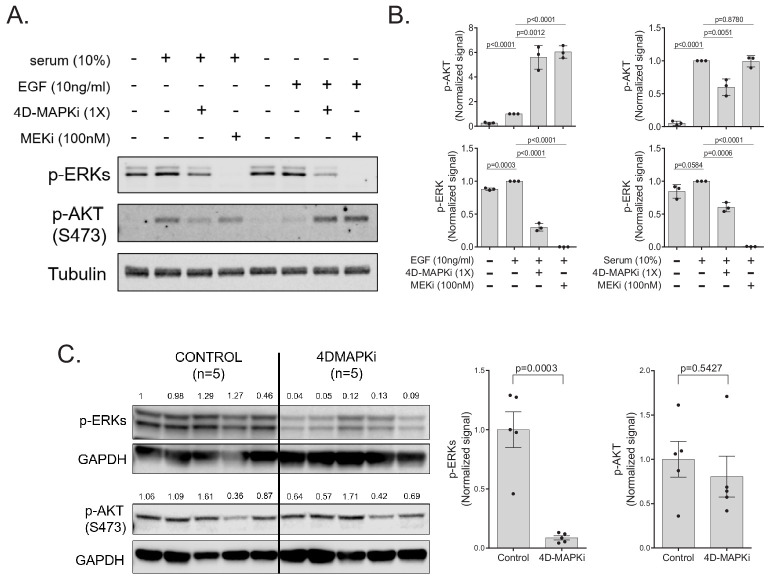
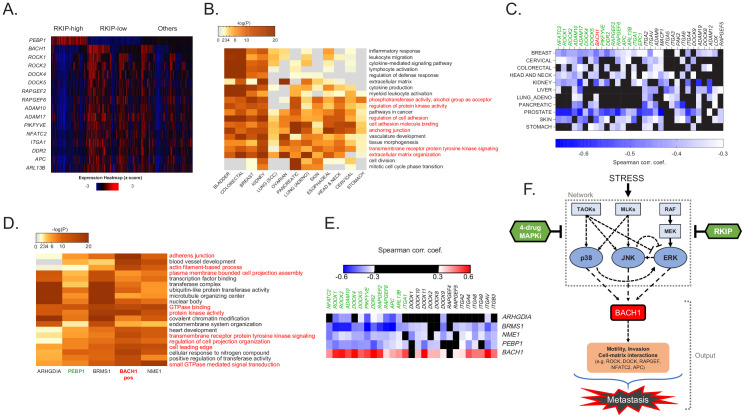
Metastasis suppression by high-dose, multi-drug targeting is unsuccessful due to network heterogeneity and compensatory network activation. Here, we show that targeting driver network signaling capacity by limited inhibition of core pathways is a more effective anti-metastatic strategy. This principle underlies the action of a physiological metastasis suppressor, Raf Kinase Inhibitory Protein (RKIP), that moderately decreases stress-regulated MAP kinase network activity, reducing output to transcription factors such as pro-metastastic BACH1 and motility-related target genes. We developed a low-dose four-drug mimic that blocks metastatic colonization in mouse breast cancer models and increases survival. Experiments and network flow modeling show limited inhibition of multiple pathways is required to overcome variation in MAPK network topology and suppress signaling output across heterogeneous tumor cells. Restricting inhibition of individual kinases dissipates surplus signal, preventing threshold activation of compensatory kinase networks. This low-dose multi-drug approach to decrease signaling capacity of driver networks represents a transformative, clinically relevant strategy for anti-metastatic treatment.

Keywords: BACH1; MAPK; cancer biology; drug combinations; human; mathematical modeling; metastasis; mouse; raf kinase inhibitory protein.


Conflict of interest statement

AY, DY, AV, PT, AS, LN, JL, XX, SS, CD, LR, ES, TS, CF, EG, GJ, AR No competing interests declared, MR This research is also the subject of a pending US patent application # 17/048,282.

Figures

Figure 1.
Figure 1.. RKIP regulates a clinically relevant set of motility-related genes driven by the pro-metastatic transcription factor BACH1.
(A) Left panel: Top 10 genes negatively correlated with RKIP (PEBP1) gene expression in TCGA BRCA samples (provisional, n = 1100), ranked by Spearman correlation coefficient. Right panel: Gene sets enriched in genes negatively correlated with RKIP in TCGA BRCA set. (B) Gene sets commonly enriched in genes negatively correlated with RKIP in TCGA BRCA set and genes downregulated by RKIP in the RNA-seq study. (C) A set of differentially expressed motility genes and BACH1 gene expression in control (n = 7) vs. RKIP-expressing (n = 5) BM1 tumors. (D) qRT-PCR analysis of control (n = 3) and shBACH1-expressing (n = 3) BM1 tumors, demonstrating downregulation of motility gene expression when BACH1 levels are reduced. Student’s t-test, two-tailed. (E) Chromatin immuno-precipitation analysis of BACH1 binding in the promoter regions of the motility genes in BM1 cells. Mean ± s.e.m of three independent experiments. Student’s t-test, one-tailed. NRS, normal rabbit serum (F) Summary diagram showing regulation of BACH1 and motility gene expression by RKIP. For the source data, see Figure 1—source data 1.
Figure 1—figure supplement 1.
Figure 1—figure supplement 1.. Transcriptional regulation of motility-related genes by RKIP.
(A) Volcano plot highlighting the differentially expressed genes in red, including BACH1, between n = 7 control and n = 5 RKIP-expressing BM1 tumors. FDR cutoff of 0.1. (B) Principle component analysis of n = 7 BM1-control and n = 5 BM1-RKIP tumors used in the RNA-seq analysis. (C) Gene set enrichment analysis by Metascape of genes downregulated (left) and upregulated (right) by RKIP in the RNA-seq data. FDR corrected p-values are ranked in -log(10) scale. Motility and adhesion related genes are highlighted in green. Mitochondria-related gene sets are highlighted in red. (D) A set of differentially expressed motility genes and BACH1 expression determined by qRT-PCR in control BM1 tumors (n = 5) vs. BM1 tumors expressing a more robust version of RKIP (RKIP S153E mutant) (n = 4). This is a second independent in vivo experiment supporting the tumor RNA-seq data presented in A-C. Two-tailed t-test with respect to the control sample. (E) Gene sets commonly enriched in genes positively correlated with RKIP in TCGA BRCA set (provisional set, n = 1100), as well as genes upregulated by RKIP in the RNA-seq analysis.
Figure 1—figure supplement 2.
Figure 1—figure supplement 2.. Transcription of metastasis-related RKIP target genes is mediated in part by BACH1.
(A) Gene sets commonly enriched in genes negatively correlated with RKIP (PEBP1) and positively correlated with BACH1 in TCGA BRCA set, as well as genes downregulated by RKIP in the RNA-seq analysis (upper panel). Gene sets commonly enriched in genes positively correlated with RKIP and negatively correlated with BACH1 in TCGA BRCA set, as well as genes upregulated by RKIP in the RNA-seq analysis (lower panel). (B) BACH1 binding in the promoter region of RKIP target motility genes in ENCODE CHIP-seq data. (C) ChIP-seq analysis of BM1 cells in vitro, showing enrichment of BACH1 binding in proximal or distal regions of the motility gene promoters. HMOX1 gene is a known BACH1 target that is used as a positive control for the ChIP-seq experiment. Red triangles point at the BACH1 binding enrichment site. (D) Expression of RKIP target motility genes in BACH1-deficient BM1 tumors (n = 3) with respect to wild-type tumors (n = 3) in a second independent in vivo experiment supporting the data presented in Figure 1D. Two-tailed student’s t-test, with respect to the control (shCONTROL).
Figure 2.
Figure 2.. RKIP reprograms tumors by reducing signaling capacity of a network instead of targeting a single node.
(A) Multiplexed inhibitor beads – mass spectrometry (MIB-MS) analysis of n = 5 control and n = 6 RKIP-expressing BM1 tumors, showing 23 kinases with reduced activity and seven kinases with enhanced activity by exogenous RKIP expression. Student’s t-test, p<0.05. (B) Kinome tree displaying the distribution of kinases targeted by RKIP across different families of kinases. Blue: activity reduced by RKIP (n = 23), Red: activity enhanced by RKIP (n = 7). (C) Gene set enrichment analysis of the 23 negatively regulated kinases by Metascape. Stress-induced mitogen activated protein kinase (MAPK) related gene sets are highlighted in red. (D), Ingenuity Pathway Analysis (IPA) of the RKIP target kinases centered around MAPKs p38, JNK, and ERK. (E) Direct protein-protein interaction network and community analysis showing the core of the RKIP kinase network. (F) Diagram summarizing the interactions within the RKIP-regulated stress MAPK network in anisomycin-induced BM1 cells. Kinase interactions are determined by using small molecule inhibitors or siRNAs against the kinases in the network in three or more independent dose-response experiments with similar results (also see Figure 2—source data 2). The TAOK-p38 interaction is observed in cells treated with a cocktail of siRNAs against all three TAOKs (siCombo), whereas TAOK-JNK and TAOK-ERK interactions were observed by siRNAs against TAOK1 and TAOK2, respectively. For the source data, see Figure 2—source data 1.
Figure 3.
Figure 3.. A low-dose four-drug combination reduces MAPK network signaling capacity and suppresses tumor cell invasion without altering growth.
(A) Heatmap demonstrating the distribution of kinases targeted by RKIP in an activity ranked list of all 248 kinases captured. Top-to-bottom represents high-to-low ranking of MIB-captured kinases in the control cases (n = 7). (B) Percent change in kinase activity induced by RKIP in RKIP-expressing BM1 tumors with respect to the average kinase activity in the control samples. The kinases shown are the same kinases significantly regulated by RKIP according to the MIB-MS data in Figure 2A. (C) Diagram of the network used for modeling and the small molecule inhibitors used in the high-throughput invasion assays for potential drug combinations. (D,) Chemotactic invasion assay showing that the four-drug MAPK inhibitor combination (4D-MAPKi) blocks invasion of human and mouse TNBC cells lines. Graphs represent results from three or more independent experiments as mean ± s.e.m. Two-tailed student’s t-test was used for statistical analysis. (E) 3D proliferation assay showing that 4D-MAPKi does not significantly affect the growth of TNBC cell lines. Growth curves from at least three independent experiments are represented as fold change in confluence with respect to the confluence of the cells at the time of plating, which is set to "1.0" for each experiment. For the statistical test, GraphPad Prism 9.1.0 Software’s mixed effects model (equivalent of two-way repeated measures ANOVA that allows for missing values) was used. (F) 2D proliferation assays showing that 4D-MAPKi is not toxic to immortalized human mammary epithelial cell lines, MCF10A and 184A1. Data depicted as a summary of three independent experiments. Two-way ANOVA test was used for statistical analysis. For the source data, see Figure 3—source data 1 and Figure 3—source data 3.
Figure 3—figure supplement 1.
Figure 3—figure supplement 1.. 4D-MAPKi is more effective than the dual combinations in inhibiting all three MAPKs across multiple cell lines under anisomycin-induced stress conditions.
(A) Western blots showing p38, JNK, and ERK signaling in BM1 (left), MB436 (middle), and LMB (right) cells treated with 4D-MAPKi, or the dual combinations p38i + JNKi or MEKi + MLKi. The figures are representative of three independent experiments in each cell line. (B) Quantification of the western blots represented in A. Relative p-p38, p-JNK, and p-ERK signal is plotted with respect the non-treated control cells from three independent experiments. Statistical significance between different experimental groups was determined by pair-wise comparison using two-tailed student’s t-test. (C) The heatmaps show the relative average densitometry intensity for p-p38, p-JNK, and p-ERKs from all three independent experiments conducted in each cell line, with respect to the non-treated control sample which is set to 1.
Figure 4.
Figure 4.. The four-drug combination suppresses metastasis, increases survival and inhibits expression of pro-metastatic motility genes.
(A), Effect of MAPKi treatment on the primary LMB tumor growth. Mean ± s.e.m. of n = 5 biological replicates per experimental group. Two-way ANOVA test. (B) Primary BM1 tumor growth in mice treated with 4D-MAPKi combination for 4 weeks. Mean ± s.e.m of n = 8 control tumors, n = 8 4D-MAPKi(0.5X) treated tumors, and n = 6 4D-MAPKi(1X) treated tumors. Two-way ANOVA test at week 6. (C) 4D-MAPKi combination reduces metastatic tumor burden in the lungs of LMB syngeneic mouse model of TNBC. H&E staining demonstrates the metastatic lesions in cross-sections of the lungs in mice treated with 1X (undiluted, n = 10 biological replicates) 4D-MAPKi, 0.5X (diluted, n = 8) 4D-MAPKi, or the control (vehicle, n = 8). (D) Quantification of the visible metastatic lesions on the lung surface. Mean ± s.e.m, one-way ANOVA test with Dunnett’s correction for multiple testing. (E) Tumor burden in the lungs of LMB syngeneic mice after 2 days (2 doses over 48 hr, on day 0 and day 1) of 4D-MAPKi treatment. Mean ± s.e.m. of n = 10 control tumors and n = 8 MAPKi(1X) treated tumors. Unpaired two-tailed student’s t-test. (F) BM1 metastatic tumor burden in the bones of athymic nude mice treated with 4D-MAPKi at 0.5X and 1X, or control. (G) Quantification of the metastatic burden in (F). Mean ± s.e.m. of n = 10 control, n = 10 diluted 0.5 × 4 D-MAPKi, and n = 9 undiluted 1 × 4 D-MAPKi. Two-tailed student’s t-test. (H) Overall survival of xenograft mice injected with BM1 cells via the intracardiac route after 3 weeks of 4D-MAPKi treatment. Log-rank (Mantel-Cox) test. (I) Expression of Bach1 and motility genes in LMB tumors treated with 4D-MAPKi. Mean ± s.e.m. of n = 5 biological replicates per experimental group. Two-tailed student’s t-test.
Figure 4—figure supplement 1.
Figure 4—figure supplement 1.. Effect of the individual MAPK inhibitor on tumor growth and their toxicity in combination.
(A) Dose-response experiments reveal that p38i, JNKi, and MLKi do not affect primary LMB tumor growth determined by final tumor weight in a syngeneic model at 10 mg/kg/day or lower. MEKi on the other hand, decreases tumor growth in a dose-dependent manner. Red dashed lines indicate the doses chosen to be used in four-drug combination in vivo. Biological replicates are shown as mean ± s.e.m. (B) Comparison of mouse weights before and after MAPKi treatment reveal no overall toxicity to the mice due to drug treatment in syngeneic or xenograft models. Paired t-test. ns: not significant.
Figure 5.
Figure 5.. Multi-drug combination inhibits different MAPK network topologies.
(A), The topology of the stress response of the core MAPK driver network activating BACH1 gene transcription, as output, in BM1 cells. This network topology, termed N1, is composed of multiple kinase signaling pathways responsible for activating BACH1. The nodes of the signaling network, represented by circles, are kinases within the network. The arrows directed toward nodes indicate the inflow from a signal or an active kinase at the upstream node. The product of a node, resulting from the interaction between the upstream signal and downstream kinases, is denoted by arrows leaving the node. The pathways are indicated by black arrows while the crosstalk between different pathways is denoted by blue and green arrows. The non-linear repression of one node by another is represented by the green lines with bars directed toward the repressed component. (B) A hypothetical BACH1 stress response driver network, denoted as N2, that has no crosstalk between its individual pathways. The interpretation of its symbols is the same as in A. (C) Graph depicting predicted downregulation of BACH1 following cell treatment with specific inhibitors relative to maximal stress-induced BACH1 gene transcription in cells with N1. The y axis shows the percentage of maximal BACH1 gene transcription, and the x axis denotes the percent inhibition of each kinase targeted by a drug or drug combo relative to the maximal inhibitor dose (set at 100% inhibition). Relative BACH1 gene transcription in response to p38i, MEKi, JNKi, or the 4D-MAPKi drug combo is indicated in red, blue, green, or purple. (D) Graph depicting predicted downregulation of BACH1 following cell treatment with specific inhibitors relative to maximal stress-induced BACH1 gene transcription in cells with N2. The y axis shows the percentage of maximal BACH1 gene transcription, and the x axis denotes the percent inhibition of each kinase targeted by a drug or drug combo relative to the maximal inhibitor dose (set at 100% inhibition). Relative BACH1 transcription in response to p38i, MEKi, JNKi, or the 4D-MAPKi drug combo is indicated in red, blue, green, or purple. (E–G) Single agent dose-response experiments demonstrating that BACH1 expression is activated by different MAPKs in different cell lines. Orange bars indicate the final dosage of an individual inhibitor used in 4D-MAPKi. (H–J) The network-targeting 4D-MAPKi is able to decrease BACH1 expression across all three cell lines even though BACH1 is regulated by a different set of MAPKs in each cell line. Left panels: Diagrams summarizing BACH1 regulation by MAPKs in each TNBC cell line. Right panels: 4D-MAPKi blocks BACH1 mRNA expression in anisomycin-induced cells. For E-J, the bar-graphs represent three or more independent experiments performed in each cell line, where the BACH1 expression in drug-treated cells is measured with respect to aniso-induced non-treated positive control group. Statistical significance for each dose was determined by student’s t-test with respect to the positive control group. For the source data, see Figure 5—source data 1.
Figure 5—figure supplement 1.
Figure 5—figure supplement 1.. Differences in MAPK network topology among cell lines.
(A) p38-ERK feedback axis in MB436 and LMB cell lines differs from the BM1 topology (compare to Figure 2F). (B) JNK-ERK feedback axis in MB436 and LMB cell lines differs from the BM1 topology (compare to Figure 2F). (C) JNK-p38 feedback axis in BM1 cells under serum induction differs from the BM1 topology under anisomycin induction (compare to Figure 2F). (D) Summary of MAPK topology differences between the three TNBC cell lines tested. Each interaction is representative of three or more independent experiments displayed in A-B.
Figure 5—figure supplement 2.
Figure 5—figure supplement 2.. The effect of 4D-MAPKi on MAPK network output.
(A) 4D-MAPKi reduces induction of BACH1 protein expression in anisomycin-induced human BM1 and MB436 cells. Western blot images representative of three or more independent experiments in each cell line. Bar graphs (below) represent the densitometry quantification of the independent western blots, plotted with respect to the non-treated control group. Statistical analysis was performed by one-tailed student’s t-test. (B) Quantification of surface lung metastasis in the syngeneic LMB mouse model when the mice were treated with 4D-MAPKi or the four individual MAPK inhibitors. Each dot represents a biological replicate. Statistical significance was determined by two-tailed student’s t-test in a pair-wise fashion between experimental groups.
Figure 6.
Figure 6.. Limiting kinase inhibition at multiple nodes reduces network output and prevents compensatory network activation.
(A) N1 illustrating the case of a treatment (MEKi) targeting node 3 (MEK) and activation of a compensatory kinase network (CKN) linked to upstream node 2 (RAF) (red circle). A comparable diagram can be generated for each upstream node to describe surplus signal activating a distinctive CKN. The percentage of reduction on the activity at a target node because of a treatment dose x is indicated by ξ. This inhibition causes reduction in the flow of product to node 3, denoted by c23=(1−ξMEK)Y2 (see A). (B) Graph depicting surplus signal from RAF as a fraction of the total input signal Σ following treatment by MEKi or 4D-MAPKi of cells with N1. The x axis denotes the percent inhibition of each kinase targeted by inhibitors relative to the maximal inhibitor dose (set at 100% inhibition). The y axis is the fraction of surplus RAF signal generated following drug treatment of cells relative to total input signal. MEKi, red; 4D-MAPKi, blue. (C) Graph depicting surplus kinase signal as a fraction of the total input Σ following treatment by 4D-MAPKi of cells with N1. The surplus is a consequence of the congestion of each direct pathway causing an insufficient absorption of the stress input by the driver network and its redirection toward a compensatory network. The x axis denotes the percent inhibition of each kinase targeted by 4D-MAPKi relative to the maximal inhibitor dose (set at 100% inhibition). The y axis is the fraction of surplus kinase signal generated following 4D-MAPKi treatment of cells relative to total input signal. RAF (surplus from MEKi), red; MLK (surplus from JNKi), blue; TAOK (surplus from p38i), green; and Signal (surplus from MLKi), brown; Total (sum of all surplus signals), black. (D) Dose-response curves showing activation of the compensatory PI3K network, monitored by p-AKT levels, when EGF-induced BM1 cells are treated with increasing doses of MEKi. Mean ± s.e.m. of n = 3 independent experiments. For the source data, see Figure 6—source data 1.
Figure 6—figure supplement 1.
Figure 6—figure supplement 1.. Effect of 4D-MAPKi on MAPK compensatory network activation.
(A and B) Activation of compensatory AKT signaling in BM1 cells treated with 4D-MAPKi (1X) or high-dose MEKi (100 nM) when induced with EGF or serum. Plots demonstrate normalized densitometry analysis of western blots from three independent experiments per induction method. (C) p-ERK and p-AKT signal from syngeneic LMB tumors treated with 4D-MAPKi, demonstrating lack of compensatory AKT activation despite inhibition of ERK signaling. Bar graphs represent the densitometry quantification of the western blot where each dot represents a biological replicate. Statistical analysis was performed by a two-tailed student’s t-test.
Figure 7.
Figure 7.. The BACH1/motility gene axis, targeted by RKIP and 4D-MAPKi, is associated with multiple cancers and metastasis suppressors.
(A) Expression of RKIP (PEBP1), BACH1, and the downstream motility genes in each TCGA BRCA patient (n = 1100), grouped by RKIP status. RKIP-high: z-score > 0.5 (n = 274), RKIP-low: z-score < −0.5 (n = 414), Others: −0.5 < z score<0.5 (n = 412). (B) Gene sets enriched with genes negatively correlated with RKIP across multiple TCGA cancer types. (C) Spearman correlation coefficients for BACH1 or motility genes relative to RKIP in TCGA cancers. Coefficient cutoff of −0.3 (coefficients between −0.3 and 0 were colored black). (D) Motility-related gene sets enriched for genes that negatively correlate with the indicated metastasis suppressors, but positively correlate with BACH1 in the TCGA BRCA set. (E) Spearman correlation coefficients for BACH1 or motility genes relative to RKIP (PEBP1) or other metastasis suppressors in TCGA BRCA. Coefficient cutoff of 0.3 in both positive and negative side. Coefficients between −0.3 and 0.3 were colored black. (F) Diagram summarizing the stress MAPK kinase N1 network that regulates metastasis in breast cancer. Stress activates a network of MAPKs that interact via crosstalk. RKIP and the RKIP-mimicking drug combo 4D-MAPKi reduce the signaling capacity of the entire network by targeting multiple nodes. This allows for effective reduction of the metastatic output of the network, measured by the expression of pro-metastatic BACH1 and its target motility genes.

References

    1. Amano M, Nakayama M, Kaibuchi K. Rho-kinase/ROCK: a key regulator of the cytoskeleton and cell polarity. Cytoskeleton. 2010;67:545–554. doi: 10.1002/cm.20472. - DOI - PMC - PubMed
    1. Azeloglu EU, Iyengar R. Signaling networks: information flow, computation, and decision making. Cold Spring Harbor Perspectives in Biology. 2015;7:a005934. doi: 10.1101/cshperspect.a005934. - DOI - PMC - PubMed
    1. Beguerisse-Díaz M, Desikan R, Barahona M. Linear models of activation cascades: analytical solutions and coarse-graining of delayed signal transduction. Journal of the Royal Society Interface. 2016;13:20160409. doi: 10.1098/rsif.2016.0409. - DOI - PMC - PubMed
    1. Bonavida B, Baritaki S, Huerta-Yepez S, Vega MI, Chatterjee D, Yeung K. Novel therapeutic applications of nitric oxide donors in Cancer: roles in chemo- and immunosensitization to apoptosis and inhibition of metastases. Nitric Oxide. 2008;19:152–157. doi: 10.1016/j.niox.2008.04.018. - DOI - PubMed
    1. Boston Change Process Study Group The "something more" than interpretation revisited: sloppiness and co-creativity in the psychoanalytic encounter. Journal of the American Psychoanalytic Association. 2005;53:693–729. doi: 10.1177/00030651050530030401. - DOI - PubMed

Publication types

Substances

Associated data