. 2021 Aug 15;42(12):3777-3791.
doi: 10.1002/hbm.25464. Epub 2021 May 11.

Connectivity within regions characterizes epilepsy duration and treatment outcome

Affiliations

Connectivity within regions characterizes epilepsy duration and treatment outcome

Xue Chen et al. Hum Brain Mapp. .

Abstract

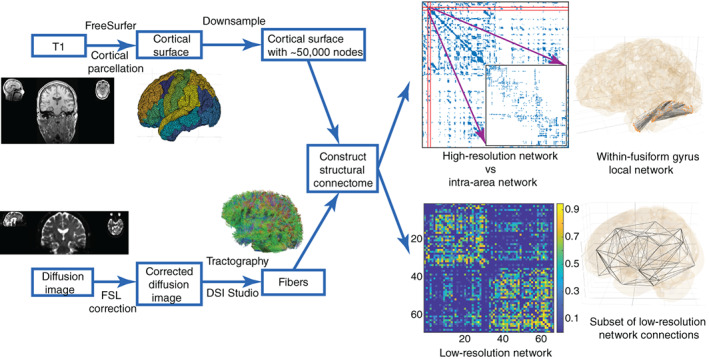
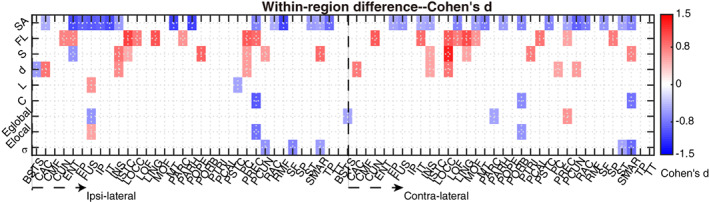
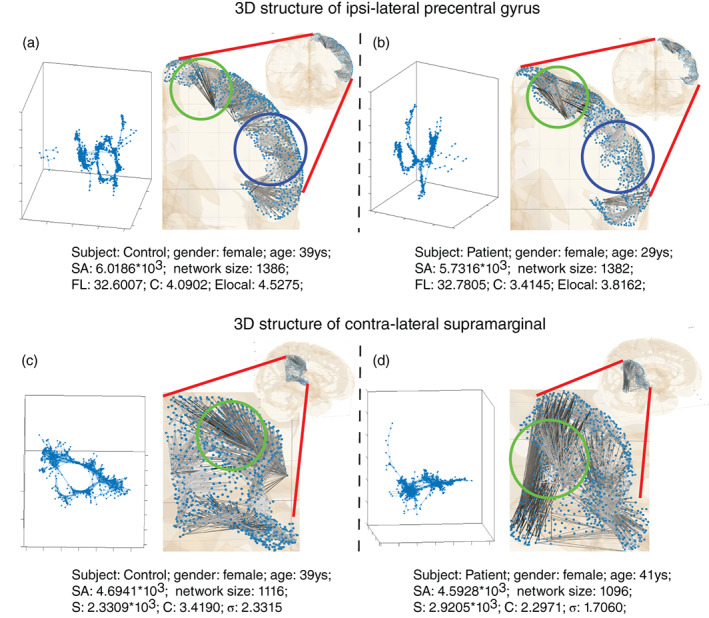
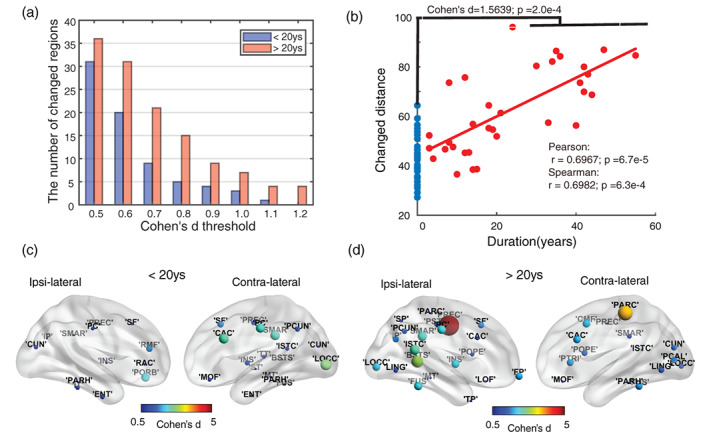
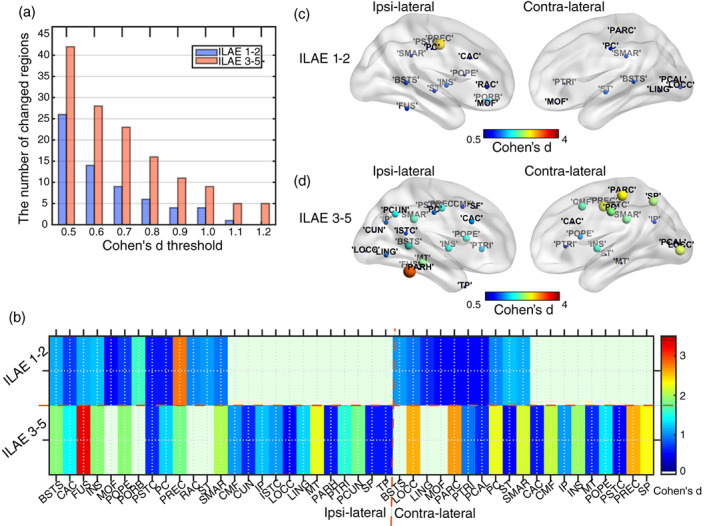
Finding clear connectome biomarkers for temporal lobe epilepsy (TLE) patients, in particular at early disease stages, remains a challenge. Currently, the whole-brain structural connectomes are analyzed based on coarse parcellations (up to 1,000 nodes). However, such global parcellation-based connectomes may be unsuitable for detecting more localized changes in patients. Here, we use a high-resolution network (~50,000-nodes overall) to identify changes at the local level (within brain regions) and test its relation with duration and surgical outcome. Patients with TLE (n = 33) and age-, sex-matched healthy subjects (n = 36) underwent high-resolution (~50,000 nodes) structural network construction based on deterministic tracking of diffusion tensor imaging. Nodes were allocated to 68 cortical regions according to the Desikan-Killany atlas. The connectivity within regions was then used to predict surgical outcome. MRI processing, network reconstruction, and visualization of network changes were integrated into the NICARA (https://nicara.eu). Lower clustering coefficient and higher edge density were found for local connectivity within regions in patients, but were absent for the global network between regions (68 cortical regions). Local connectivity changes, in terms of the number of changed regions and the magnitude of changes, increased with disease duration. Local connectivity yielded a better surgical outcome prediction (Mean value: 95.39% accuracy, 92.76% sensitivity, and 100% specificity) than global connectivity. Connectivity within regions, compared to structural connectivity between brain regions, can be a more efficient biomarker for epilepsy assessment and surgery outcome prediction of medically intractable TLE.

Keywords: epilepsy duration; high-resolution structural network; network metrics; surgical outcome prediction; within brain region.


Conflict of interest statement

The authors declare no competing interests.

Figures

FIGURE 1
FIGURE 1
Constructing global (between‐area) and local (within‐area) structural networks. The final high‐resolution connectivity is composed of around 50,000 nodes. Zooming into the high‐resolution networks, each within‐area structure, for example within the fusiform gyrus (inset), can be considered as a small local network. Note that the local network contained connections among nodes within regions, but contained no connections between regions. The connectivity and 3D visual graphs, generated by NICARA, of an intra‐area network, for example, within‐fusiform gyrus network are shown here. The low‐resolution global connectivity has 68 nodes, each corresponding to a DK atlas area. The 3D subset of low‐resolution network connections is also shown by NICARA (in the right of low‐resolution network)
FIGURE 2
FIGURE 2
Identification of changed within‐area local networks. All Metrics of intra‐area networks shown in color are significantly different (p < 0.05) in patients with lower values for negative Cohen's d (blue) and higher values for positive Cohen's d (red) in patients compared to controls. Several regions, both ipsi‐ and contra‐lateral to the epileptic focus, showed changes in one or more local network features. Network features were surface area (SA), fiber length (FL), total connectivity strength (S), edge density (d), characteristic path length (L), clustering coefficient (C), global efficiency (E global), average local efficiency (E local), and small‐worldness (𝜎)
FIGURE 3
FIGURE 3
Visualization of local network changes as exemplified for the ipsi‐lateral precentral and contra‐lateral supra marginal region. From left to right, two subjects (one control, one patient) are shown for both ipsi‐lateral precentral gyrus ((a) and (b)) and contra‐lateral supra marginal ((c) and (d)). While the network size (the number of nodes) and surface area size [mm2] (SA) remain comparable, clustering coefficient (c), local efficiency (Elocal) are reduced in ipsi‐lateral precentral gyrus (the upper panel: (a) and (b)) for patients. And reduced clustering coefficient, small‐worldness (σ), and increased connectivity strength (S) are found in contra‐lateral supra marginal for patients (the lower panel: (c) and (d)). Local networks were visualized by two methods: force‐directed layout in the left of all sub‐figures and anatomical layout by the NICARA in the right of all sub‐figures. Compared with the control (a), the patient (b) had more long connections in the precentral gyrus marked by green circles and fewer short connections in the blue‐circle zones. Similarly, compared with the control (c), the patient (d) had more remote long connections in the zone marked by blue circles. Anatomical layout connections were plotted in white to dark color to represent short to long fibers in figures
FIGURE 4
FIGURE 4
The intra‐regional change patterns related to duration. Patients were grouped into two parts: one whose epilepsy duration is smaller than 20 years, the others above. (a) The number of abnormal cortical areas among 68 regions increased with duration when changed regions were thresholded through medium (Cohen's d > 0.5) to very large (Cohen's d > 1.2) changes in network features. (b) Changed distance was computed by summing up absolute z‐scores across all metrics and for all duration‐related regions. Blue dots show the distribution of self‐control distance. Red dots represent the patient‐control distance showing that the intensity increases with disease duration. Furthermore, using a permutation test, there was a wider range of distances to the average control group value for epilepsy patients than for controls (Cohen's d = 1.5639). (c) and (d) depict changed regions (p < 0.05, Cohen's d threshold = 0.5) for both durations. The color shows the sum of Cohen's d scores across all significantly changed metrics of a region. For the longer duration (> 20 years), changes get stronger especially in the ipsi‐lateral hemisphere and more largely changed regions are around ipsi‐lateral cingulate regions
FIGURE 5
FIGURE 5
Local network abnormalities related to surgical outcome. Patients were categorized into two groups: good surgery outcome (ILAE 1–2) and bad surgery outcome (ILAE 3–5). (a) The number of abnormal cortical areas, for medium (Cohen's d > 0.5) and very large (Cohen's d > 1.2) changes in network features, was higher for bad outcome patients. (b) Abnormal regions were further grouped into ipsi‐ and contra‐lateral regions relative to the side of surgery. The color shows the sum of Cohen's d scores across all significantly changed (p < 0.05) metrics of a region. For bad‐outcome patients, more regions are affected and changes are more pronounced (higher Cohen's d). (c, d) Changed regions (p < 0.05, Cohen's d threshold = 0.5) for both outcome groups. The color shows the sum of Cohen's d scores across all significantly changed metrics of a region. For the bad surgery outcome patients (ILAE 3–5), changes are stronger in both ipsi‐ and contra‐lateral hemispheres and more areas are involved

References

    1. Ahmadi, M. E., Hagler, D. J., McDonald, C. R., Tecoma, E. S., Iragui, V. J., Dale, A. M., & Halgren, E. (2009). Side Matters: Diffusion Tensor Imaging Tractography in Left and Right Temporal Lobe Epilepsy. American Journal of Neuroradiology, 30(9), 1740–1747. 10.3174/ajnr.a1650. - DOI - PMC - PubMed
    1. Alarcon, G, Garcia Seoane, J. J. , Binnie, C. D. , Martin Miguel, M. C. , Juler, J. , Polkey, C. E. , … Ortiz Blasco, J. M. (1997). Origin and propagation of interictal discharges in the acute electrocorticogram. Implications for pathophysiology and surgical treatment of temporal lobe epilepsy. Brain, 120(12), 2259–2282. 10.1093/brain/120.12.2259. - DOI - PubMed
    1. Bartolomei, F. , Chauvel, P. , & Wendling, F. (2008). Epileptogenicity of brain structures in human temporal lobe epilepsy: A quantified study from intracerebral EEG. Brain, 131(7), 1818–1830. 10.1093/brain/awn111. - DOI - PubMed
    1. Beheshti, I., Sone, D., Farokhian, F., Maikusa, N., & Matsuda, H. (2018). Gray Matter and White Matter Abnormalities in Temporal Lobe Epilepsy Patients with and without Hippocampal Sclerosis. Frontiers in Neurology, 9, 107. 10.3389/fneur.2018.00107. - DOI - PMC - PubMed
    1. Bernasconi, N., Duchesne, S., Janke, A., Lerch, J., Collins, D. L., & Bernasconi, A. (2004). Whole‐brain voxel‐based statistical analysis of gray matter and white matter in temporal lobe epilepsy. NeuroImage, 23(2), 717–723. 10.1016/j.neuroimage.2004.06.015. - DOI - PubMed

Publication types