. 2021 Nov 5;22(6):bbab157.
doi: 10.1093/bib/bbab157.

Polyadenylation-related isoform switching in human evolution revealed by full-length transcript structure

Affiliations

Polyadenylation-related isoform switching in human evolution revealed by full-length transcript structure

Yumei Li et al. Brief Bioinform. .

Abstract

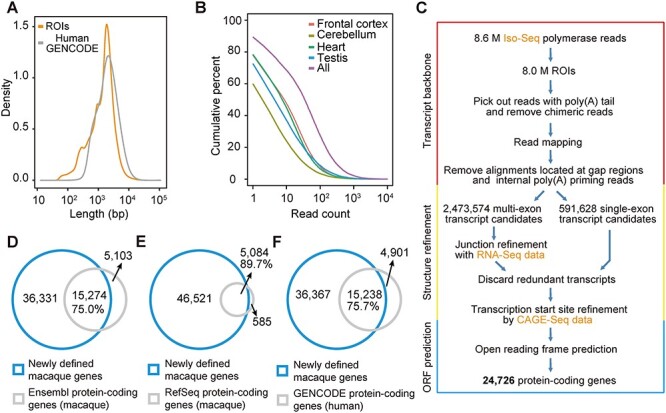
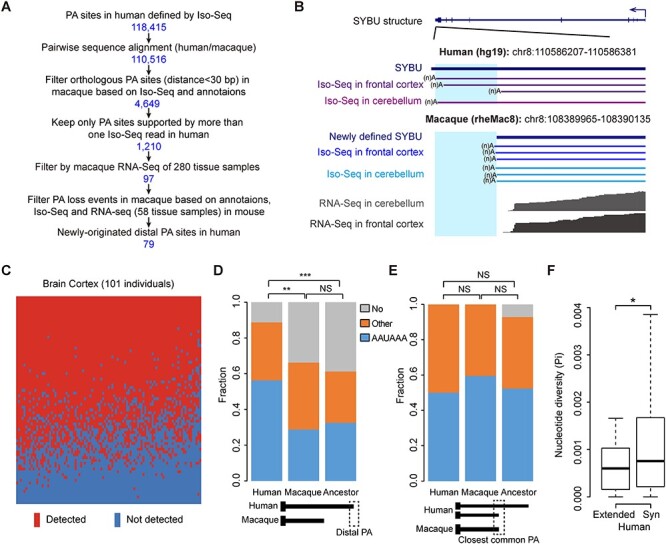
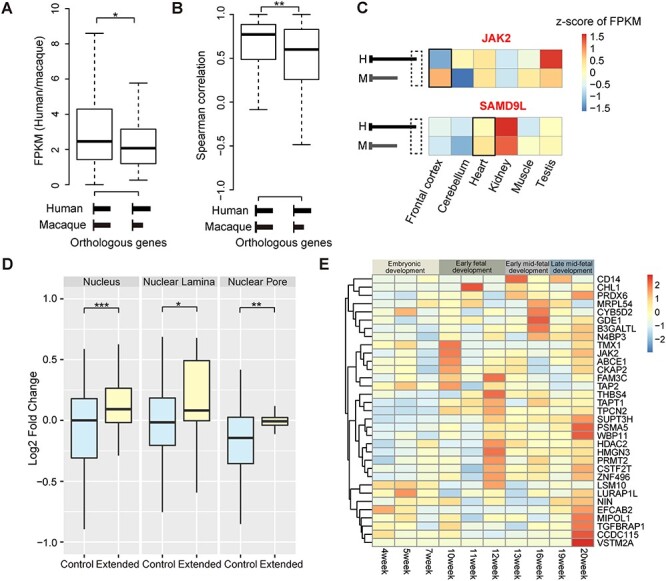
Rhesus macaque is a unique nonhuman primate model for human evolutionary and translational study, but the error-prone gene models critically limit its applications. Here, we de novo defined full-length macaque gene models based on single molecule, long-read transcriptome sequencing in four macaque tissues (frontal cortex, cerebellum, heart and testis). Overall, 8 588 227 poly(A)-bearing complementary DNA reads with a mean length of 14 106 nt were generated to compile the backbone of macaque transcripts, with the fine-scale structures further refined by RNA sequencing and cap analysis gene expression sequencing data. In total, 51 605 macaque gene models were accurately defined, covering 89.7% of macaque or 75.7% of human orthologous genes. Based on the full-length gene models, we performed a human-macaque comparative analysis on polyadenylation (PA) regulation. Using macaque and mouse as outgroup species, we identified 79 distal PA events newly originated in humans and found that the strengthening of the distal PA sites, rather than the weakening of the proximal sites, predominantly contributes to the origination of these human-specific isoforms. Notably, these isoforms are selectively constrained in general and contribute to the temporospatially specific reduction of gene expression, through the tinkering of previously existed mechanisms of nuclear retention and microRNA (miRNA) regulation. Overall, the protocol and resource highlight the application of bioinformatics in integrating multilayer genomics data to provide an intact reference for model animal studies, and the isoform switching detected may constitute a hitherto underestimated regulatory layer in shaping the human-specific transcriptome and phenotypic changes.

Keywords: Iso-Seq; gene models; polyadenylation; rhesus macaque; subcellular localization; transcriptome evolution.


Figures

Figure 1
Figure 1
De novo definition of macaque gene models with Iso-Seq data. (A) Distribution of the lengths of Iso-Seq reads of insert (ROIs) and of human gene models annotated by GENCODE (v19) (Human GENCODE). (B) Cumulative distribution of the coverage of genes by Iso-Seq reads. All: Iso-Seq data from all four tissues. (C) The pipeline for the de novo definition of macaque gene models. (DF) Venn diagrams showing the comparisons of gene models between the new atlas of macaque genes versus macaque protein-coding genes annotated by Ensembl (release 96) (D), RefSeq (release 94) (E) or human protein-coding genes annotated by GENCODE (F).
Figure 2
Figure 2
Evaluation of the newly defined macaque gene models. (AC) Regulatory attributes associated with the new macaque gene models: aggregate plots showing the H3K4me3 signals around the TSS of all genes (A). Densities of CpG islands around TSS of genes with CpG islands (nearby 200 bp) (B) and densities of poly(A)-Seq-identified PA sites around TTS of all genes (C). Newly defined macaque gene models; Ensembl, macaque gene models annotated by Ensembl (release 96). (D) Sequence motifs flanking splice sites of the newly defined macaque gene models. (E) Bar plots showing the distribution of genes with different coverage of protein-coding sequence, which was defined as the percentage of the newly defined macaque CDS covered by human/macaque protein sequences annotated by GenBank (release 223) and RefSeq (release 77). (F) Pie chart showing the comparisons of the CDS length between the newly defined macaque genes and human genes annotated by RefSeq (release 94). Only orthologous gene pairs in humans and macaques were considered in the comparison; Hg, the length of the CDS for human gene as annotated by RefSeq; Ma, the length of CDS for macaque orthologous gene as annotated by the new macaque gene models. (G and H) Bar plots showing the distributions of the proportion of alignment (G) and sequence identity (H) for the aligned regions between human and macaque protein sequences, which were translated from human RefSeq genes and the newly defined macaque genes, respectively.
Figure 3
Figure 3
An example of improved macaque gene model. Both the previously annotated gene model (Ensembl) and a newly defined gene model are shown. The numbers of supporting reads for each transcript are shown along with the Iso-Seq reads. The positions of RNA-Seq junction reads (RNA-Seq) and CpG islands, as well as the signals of CAGE-Seq, H3K4me3 ChIPSeq and poly(A)-Seq, were presented accordingly.
Figure 4
Figure 4
Cis- and trans-regulation of PA site selection. (A) Cumulative plots showing the distributions of PA usage in the macaque frontal cortex for three groups of PA sites with different PAS. AAUAAA, PA sites with the canonical PAS AAUAAA; Other, PA sites with other PAS variants excluding AAUAAA; No, PA sites without known PAS. (B) For genes undergoing alternative polyadenylation in the macaque frontal cortex, the proportions of the three groups of PA sites (AAUAAA, Other, No) are shown for the proximal and distal PA sites, respectively. (C) 3D histograms showing average PA usage in the macaque frontal cortex in groups with different combinations of PAS (AAUAAA, Other, No) at proximal and distal PA sites. (D) For each gene expressed in both the macaque frontal cortex and testis, pairwise comparison of the weighted length of the 3′ UTR was performed and shown. The genes with a cross-tissue difference in weighted length of >30 bp are highlighted in red (2299 genes, longer 3′ UTR in frontal cortex) or blue (723 genes, longer 3′ UTR in testis). (E) Hierarchical clustering diagram showing the Spearman correlation coefficients of pairwise comparisons of the PA usage in multiple tissue samples between human and macaque. NS, not significant; *P ≤ 0.05; **P ≤ 0.01; ***P ≤ 0.001.
Figure 5
Figure 5
Cis-regulation is primarily attributed to cross-species PA site selection. (A) A flow chart depicting the identification of distal PA sites in human but not macaque. The number of human PA sites retained in each step is shown. (B) Track view of one example gene, SYBU, with a specific distal PA site in human but not macaque. The structure of the SYBU transcript is shown, with the 3′ UTR regions of the human (middle panel) and macaque (bottom panel) gene loci shown in the magnified view. The extended 3′ UTRs in human are highlighted in the shaded regions. (C) Heat map showing the expression of extended exonic regions in human cortex samples. Horizontal red bars indicate the expression of the extended regions in the tissue sample of the corresponding individual (FPKM >0.2). (D and E) For genes with human–macaque differences in PA site selection, the proportions of the three groups of PAS (AAUAAA, Other, No; as defined in Figure 4) are shown for the newly originated human PA sites (D) and the closest common PA sites shared by human and macaque (E). (F) Boxplots of nucleotide diversity for human-specific extended regions corresponding to 79 newly originated distal PA sites in human and all synonymous sites of human genes (Syn). NS, not significant; *P ≤ 0.05; **P ≤ 0.01; ***P ≤ 0.001.
Figure 6
Figure 6
Transcriptome evolution in primates through PA site selection. (A) The ratios of FPKM between human and macaque are shown and compared for orthologous genes with (right boxplot) or without (left boxplot) distal PA sites specific in human but not macaque. (B) Boxplots showing Spearman correlation coefficients of tissue expression profiles in six tissues (frontal cortex, cerebellum, heart, kidney, muscle and testis) of human and macaque for orthologous genes with (right boxplot) or without (left boxplot) specific distal PA sites in human but not macaque. (C) Examples of genes with specific distal PA sites in human but not macaque that also exhibit divergence of tissue expression profiles. The specific tissues in which the human-specific distal PA site was initially identified were labeled by a black box in the heat maps; H, human; M, macaque. (D) Boxplots of the APEX-Seq fold changes for the extended 3′ UTR regions specific to human (Extended) and the constitutive exonic regions of the corresponding genes (Control); NS, not significant; *P ≤ 0.05; **P ≤ 0.01; ***P ≤ 0.001. (E) Heatmap showing the relative levels of the isoforms with newly originated distal PA sites in human, during the human fetal brain development.

Similar articles

Cited by

References

    1. Rhesus Macaque Genome Sequencing and Analysis Consortium, Gibbs RA, Rogers J, et al. . Evolutionary and biomedical insights from the rhesus macaque genome. Science 2007;316:222–34. - PubMed
    1. Zhang SJ, Wang C, Yan S, et al. . Isoform evolution in primates through independent combination of alternative RNA processing events. Mol Biol Evol 2017;34:2453–68. - PMC - PubMed
    1. Merkin J, Russell C, Chen P, et al. . Evolutionary dynamics of gene and isoform regulation in mammalian tissues. Science 2012;338:1593–9. - PMC - PubMed
    1. Wang ET, Sandberg R, Luo SJ, et al. . Alternative isoform regulation in human tissue transcriptomes. Nature 2008;456:470–6. - PMC - PubMed
    1. Hubbard T, Barker D, Birney E, et al. . The Ensembl genome database project. Nucleic Acids Res 2002;30:38–41. - PMC - PubMed

Publication types