. 2021 Jul 5;218(7):e20202477.
doi: 10.1084/jem.20202477. Epub 2021 May 11.

Cbl-b deficiency prevents functional but not phenotypic T cell anergy

Affiliations

Cbl-b deficiency prevents functional but not phenotypic T cell anergy

Trang T T Nguyen et al. J Exp Med. .

Abstract

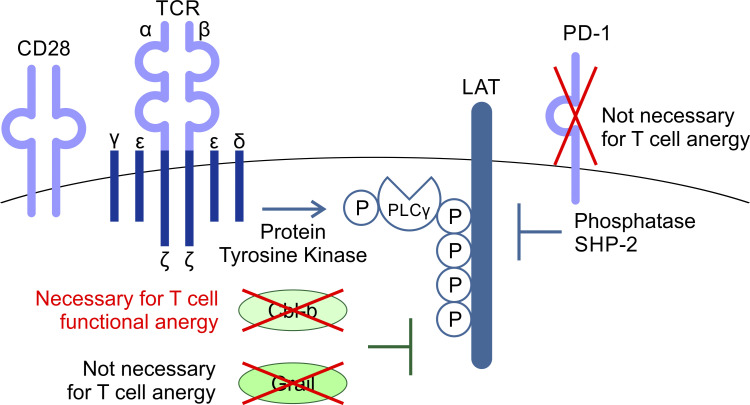
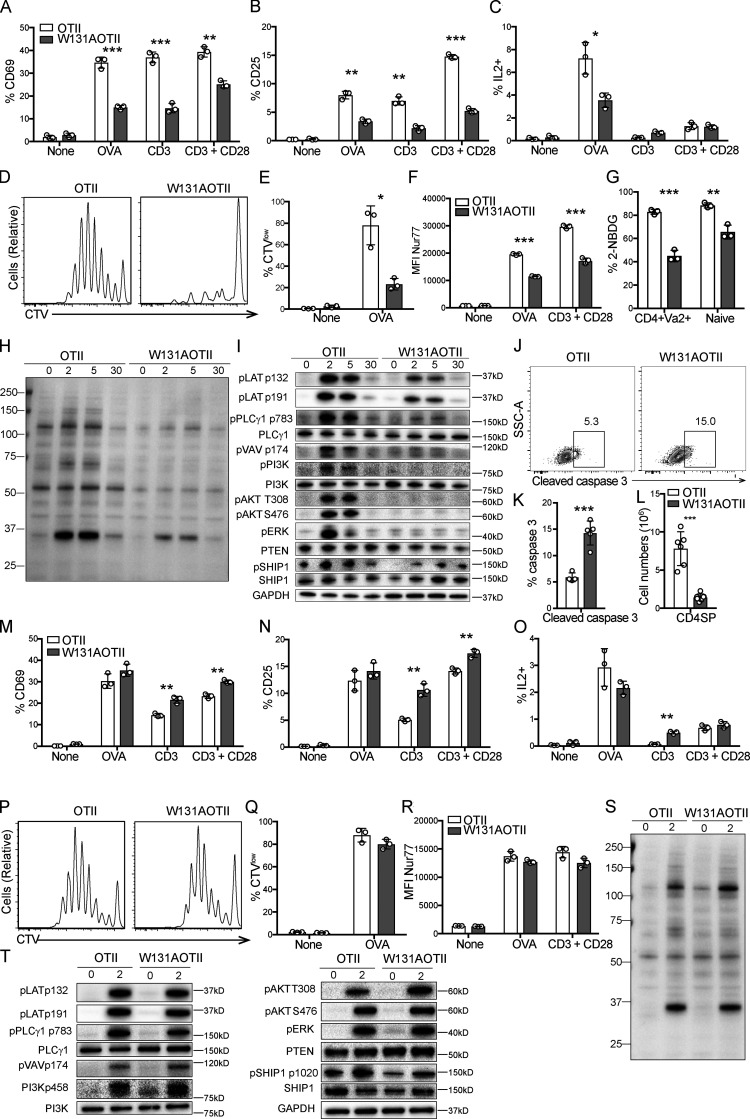
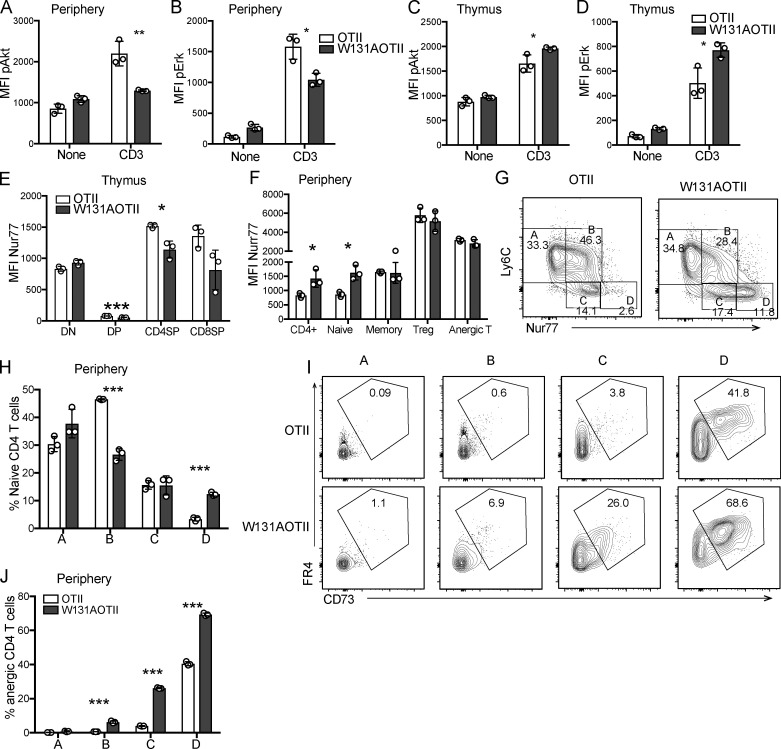
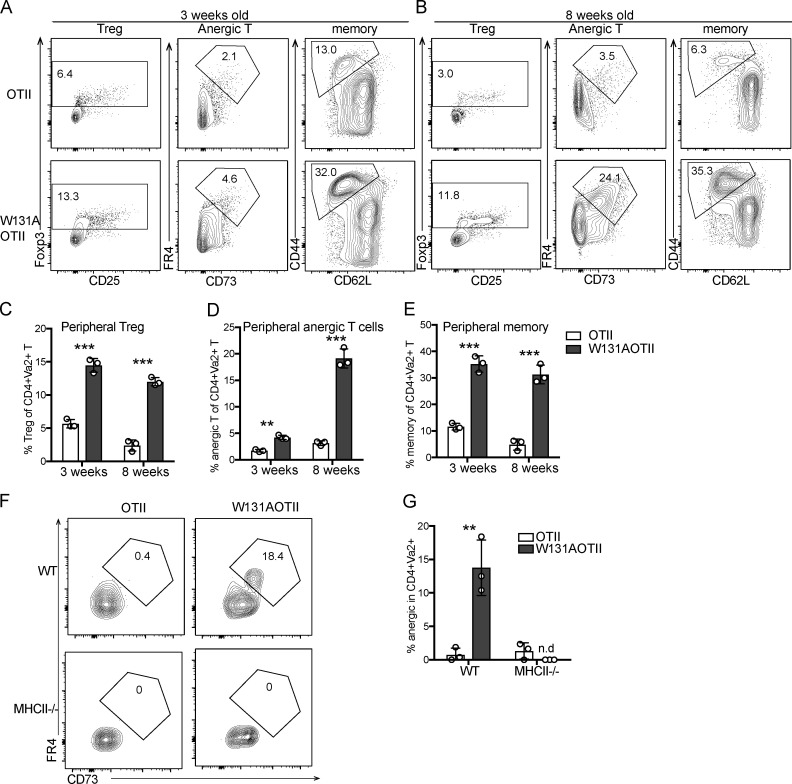
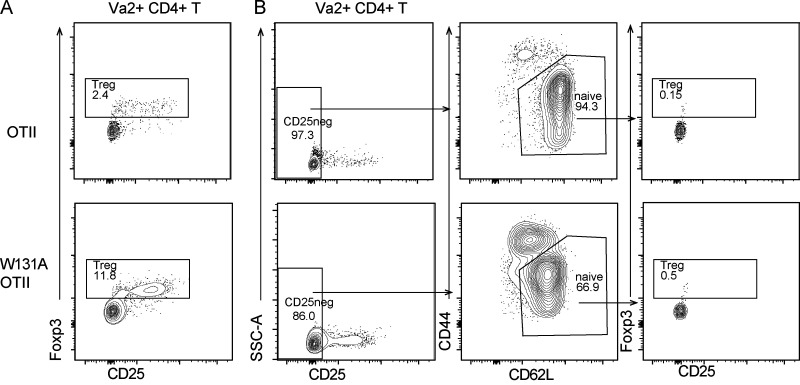
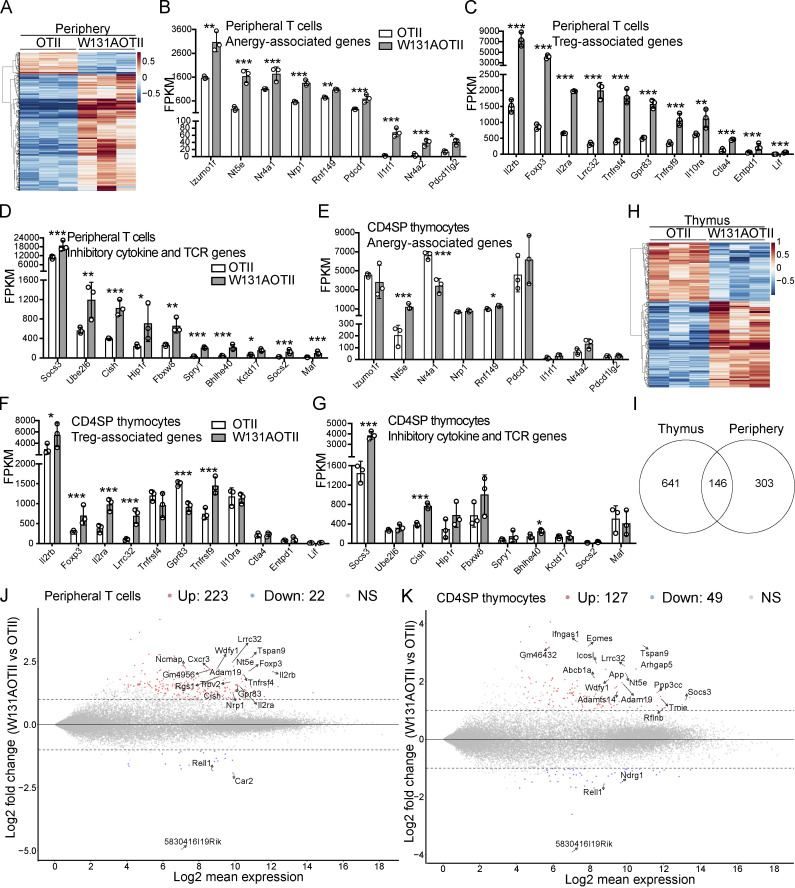
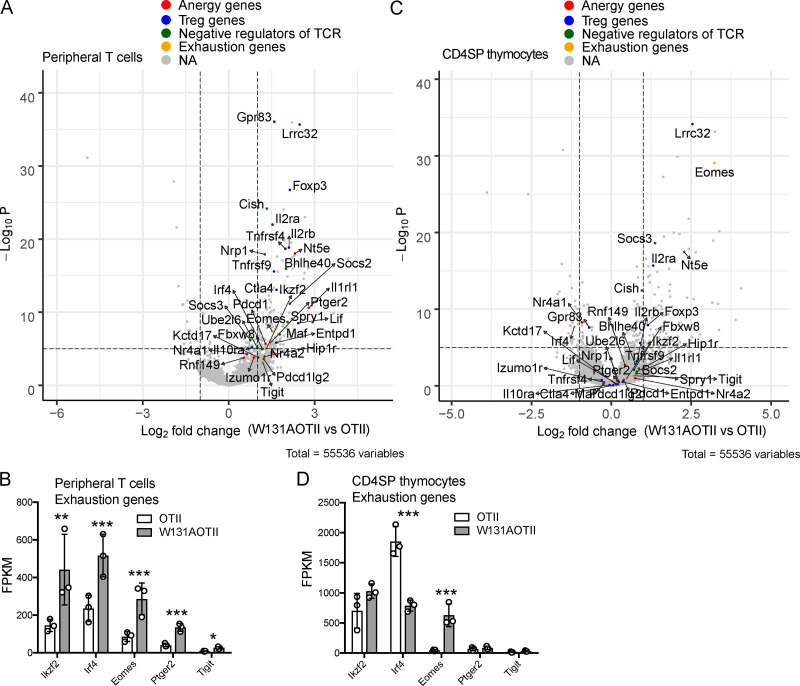
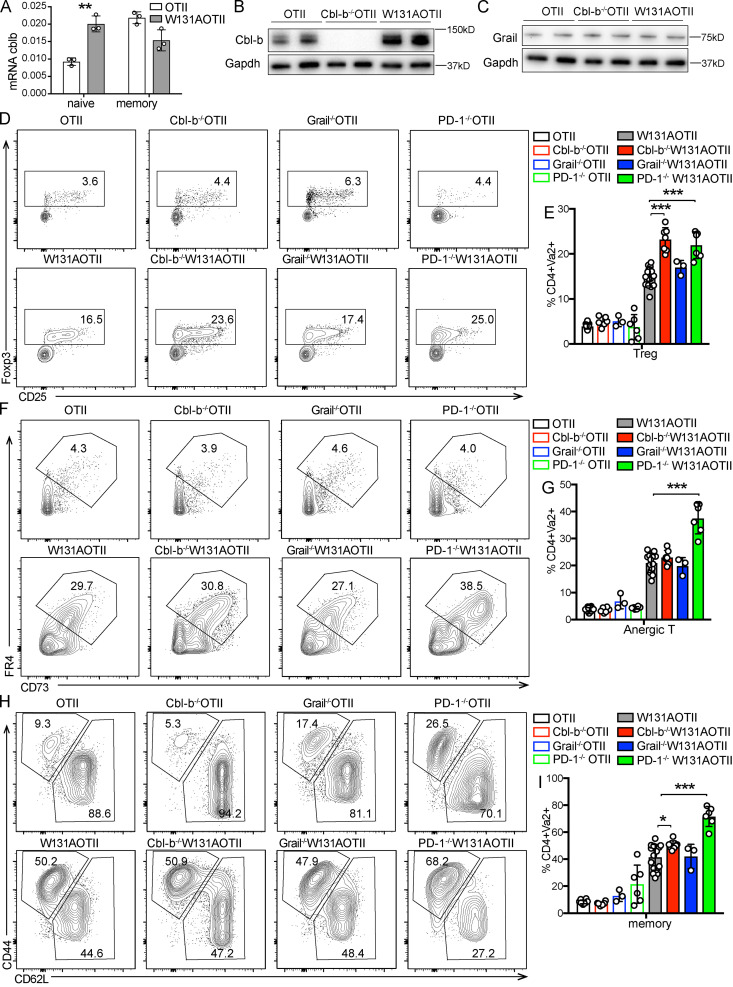
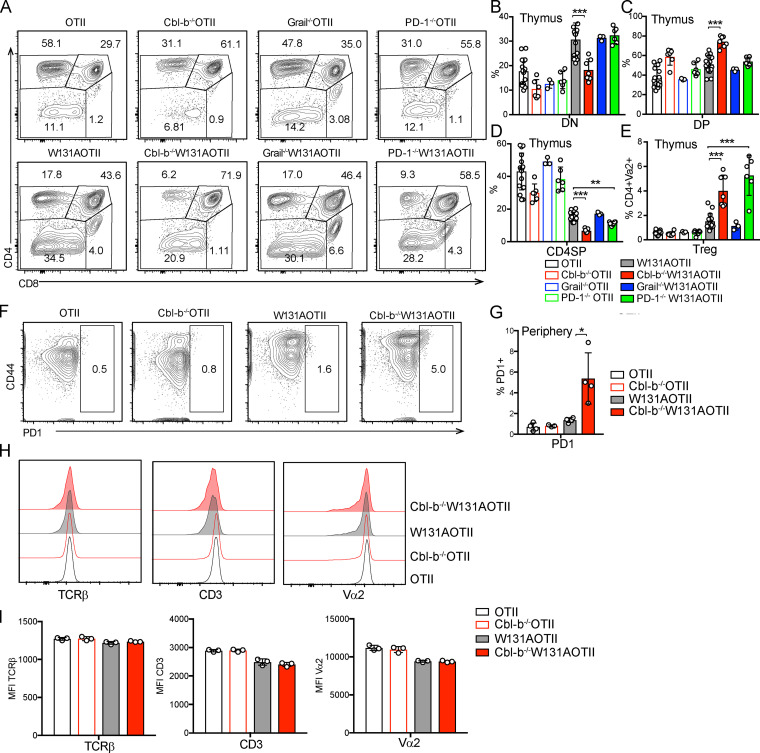
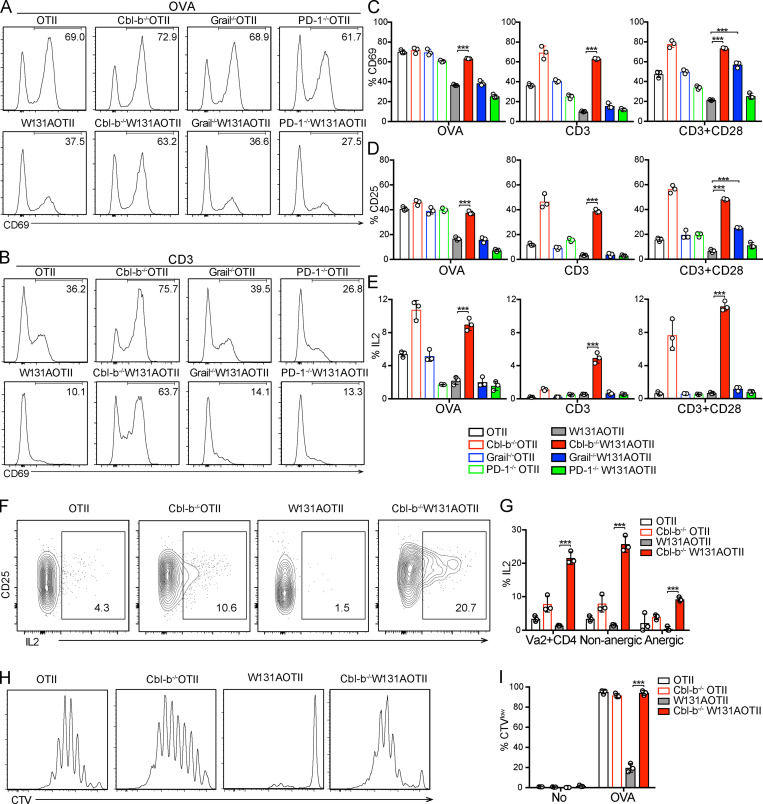
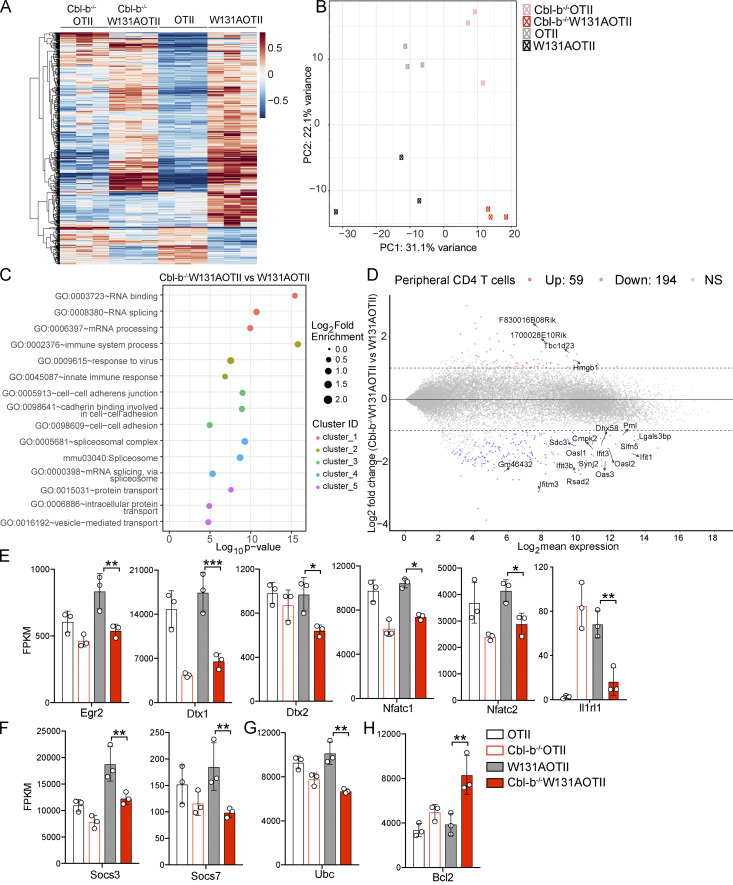
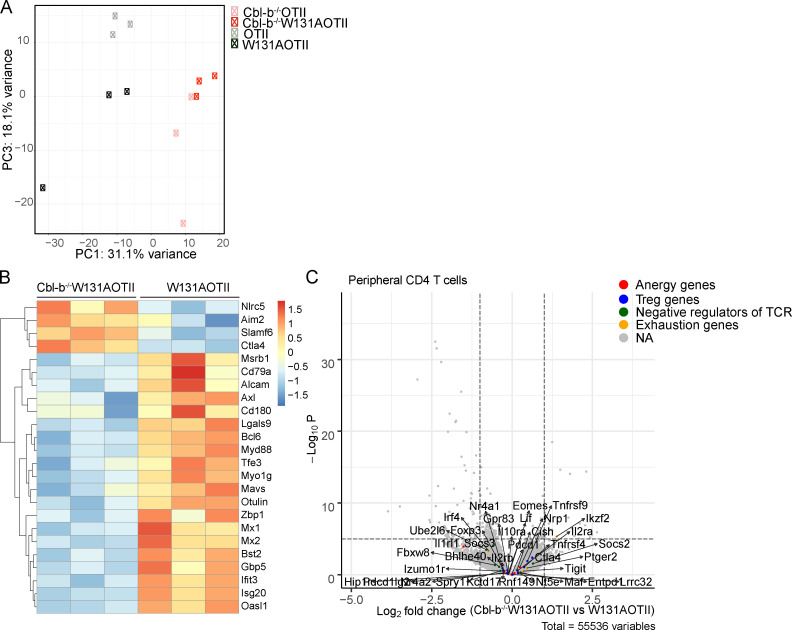
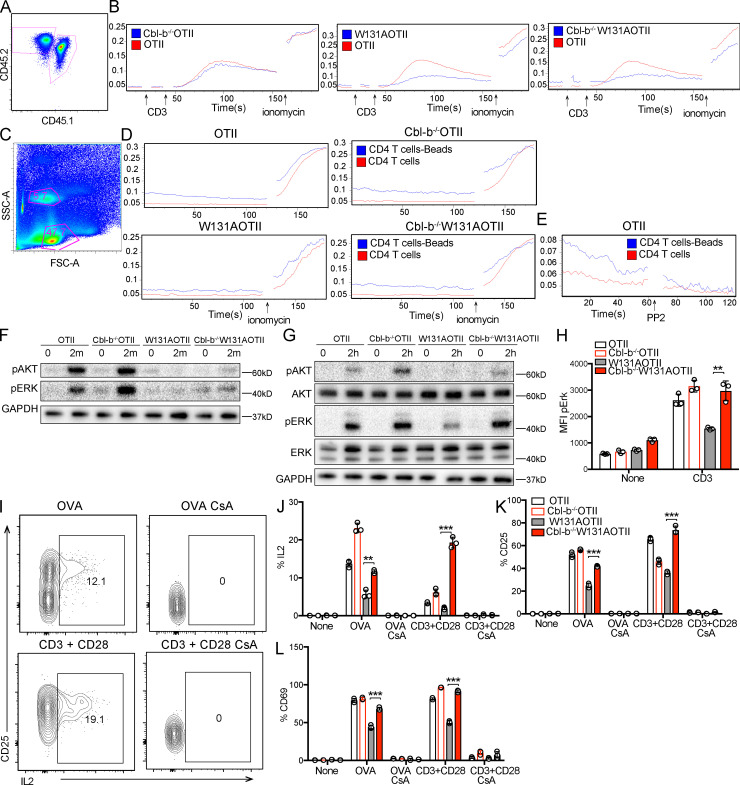
T cell anergy is an important peripheral tolerance mechanism. We studied how T cell anergy is established using an anergy model in which the Zap70 hypermorphic mutant W131A is coexpressed with the OTII TCR transgene (W131AOTII). Anergy was established in the periphery, not in the thymus. Contrary to enriched tolerance gene signatures and impaired TCR signaling in mature peripheral CD4 T cells, CD4SP thymocytes exhibited normal TCR signaling in W131AOTII mice. Importantly, the maintenance of T cell anergy in W131AOTII mice required antigen presentation via MHC-II. We investigated the functional importance of the inhibitory receptor PD-1 and the E3 ubiquitin ligases Cbl-b and Grail in this model. Deletion of each did not affect expression of phenotypic markers of anergic T cells or T reg numbers. However, deletion of Cbl-b, but not Grail or PD-1, in W131AOTII mice restored T cell responsiveness and signaling. Thus, Cbl-b plays an essential role in the establishment and/or maintenance of unresponsiveness in T cell anergy.


Conflict of interest statement

Disclosures: A. Weiss reported personal fees from Nurix Therapeutics and personal fees from Genentech outside the submitted work and is a co-founder of Nurix Therapeutics, a publicly traded company in which he owns stock and has received consulting fees since it was founded in 2012. Nurix is developing small molecule inhibitors of Cbl-b for use in immuno-oncology. Current inhibitors are in preclinical development. The studies performed here examine the role of Cbl-b in T cell anergy using knock out mice and find that Cbl-b is an important negative regulator of functional anergy. Neither A. Weiss, nor his lab, have had access to any small molecule inhibitors developed at Nurix. The studies reported here do not directly relate to immuno-oncology. A. Weiss is also on the Scientific Resource Board of Genentech, for which he receives financial compensation. Genentech has developed anti-PDL-1 monoclonal antibodies for use in immuno-oncology. The role of PD-1 in a mouse model of T cell anergy was studied here. Deficiency of PD-1 had no apparent effect on the model of T cell anergy studied here. No other disclosures were reported.

Figures

None
Graphical abstract
Figure 1.
Figure 1.
In contrast to peripheral T cells, mature CD4 thymocytes exhibit normal TCR signaling in W131AOTII mice. (A–F) Peripheral naive CD25CD4+ T cells from age-matched OTII, W131AOTII mice (n = 3 mice/group) were cultured with TCRα−/− splenocytes plus 0.1 µM OVA peptide, plate-bound anti CD3 (0.3 µg/ml) with or without anti-CD28 (2 µg/ml). (A–C) Bar graphs indicate mean frequencies ± SD for CD69+ (A), CD25+ (B), and IL2+ (C) of naive OTII and W131AOTII CD4+ T cells after 16 h culture. (D and E) Peripheral OTII and W131AOTII CD4+ T cells after culture with TCRα−/− splenocytes plus 0.1 µM OVA peptide for 4 d. Peripheral naive CD25CD4+ T cells from OTII and W131AOTII mice were loaded with CTV dye. (D) Dilution of cell trace dye by flow cytometry. (E) Percentages of proliferating (CTVlow) cells of Vα2+CD4+ T cells. (F) Graphs show mean fluorescence intensity (MFI) for Nur77 of naive Vα2+CD4+ T cells after 16 h culture. (G) Frequencies of fluorescent glucose analogue+ (2-NBDG+) of OTII and W131AOTII cells after 2 h of culture. (H and I) Immunoblot analyses of phosphotyrosine (H) and phosphorylation of total TCR proximal signaling molecules in peripheral naive Vα2+CD4+ T cells (I; n = 4–8 mice/group) that were left unstimulated or were stimulated with anti-CD3 (1 µg/ml) followed by cross-linking with 20 µg/ml anti–Armenian hamster IgG for 2, 5, and 30 min. GAPDH was used as a loading control. (J) FACS plots showing activated caspase 3 staining in TCRβ+CD5+ thymocytes. (K and L) Bar graphs indicating mean frequencies ± SD for activated caspase 3+ of TCRβ+CD5+ thymocytes (K) and numbers of CD4SP thymocytes (L). (M–R) CD25 CD4SP thymocytes from OTII, W131AOTII mice (n = 3 mice/group) were cultured with TCRα−/− splenocytes plus 0.1 µM OVA peptide, plate-bound anti-CD3 (0.3 µg/ml) with or without anti-CD28 (2 µg/ml). (M–O) Bar graphs indicating mean frequencies ± SD for CD69+ (M), CD25+ (N), and IL2+ (O) of Vα2+CD4SP thymocytes after 16 h culture. (P and Q) Histograms comparing proliferative responses and frequencies for proliferative (CTVlow) cells of Vα2+CD4SP thymocytes after culture for 4 d. (R) Graphs show MFI for Nur77 of Vα2+ CD4SP thymocytes after 16 h culture. (S and T) Immunoblot analysis of phosphotyrosine (S) and phosphorylation of total TCR proximal signaling molecules in Vα2+CD4SP thymocytes (T; n = 3–6 mice/group) stimulated with anti-CD3 (1 µg/ml) followed by cross-linking with 20 µg/ml anti–Armenian hamster IgG for 2 min. GAPDH, loading control. Data are representative of three independent experiments. Two-tailed Student’s t test was performed. *, P < 0.05; **, P < 0.005; ***, P < 0.0005.
Figure S1.
Figure S1.
Increased basal TCR signals, as evidenced by enhanced Nur77-GFP expression in W131AOTII, correlated with increased numbers of anergic T cells. Flow cytometry–based assessment of MFI of AKT phosphorylation and ERK phosphorylation levels of peripheral naive or CD4SP thymocytes stimulated with anti-CD3 (1 µg/ml) followed by cross-linking with anti–Armenian hamster IgG (20 µg/ml) for 2 min (n = 3 mice/group). (A and B) MFI of AKT phosphorylation (A) and ERK phosphorylation (B) relative amounts in stimulated peripheral naive OTII and W131AOTII T cells. (C and D) MFI of AKT phosphorylation (C) and ERK phosphorylation (D) levels in stimulated Vα2+CD4SP thymocytes. (E and F) Quantification of MFI of Nur77-GFP in thymic T cell subsets (E; double-negative [DN], DP, CD4SP, and CD8SP) and peripheral T cell subsets (F) from OTII and W131AOTII mice (n = 3 mice/group). (G) Contour plots show the gating scheme for populations A to D, based on Nur77-GFP and Ly6C expression in peripheral naive T cells. (H) Bar graphs show the percentages of populations A to D in peripheral naive T cells. (I) Contour plots depict anergic T cells (FR4+CD73+) from populations A to D. (J) Bar graphs show the percentage of anergic T cells from populations A to D. Data are representative of two independent experiments. Two-tailed Student’s t test was performed. *, P < 0.05; **, P < 0.005; ***, P < 0.0005.
Figure 2.
Figure 2.
Age-dependent T cell anergy in W131AOTII mice is dependent on antigen presentation in their periphery. (A and B) Flow cytometry of peripheral CD4+Vα2+ T cells to identify T reg cells (Foxp3+), anergic T cells (Foxp3FR4+CD73+), and memory T cells (CD44+CD62L) in (A) 3-wk-old and (B) 8-wk-old mice (n = 3 mice/group). (C–E) Bar graphs depict the frequencies of peripheral T reg cells (C), anergic T cells (D), and memory T cells (E) of Vα2+CD4+ T cells. (F and G) Peripheral naive CD25 T cells from OTII and W131AOTII mice were labeled with CTV and transferred into WT or MHC class II–deficient (MHCII−/−) hosts for 10 d. (F) Contour plots show frequencies of anergic T cells in donor cells after transfer. Numbers indicate the percentages of events within each gate. (G) Bar graphs show the percentages of anergic T cells of donor cells after transfer (n = 3 mice/group). Data are representative of three independent experiments (A–E) and two independent experiments (F and G). Two-tailed Student’s t test was performed. **, P < 0.005; ***, P < 0.0005. n.d., not detectable.
Figure S2.
Figure S2.
Peripheral CD25 naive (CD44lowCD62L+) Vα2+ CD4 T cells contained very few T reg cells. (A) Flow cytometry of peripheral CD4+Vα2+ T cells stained for Foxp3 and CD25 expression to identify T reg cells (Foxp3+). (B) Gating strategy for sorting peripheral CD25 naive (CD44lowCD62L+) Vα2+ CD4 T cells contained very few T reg cells (Foxp3+). Data are representative of two independent experiments. SSC-A, side scatter.
Figure 3.
Figure 3.
In contrast to CD4SP thymocytes, tolerance-associated gene signatures were strongly enriched in peripheral W131AOTII T cells. (A) RNA sequencing revealed heatmap analysis of gene expression in peripheral naive (CD44lowCD62L+) CD25Vα2+ CD4 T cells (n = 3–12 mice/group). (B–D) RNA sequencing revealed expression of anergy-associated genes (B), T reg cell–associated genes (C), and inhibitory genes (D) influencing cytokines and TCR signaling in peripheral naive CD25Vα2+CD4+ T cells from OTII and W131AOTII mice. (E–G) Expression of anergy-associated genes (E), T reg cell–associated genes (F), and inhibitory genes (G) influencing cytokines and TCR signaling in CD25Vα2+ CD4SP thymocytes from OTII versus W131AOTII mice. The expression values were normalized by fragments per kilobase of transcript per million reads (FPKM). (H) RNA seqequencing revealed heatmap analysis of gene expression in CD25Vα2+ CD4SP thymocytes from OTII versus W131AOTII mice. (I) Venn diagram showing the total number of DE genes between W131AOTII and OTII T cells in transgenic CD4SP thymocytes and peripheral naive CD25 CD4 T cells. (J and K) MA plot revealed top genes whose expression was highly expressed and DE in peripheral W131AOTII T cells (J) and W131AOTII CD4SP thymocytes (K) compared with those from OTII mice. FDR-corrected *, P < 0.05; **, P < 0.005; ***, P < 0.0005.
Figure S3.
Figure S3.
In contrast to CD4SP thymocytes, tolerized gene signatures were strongly enriched in peripheral W131AOTII T cells. (A) Volcano plot revealed expression of anergy-associated genes, T reg cell–associated genes, inhibitory genes influencing cytokines and TCR signaling, and exhausted genes in peripheral naive CD25Vα2+CD4+ T cells from W131AOTII compared with those cells from OTII mice (n = 3–12 mice/group). (B) RNA sequencing revealed expression of exhausted genes in peripheral naive CD25Vα2+CD4+ T cells. (C) Volcano plot revealed expression of anergy-associated genes, T reg cell–associated genes, inhibitory genes influencing cytokines and TCR signaling, and exhausted genes in CD25Vα2+CD4SP thymocytes from W131AOTII compared with those cells from OTII mice. NA, not applicable. (D) RNA sequencing revealed expression of exhausted genes in CD25Vα2+ CD4SP thymocytes from OTII versus W131AOTII mice. The expression values were normalized by fragments per kilobase of transcript per million reads (FPKM) of W131AOTII T cells versus OTII T cells. FDR-corrected *, P < 0.05; **, P < 0.005; ***, P < 0.0005.
Figure 4.
Figure 4.
Deletion of Cbl-b, Grail, or PD-1 in W131AOTII mice did not rescue anergic phenotypes in W131AOTII mice. (A) Relative expression of Cbl-b mRNA in naive and memory Vα2+ CD4 T cells from indicated mice (n = 3 mice/group). (B and C) Immunoblot analysis of Cbl-b (B) and Grail (C) on peripheral CD25 naive OTII and W131AOTII T cells (n = 4–8 mice/group). (D) Flow cytometry of peripheral CD4+Vα2+ T cells to identify T reg cells (Foxp3+). (E) Bar graph depicts the frequencies of peripheral T reg cells of Vα2+CD4+ T cells. (F) Flow cytometry of peripheral CD4+Vα2+Foxp3 T cells to identify anergic T cells (Foxp3FR4+CD73+). (G) Bar graph shows the frequencies of peripheral anergic T cells of CD4+Vα2+ T cells. (H) Flow cytometry of peripheral CD4+Vα2+ T cells stained for CD44 and CD62L expression. (I) Bar chart shows the frequencies of peripheral memory T cells (CD44+CD62L) of Va2+CD4+ T cells. Data are representative of three independent experiments (A–C) and combined from five independent experiments (n = 3–17 mice/group). Two-tailed Student’s t test was performed. *, P < 0.05; **, P < 0.005; ***, P < 0.0005.
Figure S4.
Figure S4.
Deletion of Cbl-b, Grail, or PD-1 in W131AOTII mice did not rescue anergic phenotypes in W131AOTII mice. (A) Representative plots showing expression of CD4 and CD8 in total thymocytes from indicated mice. (B–D) Bar graphs show frequencies of double-negative (B; DN), DP (C), and CD4SP thymocytes (D) in indicated mice. (E) Bar graph shows the frequencies of thymic T reg cells (Foxp3+) of Vα2+ CD4SP thymocytes. (F) FACS plots showing PD-1 staining in peripheral Vα2+ CD4 T cells from OTII and W131AOTII mice. (G) MFI of PD-1 expression. (H) Histograms comparing expression of TCRβ, CD3, and Vα2 in peripheral naive Vα2+CD4+ T cells from indicated mice. (I) Bar graphs indicating MFI ± SD for TCRβ, CD3, and Vα2 in peripheral naive Vα2+CD4+ T cells from indicated mice. Data in A–E are combined from five independent experiments (n = 3–17 mice/group). Data in F–I are presentative of two independent experiments (n = 3 or 4 mice/group). Two-tailed Student’s t test was performed. *, P < 0.05; **, P < 0.005; ***, P < 0.0005.
Figure 5.
Figure 5.
Loss of Cbl-b, but not PD-1 or Grail, in W131AOTII mice prevents peripheral T cell unresponsiveness to antigen and TCR stimulation. (A–J) Peripheral naive CD25 CD4 T cells from age-matched mice (n = 3 mice/group) were cultured in vitro with TCRα−/− splenocytes plus 0.1 µM OVA peptide, or plate-bound anti-CD3 (0.3 µg/ml) with or without anti-CD28 (2 µg/ml). (A and B) Histograms comparing CD69 up-regulation after 16 h culture with OVA (A) or anti-CD3 (B) stimulation. (C–E) Bar graphs indicating mean frequencies ± SD for CD69+ (C), CD25+ (D), or IL2+ of Vα2+ CD4 T cells (E). (F) Flow cytometry of peripheral Vα2+ CD4 T cells stained for CD25 and IL2 after 16 h culture with anti-CD3 plus anti-CD28. (G) Frequencies of IL2+ of Vα2+ CD4 T cells and nonanergic and anergic T cells after 16 h culture with anti-CD3 plus anti-CD28. (H and I) Proliferative responses of peripheral naive CD25 CD4 T cells loaded with CTV dye after culture with TCRα−/− splenocytes plus 0.1 µM OVA peptide for 4 d. (H) Dilution of CTV of Vα2+ CD4 T cells by flow cytometry. (I) Frequencies of proliferating cells (CTVlow). Data are representative of three independent experiments. Two-tailed Student’s t test was performed. ***, P < 0.0005.
Figure 6.
Figure 6.
Loss of Cbl-b in W131AOTII mice significantly altered gene expression profile. (A) RNA sequencing revealed heatmap analysis of gene expression of peripheral naive (CD44low CD62L+) CD25Vα2+ CD4 T cells (n = 3–12 mice/group). (B) Principal component analysis of CD25Vα2+ peripheral naive CD4 T cells from the indicated mouse strains. (C) Top five signaling pathways enriched in peripheral naive Cbl-b−/−W131AOTII T cells compared with W131AOTII T cells. (D) MA plot revealed the top 20 genes whose expressions were highly differentiated in peripheral Cbl-b−/−W131AOTII compared with those from W131AOTII mice. (E–H) RNA sequencing revealed gene expression of anergy-associated genes (E), Socs genes (F), Ubc (G), and anti-apoptotic Bcl2 (H) in peripheral naive CD25Vα2+CD4+ from the indicated mice. The expression values were normalized by fragments per kilobase of transcript per million reads (FPKM). FDR-corrected *, P < 0.05; **, P < 0.005; ***, P < 0.0005. GO, gene ontology; ID, identification.
Figure S5.
Figure S5.
Loss of Cbl-b in W131AOTII mice altered gene expression profile. (A) Principal component analysis with principal component 1 (PC1) and PC3 of CD25Vα2+ peripheral naive CD4 T cells from the indicated mouse strains (n = 3–12 mice/group). (B) Expression of genes that belong to gene ontology: 0002376–immune system process pathway in peripheral naive CD25Vα2+CD4+ T cells from Cbl-b−/−W131AOTII mice was compared with those cells from W131AOTII mice. (C) Volcano plot revealed expression of anergy-associated genes, T reg cell–associated genes, inhibitory genes influencing cytokines and TCR signaling, and exhaustion genes in peripheral naive CD25Vα2+CD4+ T cells from Cbl-b−/−W131AOTII mice compared with those cells from W131AOTII mice. NA, not applicable.
Figure 7.
Figure 7.
Loss of Cbl-b in W131AOTII mice rescued calcium responses and TCR signaling. (A) Peripheral T cells were mixed together, identified by congenic markers CD45.1x CD45.2 (OTII) and CD45.2 (Cbl-b−/−W131AOTII or W131AOTII, or Cbl-b−/−W131AOTII), and loaded with Indo-1 to detect intracellular calcium. (B) Cells were stimulated with 10 µg/ml anti-CD3, followed by cross-linking with 20 µg/ml anti–Armenian hamster IgG, and 1 µM ionomycin. (C and D) Peripheral OTII and Cbl-b−/−OTII or W131AOTII or Cbl-b−/−W131AOTII CD4 T cells were culture with anti-CD3/CD28 Dynabeads for 3 h. Cell were loaded with Indo-1 for 30 min to detect intracellular calcium. (C) Flow cytometry shows bead-bound cell binding has higher side scatter (SSC-A) than unbound cells. FSC-A, forward side scatter. (D) Calcium changes in bead-bound and unbound cells. Cells were stimulated with 1 µM ionomycin. (E) Calcium changes in bead-bound and unbound OTII T cells incubated with 10 µM PP2. (F) Immunoblot analysis of AKT and ERK phosphorylation in peripheral naive CD4+ T cells stimulated with anti-CD3 (1 µg/ml) followed by cross-linking with anti–Armenian hamster IgG (20 µg/ml) for 2 min (n = 3–6 mice/group). (G and H) Immunoblot analysis (G) and flow-based assessment (H) of AKT and ERK phosphorylation in peripheral naive CD25Va2+CD4+ T cells stimulated with plate-bound anti-CD3 (1 µg/ml) for 2 h (n = 3–6 mice/group). (I–L) Peripheral naive CD4+ T cells were cultured with OVA (0.1 µM) with or without cyclosporin A (CsA; 10 µg/ml) or anti-CD3 (0.5 µg/ml) plus anti CD28 (2 µg/ml) with or without CsA (10 µg/ml). (I) Flow cytometry of peripheral CD4+Vα2+ T cells stained for CD25 and IL-2. (J–L) Bar chart indicating mean frequencies ± SD for IL-2+ (J), CD25+ (K), and CD69+ (L) of Vα2+CD4+ T cells (n = 3 mice/group). Data are representative of at least two independent experiments. Two-tailed Student’s t test was performed. **, P < 0.005; ***, P < 0.0005.

Similar articles

Cited by

References

    1. Anandasabapathy, N., Ford G.S., Bloom D., Holness C., Paragas V., Seroogy C., Skrenta H., Hollenhorst M., Fathman C.G., and Soares L.. 2003. GRAIL: an E3 ubiquitin ligase that inhibits cytokine gene transcription is expressed in anergic CD4+ T cells. Immunity. 18:535–547. 10.1016/S1074-7613(03)00084-0 - DOI - PubMed
    1. Bachmaier, K., Krawczyk C., Kozieradzki I., Kong Y.Y., Sasaki T., Oliveira-dos-Santos A., Mariathasan S., Bouchard D., Wakeham A., Itie A., et al. . 2000. Negative regulation of lymphocyte activation and autoimmunity by the molecular adaptor Cbl-b. Nature. 403:211–216. 10.1038/35003228 - DOI - PubMed
    1. Benjamini, Y., and Hochberg Y.. 1995. Controlling the False Discovery Rate - a Practical and Powerful Approach to Multiple Testing. J. R. Stat. Soc. B. 57:289–300. 10.1111/j.2517-6161.1995.tb02031.x - DOI
    1. Boursalian, T.E., Golob J., Soper D.M., Cooper C.J., and Fink P.J.. 2004. Continued maturation of thymic emigrants in the periphery. Nat. Immunol. 5:418–425. 10.1038/ni1049 - DOI - PubMed
    1. Breed, E.R., Watanabe M., and Hogquist K.A.. 2019. Measuring Thymic Clonal Deletion at the Population Level. J. Immunol. 202:3226–3233. 10.4049/jimmunol.1900191 - DOI - PMC - PubMed

Publication types

MeSH terms

Substances