Clinical Trial
. 2021 Oct 21;138(16):1391-1405.
doi: 10.1182/blood.2021010858.

Investigation of product-derived lymphoma following infusion of piggyBac-modified CD19 chimeric antigen receptor T cells

Affiliations
Clinical Trial

Investigation of product-derived lymphoma following infusion of piggyBac-modified CD19 chimeric antigen receptor T cells

Kenneth P Micklethwaite et al. Blood. .

Abstract

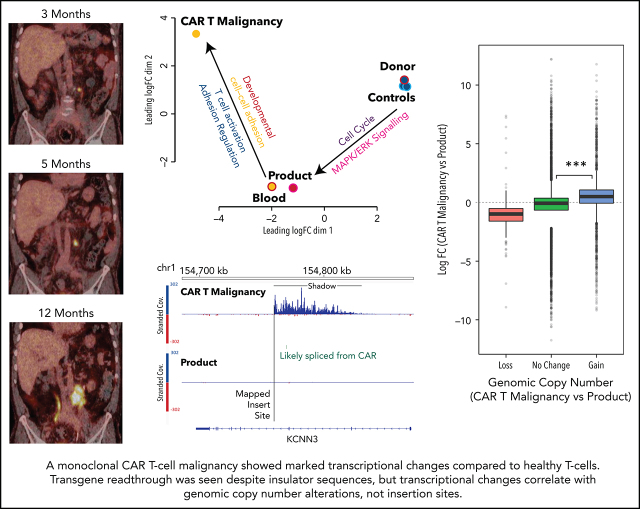
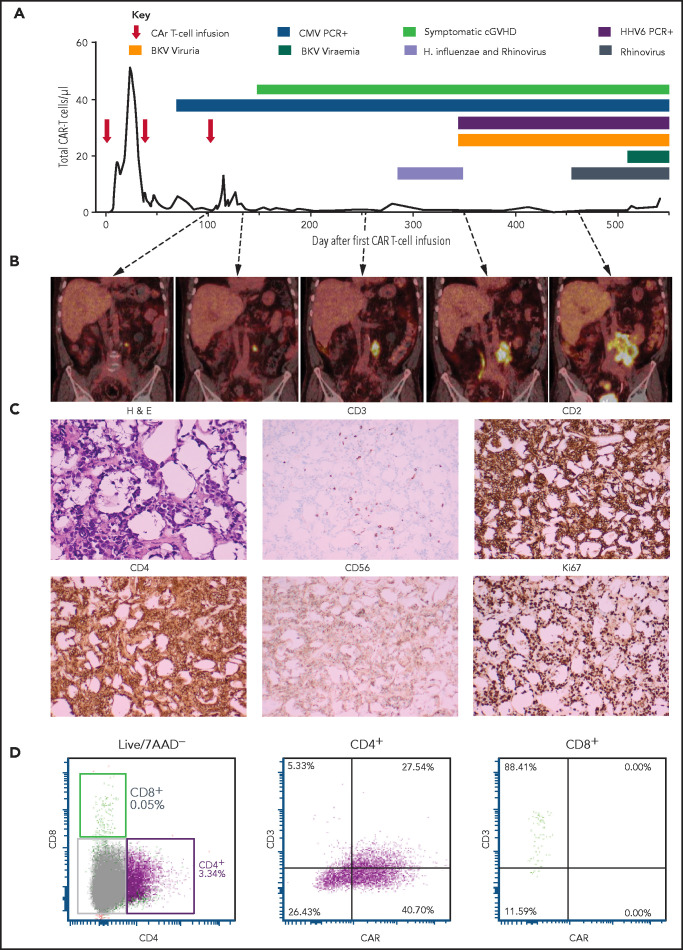
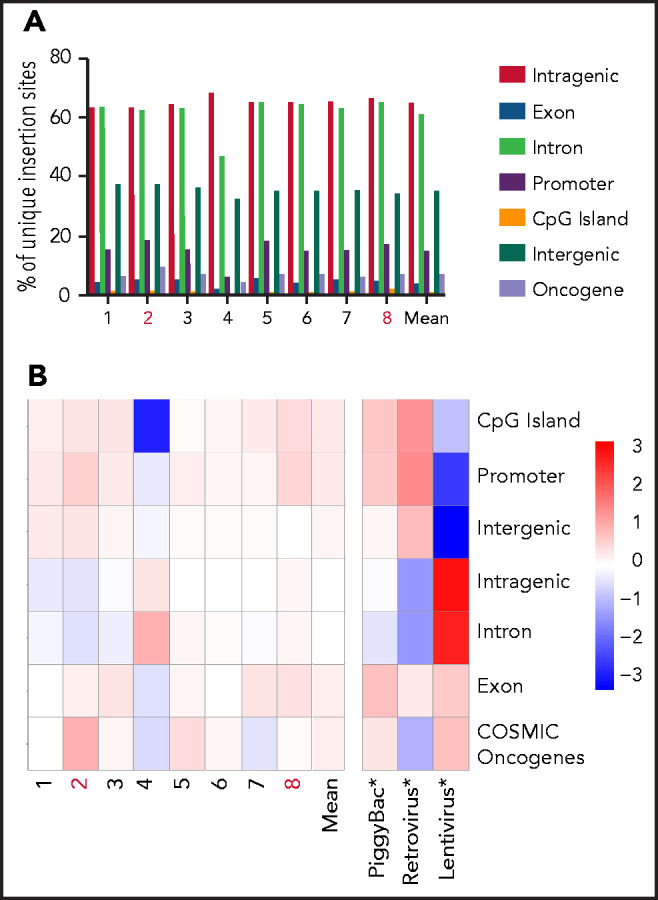
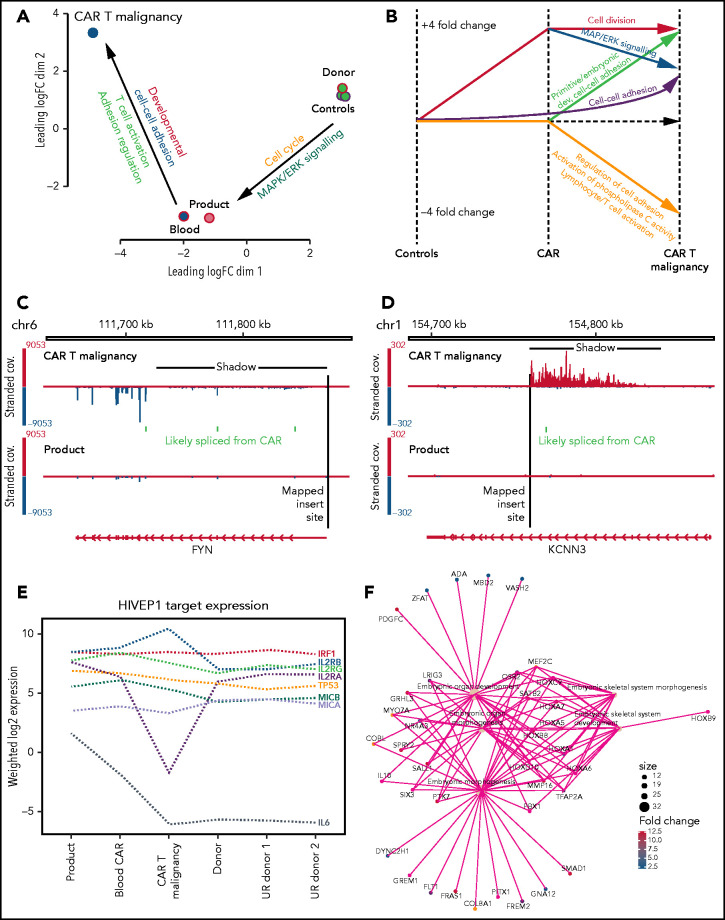
We performed a phase 1 clinical trial to evaluate outcomes in patients receiving donor-derived CD19-specific chimeric antigen receptor (CAR) T cells for B-cell malignancy that relapsed or persisted after matched related allogeneic hemopoietic stem cell transplant. To overcome the cost and transgene-capacity limitations of traditional viral vectors, CAR T cells were produced using the piggyBac transposon system of genetic modification. Following CAR T-cell infusion, 1 patient developed a gradually enlarging retroperitoneal tumor due to a CAR-expressing CD4+ T-cell lymphoma. Screening of other patients led to the detection, in an asymptomatic patient, of a second CAR T-cell tumor in thoracic para-aortic lymph nodes. Analysis of the first lymphoma showed a high transgene copy number, but no insertion into typical oncogenes. There were also structural changes such as altered genomic copy number and point mutations unrelated to the insertion sites. Transcriptome analysis showed transgene promoter-driven upregulation of transcription of surrounding regions despite insulator sequences surrounding the transgene. However, marked global changes in transcription predominantly correlated with gene copy number rather than insertion sites. In both patients, the CAR T-cell-derived lymphoma progressed and 1 patient died. We describe the first 2 cases of malignant lymphoma derived from CAR gene-modified T cells. Although CAR T cells have an enviable record of safety to date, our results emphasize the need for caution and regular follow-up of CAR T recipients, especially when novel methods of gene transfer are used to create genetically modified immune therapies. This trial was registered at www.anzctr.org.au as ACTRN12617001579381.


Figures

None
Graphical abstract
Figure 1.
Figure 1.
Patient 2 clinical summary, PET scans, and histological features of the CAR T-cell malignancy. (A) Timing of CAR T-cell infusions (red arrows), peripheral blood CAR T-cell quantitation (solid black line), chronic graft-versus-host disease (cGVHD), and infections (colored bars) over time. (B) PET scans showing the left para-aortic lymph node tumor seen from just prior to the third CAR T-cell infusion. (C) Morphology and immunohistochemical staining of tumor biopsy showing aberrant T cells with scanty cytoplasm and enlarged hyperchromatic nuclei, with low/negative CD3 and high CD2, CD4, and Ki67 with moderate CD56 staining. The Ki-67 proliferation index was 99%. The cells were negative for CD5, CD7, CD8, BCL-2, and CD10. Specific stains are shown above each image; original magnifications ×400 for H & E and ×50 for immunohistochemistry images. (D) Flow cytometry assessment of CAR expression on live T cells directly isolated from a biopsy of the para-aortic tumor showing that aberrant CD4+ T cells (purple) with reduced CD3 expression predominantly express CAR compared with a small CD8+ T-cell population (green) with normal CD3 expression and nil CAR expression. 7AAD, 7-amino actinomycin D; BKV, BK virus; CMV, cytomegalovirus; H. influenzae, Haemophilus influenzae; H&E, hematoxylin and eosin; HHV6, human herpesvirus 6; PCR, polymerase chain reaction.
Figure 2.
Figure 2.
Immunophenotype of malignant CAR T cells. (A) UMAP plots comparing phenotype of the donor-derived CAR T-cell product and malignant CAR T cells: (left) combined plot showing CD3+CD4CD8+ (cluster 1, red dots), CD3+CD4+CD8 (cluster 2, green dots), and CD3CD4+CD8 (cluster 3, blue dots) cells; (middle) plot showing differences in CD4, CD8, and CD3 expression between malignant CAR T cells (aquamarine dots falling in cluster 2 and cluster 3) and the donor-derived product (red dots falling in cluster 1 and 2); and (right) expression of the CAR19 transcript of CD3+ and CD3 cells (dot plot). (B) Expression of lineage markers on malignant cells including B cells, macrophages, monocytes, dendritic cells (DC), NK cells, and γ-δ T cells. (C) T-cell memory, (D) T-helper subtype, and (E) activation and inhibitory molecule expression of malignant T cells. CLR, centered log ratio.
Figure 3.
Figure 3.
Flow cytometry assessment of cell-surface CAR expression in cultured malignant CAR T cells and assessment of basal activation of unstimulated malignant CAR T cells. (A) Viable cells in stimulated tumor-derived malignant CAR T-cell cultures (red) compared with blood-derived CAR T cells (black) at the end of 4-week culture. (B) Cultured tumor-derived CD3, CD2high, CD4low malignant CAR T cells (red dots) showing high CAR expression compared with the mixed CD4+ and CD8+, CD3+ CAR T cells expanded from the peripheral blood (black dots) over 2 weeks. (C) Histograms showing phosphorylation levels of mediators of activation in unstimulated CD4+ T cells from untransduced donor PBMC (donor, top row), the CAR T-cell product (product, middle row), and directly isolated malignant CAR T cells (CAR T malignancy, bottom row). Histograms from samples stained with the phosphor-specific antibody (red lines) were compared with fluorescence minus one (FMO) samples (black lines) stained with surface antibodies only. (D) Heat map of relative phosphorylation status of CD3ζ, ZAP70, and AKT in different conditions corrected for autofluorescence using the resolution metric (RD), where RD = (MFIstained − MFIFMO)/(rSDstained + rSDFMO). MFI, median fluorescent intensity; rSD, robust standard deviation; SSC-A, side scatter area.
Figure 4.
Figure 4.
Pattern of integration in piggyBac-derived products administered to patients. (A) Distribution of total unique integration sites in 5 individual CARTELL trial (patients 1-3, 7, and 8) and 3 compassionate access (patients 4-6) products showing a similar insertion pattern in the product of patient 2 (within genes, 63%; exons, 5%; introns, 62%; promoters, 18%; cytosine guanine dinucleotide [CpG] islands, 1%; intergenic regions, 37%; and oncogenes, 9%) compared with the mean of other products (within genes, 65%; exons, 4%; introns, 61%; promoters, 15%; CpG islands, 1%; intergenic regions, 35%; and oncogenes, 7%). All products were from healthy stem cell transplant donors. (B) Distribution of CAR gene insertions in CAR T-cell products and published data sets (denoted with an asterisk in the image) for lentivirus, piggyBac, and retrovirus compared with a statistically random distribution throughout the genome. The departure from an expected random distribution is indicated by the colored tile, with red denoting enrichment compared with random and blue indicating depleted compared with random. Note: Products administered to patients subsequently developing CAR T-cell malignancies (2 and 8) are highlighted in red lettering. The COSMIC database was accessed at https://cancer.sanger.ac.uk/cosmic/download.
Figure 5.
Figure 5.
SVs across whole-genome-sequenced samples. (A) UpSet plot showing the intersection of SV calls across DNA extracted from CD4+ T cells isolated from untransduced healthy donor T cells (donor), CD4+ CAR T cells from the CAR T-cell product (product), expanded from patient 2’s peripheral blood (blood) and directly isolated from the malignancy (CAR T Malignancy). SVs detected uniquely within each sample are shaded in colors, maintained throughout the figure. On the bottom left is the number of calls per sample; intersections between samples (black) are shown by connecting bars in the lower right plot. (B) Distribution of SVs called uniquely for each sample, including SV type (3UTR, 3′ untranslated region; 5UTR, 5′ untranslated region; DEL, deletion; DUP, duplication; INS, insertion; INV, inversion; ncRNA, noncoding RNA; pseudo, pseudogene; TRA, translocation; TTS, triplex target DNA site), the length of each SV, and the genomic annotation per SV.
Figure 6.
Figure 6.
Transcription analysis of malignant CAR T cells compared with nonmalignant CAR+ and untransduced T cells. (A) Multidimensional scaling of global gene expression from malignant CAR T cells (CAR T malignancy), nonmalignant CD4+ CAR T cells from the peripheral blood (Blood) and product (Product) and 3 untransduced healthy donor CD4+ T cells (Donor Controls). (B) Line drawing showing fourfold differential expression of clusters of genes in the malignant CAR T cells (CAR T malignancy) compared with CD4+ T cells from the CAR T-cell product (CAR) and untransduced related healthy donor T cells (Controls). (C) Examples of transcriptional readthrough/shadow seen in the malignant CAR T cells at the point of insertion in the FYN gene producing increased negative strand exonic expression and (D) transcriptional readthrough at the point of insertion in the KCNN3 gene showing no increase in exonic expression as visualized using the IGV. (E) Relative levels of expression of genes identified in hg38 using PWMtools as containing the HIVEP1-binding motif (KGGGAAATCCCn) in promoter/enhancer regions in CAR+ CD4+ T cells isolated from the product, expanded from the peripheral blood (Blood CAR), malignant CAR T cells (CAR T malignancy), as well as untransduced CD4+ T cells from the sibling donor (Donor) and unrelated healthy donors (UR donor 1, UR donor 2). (F) Example of primitive embryonic gene-ontology clusters seen to be increased in the malignant CAR T cells compared with both product and untransduced donor CD4+ T cells.
Figure 7.
Figure 7.
Correlation of insertion site and gene expression in CAR T-cell malignancy and infused CAR T-cell product. (A) Circos plot produced using the circlize package showing the changes found in the malignant CAR T cells related to individual chromosomes (Coordinates and Banding) including: CAR transgene insert sites (lines at each genomic position); SV density (gray density plot); genetic copy-number variation (red bars, increased; blue bars, reduced copy numbers); contiguous regions of the genome containing more differentially expressed genes (DEG) than expected by chance (Enriched for DEG, purple bars) defined using a binomial test for DE vs non DE over 10 Mbp windows (adjusted P < .05); all DEG with log-fold change (logFC) (Malignancy vs product) of >4 (DEG Expr) (logFC, adjusted P < .05) plotted at their genome coordinates (green, up; blue, down); and overall levels of gene expression (All Gene Exp Dens), with all genes binned as overexpressed (red density plot) or underexpressed (blue density plot) in malignancy vs product (logFC > or < 0) with gene density plotted as a function of distance over the genome. (B) Correlation between copy-number variation and altered gene expression showing correlation between copy-number gain and increased gene expression (blue box) in the malignant CAR T cells (Malignancy) compared with CAR+CD4+ T cells isolated from the product. ***P < .0001.

Comment in

References

    1. Maude SL, Laetsch TW, Buechner J, et al. Tisagenlecleucel in children and young adults with B-cell lymphoblastic leukemia. N Engl J Med. 2018;378(5):439-448. - PMC - PubMed
    1. Neelapu SS, Locke FL, Bartlett NL, et al. Axicabtagene ciloleucel CAR T-cell therapy in refractory large B-cell lymphoma. N Engl J Med. 2017;377(26):2531-2544. - PMC - PubMed
    1. Hacein-Bey-Abina S, Von Kalle C, Schmidt M, et al. LMO2-associated clonal T cell proliferation in two patients after gene therapy for SCID-X1. Science. 2003; 302(5644):415-419. - PubMed
    1. Howe SJ, Mansour MR, Schwarzwaelder K, et al. Insertional mutagenesis combined with acquired somatic mutations causes leukemogenesis following gene therapy of SCID-X1 patients. J Clin Invest. 2008;118(9):3143-3150. - PMC - PubMed
    1. Fraietta JA, Nobles CL, Sammons MA, et al. Disruption of TET2 promotes the therapeutic efficacy of CD19-targeted T cells. Nature. 2018;558(7709):307-312. - PMC - PubMed

Publication types

MeSH terms

Substances