. 2021 Jul;413(16):4181-4194.
doi: 10.1007/s00216-021-03372-x. Epub 2021 May 11.

(CO2)n+, (H2O)n+, and (H2O)n+ (CO2) gas cluster ion beam secondary ion mass spectrometry: analysis of lipid extracts, cells, and Alzheimer's model mouse brain tissue

Affiliations

(CO2)n+, (H2O)n+, and (H2O)n+ (CO2) gas cluster ion beam secondary ion mass spectrometry: analysis of lipid extracts, cells, and Alzheimer's model mouse brain tissue

Kelly Dimovska Nilsson et al. Anal Bioanal Chem. 2021 Jul.

Abstract

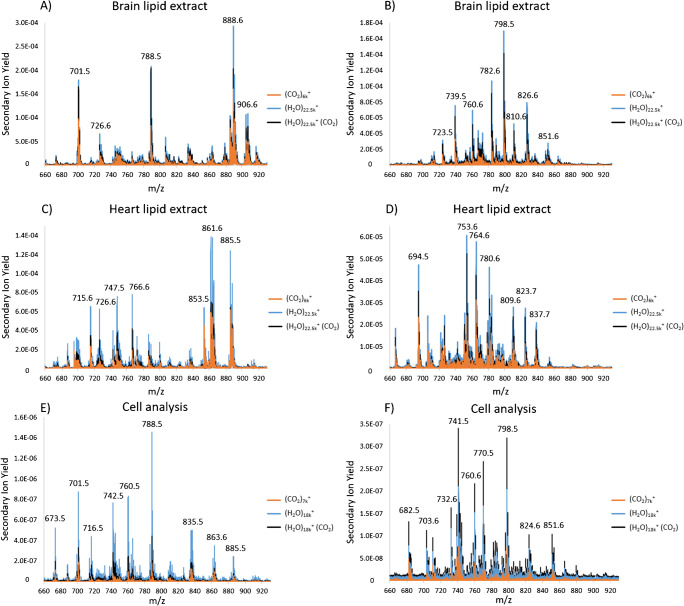
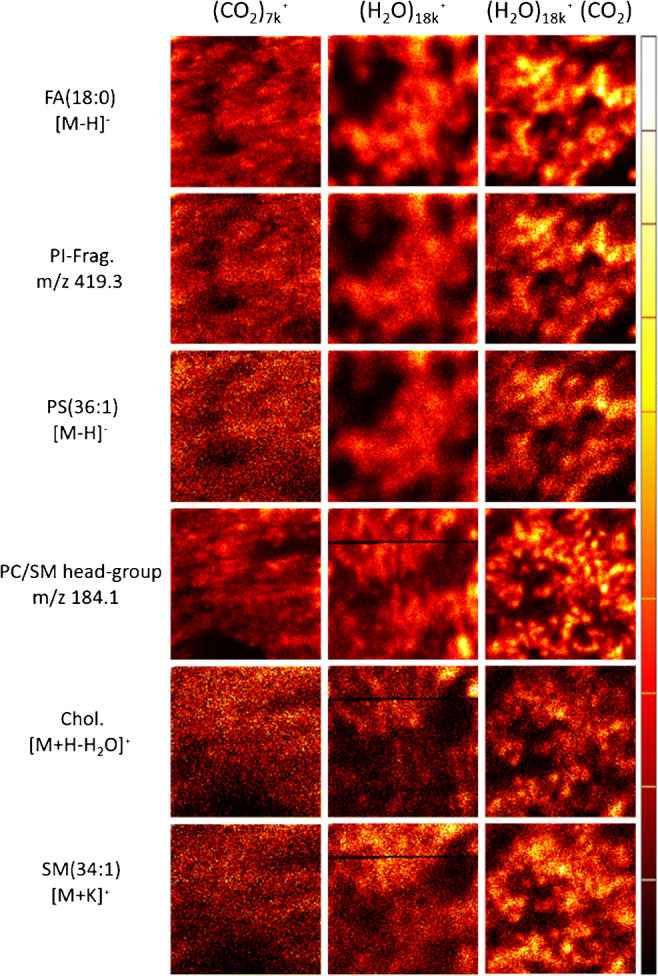
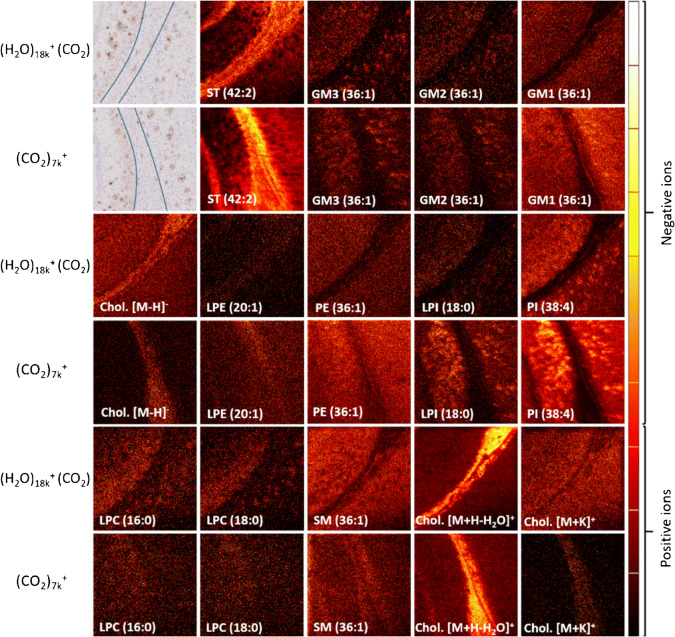
This work assesses the potential of new water cluster-based ion beams for improving the capabilities of secondary ion mass spectrometry (SIMS) for in situ lipidomics. The effect of water clusters was compared to carbon dioxide clusters, along with the effect of using pure water clusters compared to mixed water and carbon dioxide clusters. A signal increase was found when using pure water clusters. However, when analyzing cells, a more substantial signal increase was found in positive ion mode when the water clusters also contained carbon dioxide, suggesting that additional reactions are in play. The effects of using a water primary ion beam on a more complex sample were investigated by analyzing brain tissue from an Alzheimer's disease transgenic mouse model. The results indicate that the ToF-SIMS results are approaching those from MALDI as ToF-SIMS was able to image lyso-phosphocholine (LPC) lipids, a lipid class that for a long time has eluded detection during SIMS analyses. Gangliosides, sulfatides, and cholesterol were also imaged.

Keywords: Alzheimer’s; Imaging; Lipids; Mass spectrometry; SIMS; Water clusters.


Conflict of interest statement

The authors declare no competing interests.

Figures

Fig. 1
Fig. 1
AD Plots of various ion species from analysis of porcine brain lipid extract showing signal intensity versus E/n as the cluster size varies from 6000 to 25,000. Signal normalized to the highest signal. Characteristic high mass ions from two phosphatidylcholine (PC) lipids, PC(32:0) and PC(34:1), are shown in A and B, respectively. Head group ions from PC lipids are shown in C along with ions associated with cholesterol. [M-H] ions detected in negative ion mode are presented in D. 3D bar charts showing reduced fragmentation of various species with lower E/n are presented in E and F. Signal normalized to the signal when using cluster size 6000. Analysis area 200 μm × 200 μm with a fluence of 2.56 × 1012 ions/cm2
Fig. 2
Fig. 2
Excerpts of overlayed mass spectra of lipid extracts acquired in negative ion mode. A Porcine brain lipid extract. B Bovine heart lipid extract. The samples were analyzed using two different primary ion beams, (H2O)22.5k+ and (CO2)6k+. Analysis area 233 μm × 233 μm with a fluence of 2.54 × 1012 ions/cm2
Fig. 3
Fig. 3
Spectral overlays of excerpts from spectra of A, B porcine brain lipid extract, C, D bovine heart lipid extract, and E, F cells acquired with three different primary ion projectiles; (CO2)7k+, (H2O)18k+, and (H2O)18k+ (CO2). A, C, and E negative ion mode data. B, D, and F positive ion mode data. Lipid analysis area 233 μm × 233 μm with a fluence of 2.54 × 1012 ions/cm2. Cell analysis area 600 μm × 600 μm with a fluence of 1.02 × 1013 ions/cm3
Fig. 4
Fig. 4
Single ion images of cells analyzed with three different ion beams, (CO2)7k+, (H2O)18+, and (H2O)18+ (CO2). Single ion images of [FA:18:0 − H] (m/z 283.3, 0.04 ppm), PI-Frag. (m/z 419.3, 0.04 ppm), [PS(36:1) − H] (m/z 788.6, 3.0 ppm), PC/SM head group (m/z 184.1, 0.24 ppm), [Chol. + H-H2O]+ (m/z 369.4, 0.09 ppm), and [SM(34:1) + K]+ (m/z 741.5, 4.7 ppm). Analysis area 600 μm × 600 μm and a fluence of 1 × 1013 ions/cm2. Images are individually scaled to their maximum intensity to highlight signal distributions
Fig. 5
Fig. 5
Hematoxylin and β-amyloid-stained images of the areas analyzed with ToF-SIMS and single ion images of various species in the brain tissue. Single ion images of [ST(42:2) − H] (m/z 888.6, 0.04 ppm), [GM3(36:1) − H] (m/z 1179.8, 27.0 ppm), [GM2(36:1) − H] (m/z 1382.9, 37.3 ppm), [GM1(36:1) − H] (m/z 1544.9, 26.9 ppm), [Chol. − H] (m/z 385.4, 8.7 ppm), [LPE(20:1) − H] (m/z 506.3, 7.6 ppm), [PE(36:1) − H] (m/z 744.6, 5.4 ppm), [LPI(18:0) − H] (599.3, 7.6 ppm), [PI(38:4) − H] (m/z 885.6, 4.3 ppm), [LPC(16:0) + K]+ (m/z 534.3, 3.2 ppm), [LPC(18:0) + K]+ (m/z 562.3, 6.6 ppm), [Chol. + H-H2O]+ (m/z 369.4, 0.02 ppm), and [Chol. + K]+ (m/z 425.3, 3.5 ppm). The three most common isotopes have been added to create the single ion images of GM3, GM2, and GM1. The brightness of the single ion images of GM3, GM2 analyzed with (H2O)18k+ (CO2), and LPCs analyzed with (H2O)18k+ (CO2) and (CO2)7k+ has been increased by 66%. Analysis area 1250 μm × 1250 μm and a fluence of 2.1 × 1012 ions/cm2 for (H2O)18k+ (CO2) and 7.6 × 1012 ions/cm2 for (CO2)7k+. Images are individually scaled to their maximum intensity to highlight signal distributions

Similar articles

Cited by

References

    1. Dowsett D, Wirtz T. Co-registered in situ secondary electron and mass spectral imaging on the helium ion microscope demonstrated using lithium titanate and magnesium oxide nanoparticles. Anal Chem. 2017;89(17):8957–8965. - PubMed
    1. Vickerman JC. Molecular imaging and depth profiling by mass spectrometry-SIMS, MALDI or DESI? Analyst. 2011;136(11):2199–2217. - PubMed
    1. Porta Siegel T, Hamm G, Bunch J, Cappell J, Fletcher JS, Schwamborn K. Mass spectrometry imaging and integration with other imaging modalities for greater molecular understanding of biological tissues. Mol Imaging Biol. 2018;20(6):888–901. - PMC - PubMed
    1. Caprioli RM, Farmer TB, Gile J. Molecular imaging of biological samples: localization of peptides and proteins using MALDI-TOF MS. Anal Chem. 1997;69(23):4751–4760. - PubMed
    1. Takats Z, Wiseman JM, Gologan B, Cooks RG. Mass spectrometry sampling under ambient conditions with desorption electrospray ionization. Science. 2004;306(5695):471–473. - PubMed

LinkOut - more resources