Comparative Study
. 2021 May 11;16(5):e0251405.
doi: 10.1371/journal.pone.0251405. eCollection 2021.

Vegetative traits can predict flowering quality in Phalaenopsis orchids despite large genotypic variation in response to light and temperature

Affiliations
Comparative Study

Vegetative traits can predict flowering quality in Phalaenopsis orchids despite large genotypic variation in response to light and temperature

Evelien van Tongerlo et al. PLoS One. .

Abstract

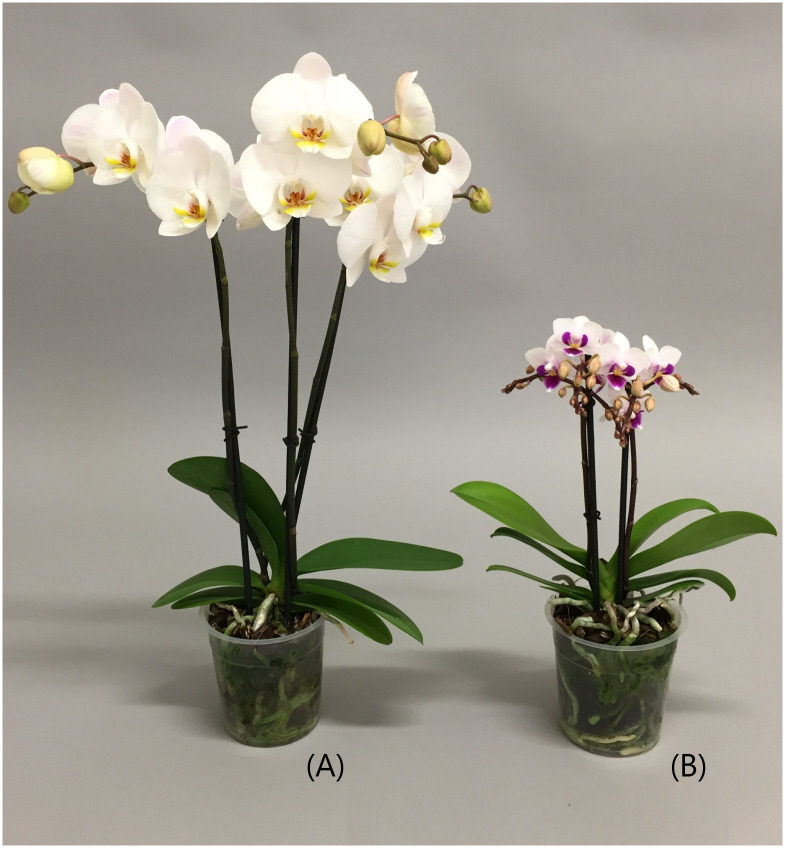
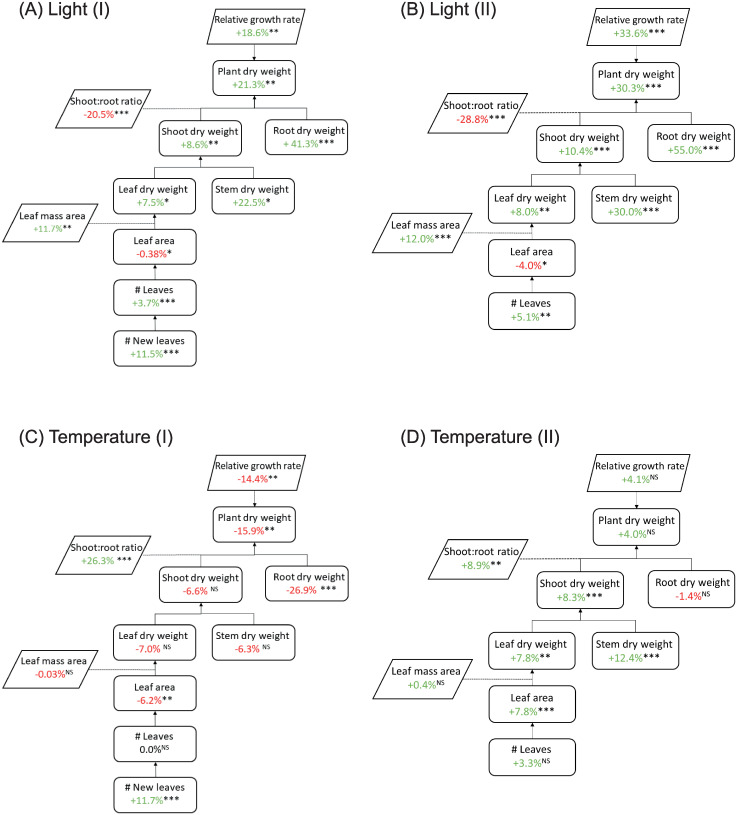
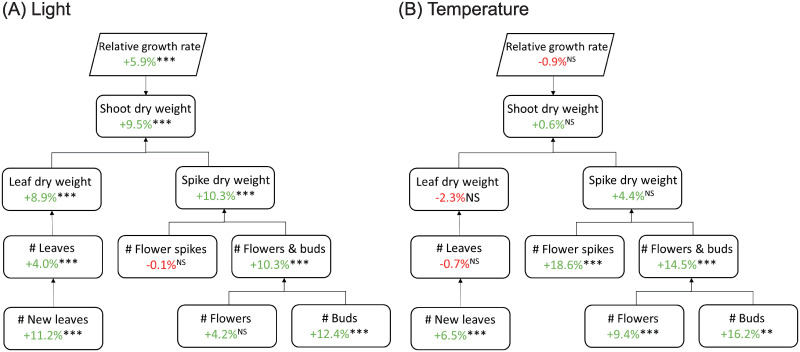
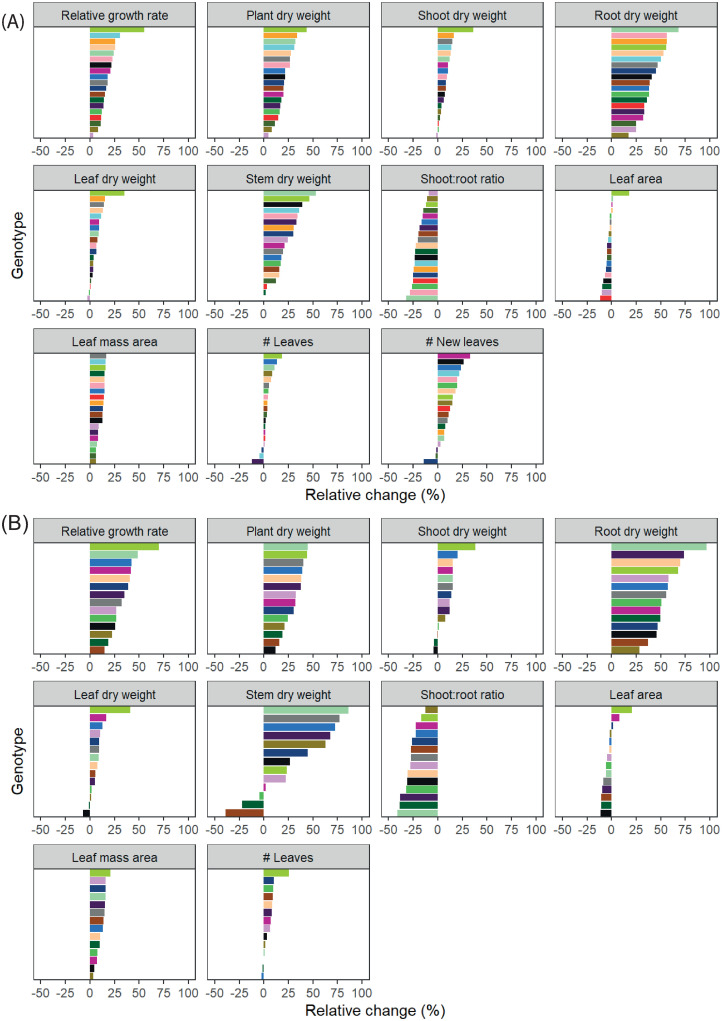
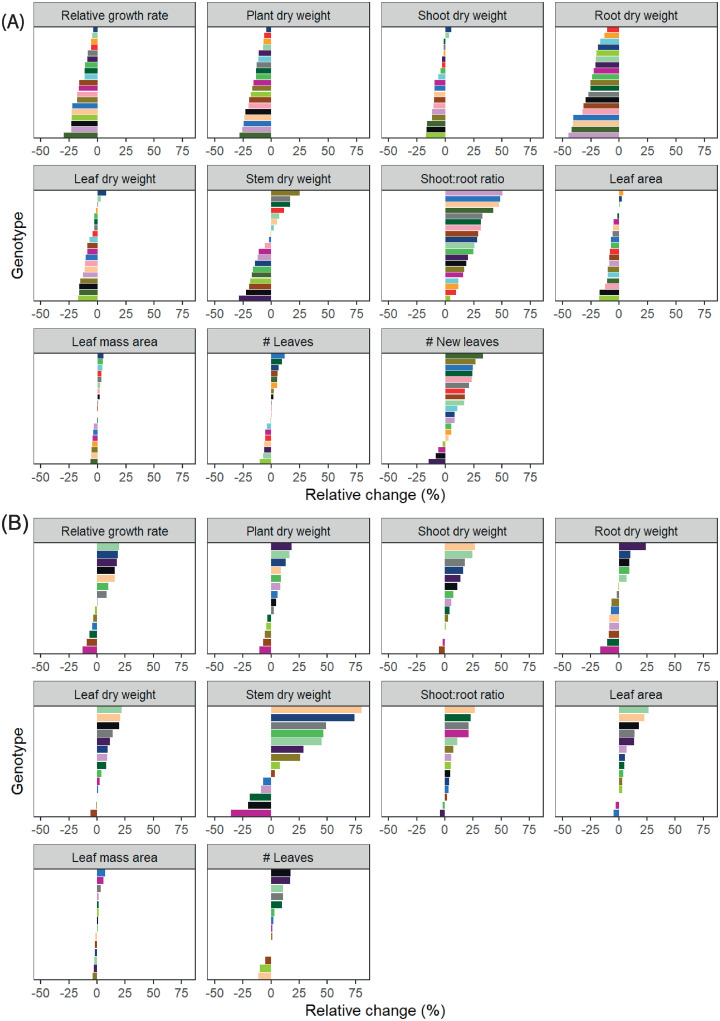
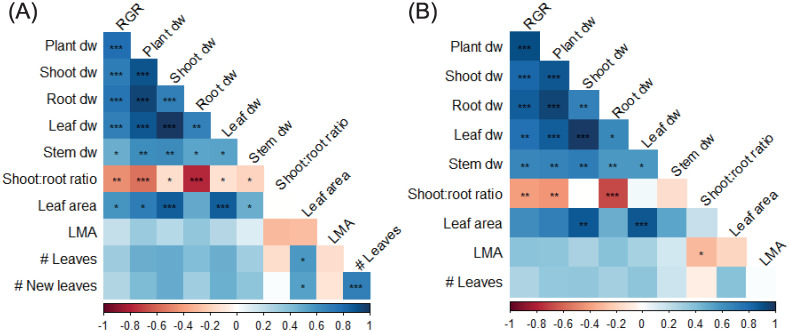
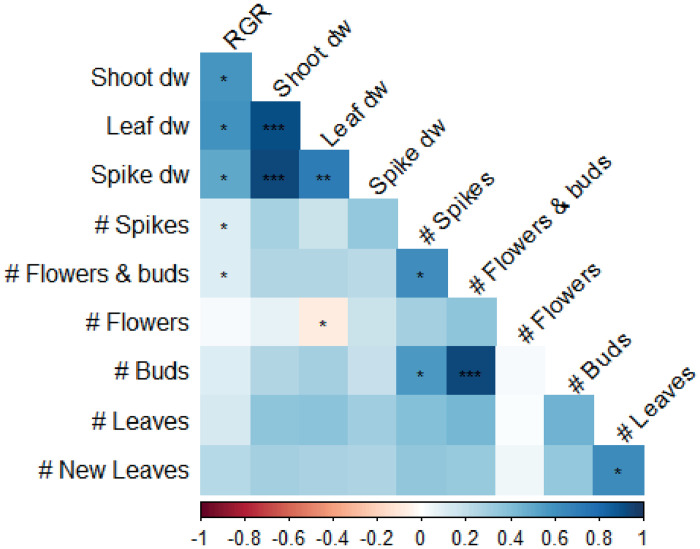
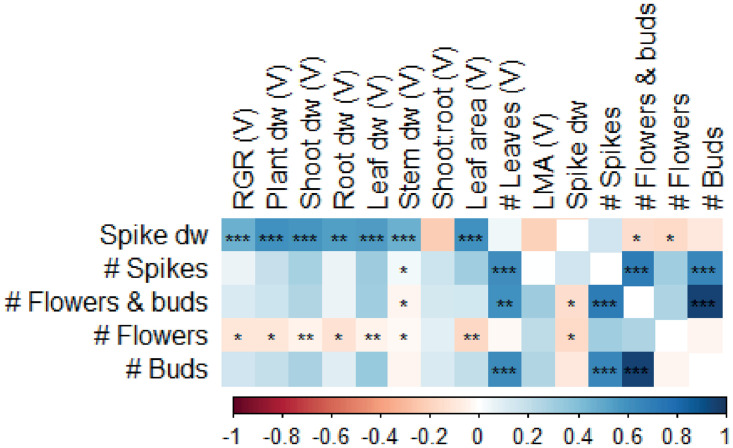
Phalaenopsis is an economically important horticultural ornamental, but its growth is slow and costly. The vegetative cultivation phase is long and required to ensure sufficient plant size. This is needed to develop high quality flowering plants. We studied the effects of temperature (27 or 31 °C) and light intensity (60 or 140 μmol m-2 s-1) on plant growth and development during the vegetative cultivation phase in two experiments, with respectively 19 and 14 genotypes. Furthermore, the after-effects of treatments applied during vegetative growth on flowering traits were determined. Increasing light intensity in the vegetative phase accelerated both vegetative plant growth and development. Increasing temperature accelerated vegetative leaf appearance rate, but strongly reduced plant and root biomass accumulation when temperatures were too high. Flowering was greatly affected by treatments applied during vegetative growth, and increased light and temperature increased number of flower spikes, and number of flowers and buds. Genotypic variation was large in Phalaenopsis, especially in traits related to flowering, thus care is needed when generalising results based on a limited number of cultivars. Plant biomass and number of leaves during vegetative growth were positively correlated with flowering quality. These traits can be used as an early predictor for flowering capacity and quality of the final product. Additionally, this knowledge can be used to improve selection of new cultivars.


Conflict of interest statement

This research is supported by the Netherlands Organization for Scientific Research (NWO), Anthura, Signify, Imac and B-Mex under contract number 14525. Anthura has provided plant material. Experiment II was conducted in climate chambers (vegetative) and greenhouse (flowering) of Anthura. Data in experiment II was collected by Anthura staff and EvT. Imac has provided consultancy oncultivation of the plants during the experiment. Signify has provided LED lamps used in both experiments. All funding partners have provided their input prior and during the project, but they had no role in data analysis or preparation of the manuscript. Project partners were never involved in final decision making about interpretation of results. There are no patents, products in development or marketed products to declare. This does not alter our adherence to PLOS ONE policies on sharing data and materials.

Figures

Fig 1
Fig 1. Representative phenotype of Phalaenopsis plant types Grandiflora (A) and Multiflora (B).
Fig 2
Fig 2. Trait component analysis of vegetative Phalaenopsis plants.
Main effects of light (A, B) and temperature (C, D). Plants were grown in climate chambers under LED lighting for 14 hours per day at a PPFD of 60 or 140 μmol m-2 s-1. In experiment I (A,C; n = 3; 5–7 plants per statistical replicate per genotype), plants of 19 genotypes were grown for 19 weeks at either 27°C or 31°C. In experiment II (B,D; n = 5; per genotype) 14 genotypes were grown for 15 weeks at either 26°C or 30°C. Data is averaged over genotypes, percentages represent average change per trait to reference light intensity (60 μmol m-2 s-1; A, B) or temperature (27°C, C;26° C, D). NS, *,**,*** are not significant or significant at p<0.05, p<0.01 and p<0.001, respectively. For temperature, significance was determined at α<0.01, for light at α<0.05.
Fig 3
Fig 3. Trait component analysis of flowering Phalaenopsis plants.
Effects of light (A) and temperature (B) treatments applied during the vegetative phase. During the vegetative phase, plants were grown in climate chambers for 23 weeks at either 26°C or 30°C, and a PPFD of 60 or 140 μmol m-2 s-1 for 14 hours per day. Plants from all treatments were then moved to the greenhouse for flower induction (8 weeks) and subsequent flowering phase. Plants of a genotype were harvested, when 2/3 reached the consumer-ready stage, defined as plants having two open flowers per plant (15–21 weeks, depending on genotype). Percentages represent average change per trait to either vegetative reference temperature (26°C) or light intensity (60 μmol m-2 s-1). NS, *,**,*** are not significant or significant at p<0.05, p<0.01 and p<0.001, respectively (n = 10 per genotype). For temperature, significance was determined at α<0.01, for light at α<0.05.
Fig 4
Fig 4. Genotypic variation in vegetative Phalaenopsis plants in response to light.
Plants were grown in climate chambers under LED lighting for 14 hours per day at a PPFD of 60 or 140 μmol m-2 s-1. In experiment I (A; n = 3; 5–7 plants per statistical replicate per genotype), plants of 19 genotypes were grown for 19 weeks at either 27°C or 31°C. In experiment II (B; n = 5; per genotype) 14 genotypes were grown for 15 weeks at either 26°C or 30°C. Data is averaged over temperature, and represents relative change per trait to light intensity (60 μmol m-2 s-1). Similar colours are similar genotypes, also in Figs 5 and 6.
Fig 5
Fig 5. Genotypic variation in vegetative Phalaenopsis plants in response to temperature.
Plants were grown in climate chambers under LED lighting for 14 hours per day at a PPFD of 60 or 140 μmol m-2 s-1. In experiment I (A; n = 3; 5–7 plants per statistical replicate per genotype), plants of 19 genotypes were grown for 19 weeks at either 27°C or 31°C. In experiment II (B; n = 5; per genotype) 14 genotypes were grown for 15 weeks at either 26°C or 30°C. Data is averaged over temperature, and represents relative change per trait to light intensity (60 μmol m-2 s-1). Similar colours are similar genotypes, also in Figs 4 and 6.
Fig 6
Fig 6. Genotypic variation in flowering Phalaenopsis plants of experiment II.
During the vegetative phase, plants were grown in climate chambers for 15 weeks at either 26°C or 30°C and a PPFD of 60 or 140 μmol m-2 s-1 for 14 hours per day. Plants from all treatments were simultaneously moved to the greenhouse for cooling and flowering phase until auction-ready; see material and methods for details. Data is averaged either over temperature, and represents relative change per trait to light intensity light intensity (60 μmol m-2 s-1)(A) or is averaged over light, and represents relative change per trait to temperature (26°C)(B)(n = 10), as applied during vegetative growth. Similar colours are similar genotypes, also in Figs 4 and 5.
Fig 7
Fig 7. Trait correlation matrix of vegetative Phalaenopsis plants.
Plants were grown in climate chambers under LED lighting for 14 hours per day at a PPFD of 60 or 140 μmol m-2 s-1. In experiment I (A; n = 3; 5–7 plants per statistical replicate per genotype), plants of 19 genotypes were grown for 19 weeks at either 27°C or 31°C. In experiment II (B; n = 5; per genotype) 14 genotypes were grown for 15 weeks at either 26°C or 30°C. Data is pooled over genotypes and growth treatment. Colours represent either negative (red) or positive (blue). Significant correlations are marked *,**,*** at p<0.05, p<0.01 and p<0.001, respectively. RGR = relative growth rate, LMA = leaf mass area, dw = dry weight.
Fig 8
Fig 8. Trait correlation matrix of flowering Phalaenopsis plants in experiment II.
During the vegetative phase, plants were grown in climate chambers for 23 weeks at either 26°C or 30°C and a PPFD of 60 or 140 μmol m-2 s-1 for 14 hours per day. Then, plants from all treatments were simultaneously moved to the greenhouse for flower induction and flowering phase until consumer-ready. Data is pooled over genotypes and growth treatment. Colours represent either negative (red) or positive (blue) correlations. Significant correlations are marked *,**,*** at p<0.05, p<0.01 and p<0.001, respectively. RGR = relative growth rate.
Fig 9
Fig 9. Correlation matrix of vegetative (V) traits with flowering Phalaenopsis plants in experiment II.
Data is averaged over genotypes and growth treatment. During the vegetative phase, plants were grown in climate chambers for 15 weeks at either 26°C or 30°C and a PPFD of 60 or 140 μmol m-2 s-1 for 14 hours per day, after which randomly selected plants were harvested. Plants were then allowed to grow for another 8 weeks, before plants from all treatments were simultaneously moved to the greenhouse for flower induction and flowering phase until consumer-ready. Colours represent either negative (red) or positive (blue) correlations. Significant correlations are marked *,**,*** at p<0.05, p<0.01 and p<0.001, respectively. RGR = relative growth rate, LMA = leaf mass area, dw = dry weight.

Similar articles

Cited by

References

    1. Davis SC, Simpson J, del Gil Vega, Niechayev NA, van Tongerlo E, Castano NH, et al.. Undervalued potential of crassulacean acid metabolism for current and future agricultural production. J Exp Bot. 2019;70(22):6521–37. 10.1093/jxb/erz223 - DOI - PMC - PubMed
    1. Christenson EA. Phalaenopsis—A monograph. Portland, Oregon: Timber Press; 2001.
    1. Blanchard M, Lopez R, Runkle ES, Wang Y-T. Growing the Best Phalaenopsis. Orchids. 2007;4:266–71. Available from: https://www.aos.org/AOS/media/Content-Images/PDFs/GrowingtheBestPhalaeno....
    1. van der Knaap N. Cultivation Guide Phalaenopsis: Knowledge for Professionals. Anthura; 2005.
    1. Atkinson D, Porter JR. Temperature, plant development and crop yields. Trends Plant Sci. 1996;1(4):119–24.

Publication types

LinkOut - more resources