

Audiologic Profiles of Children With Otitis Media With Effusion
- PMID: 33974785
- PMCID: PMC8387329
- DOI: 10.1097/AUD.0000000000001038
Audiologic Profiles of Children With Otitis Media With Effusion
Abstract
Objectives: To describe the impact of effusion volume, viscosity, and purulence on the audiologic profiles of children with otitis media with effusion.
Design: Fifty-one ears from children between the ages of 8 months and 11 years who had a diagnosis of otitis media with effusion and were scheduled for tympanostomy tube placement were recruited from medical clinics. The control group consisted of 17 ears from children between the ages of 10 months and 11 years without a recent history of otitis media and were recruited from a database of research volunteers. Participants received a comprehensive audiologic testing battery consisting of tympanometry, otoacoustic emissions, behavioral audiometric thresholds, and auditory brainstem response testing. For children with otitis media, this testing battery occurred 1 to 2 days before surgery. Middle ear effusions were characterized and collected on the day of surgery during tympanostomy tube placement from ears with otitis media with effusion. The comprehensive audiologic testing battery was completed postoperatively as well for most participants.
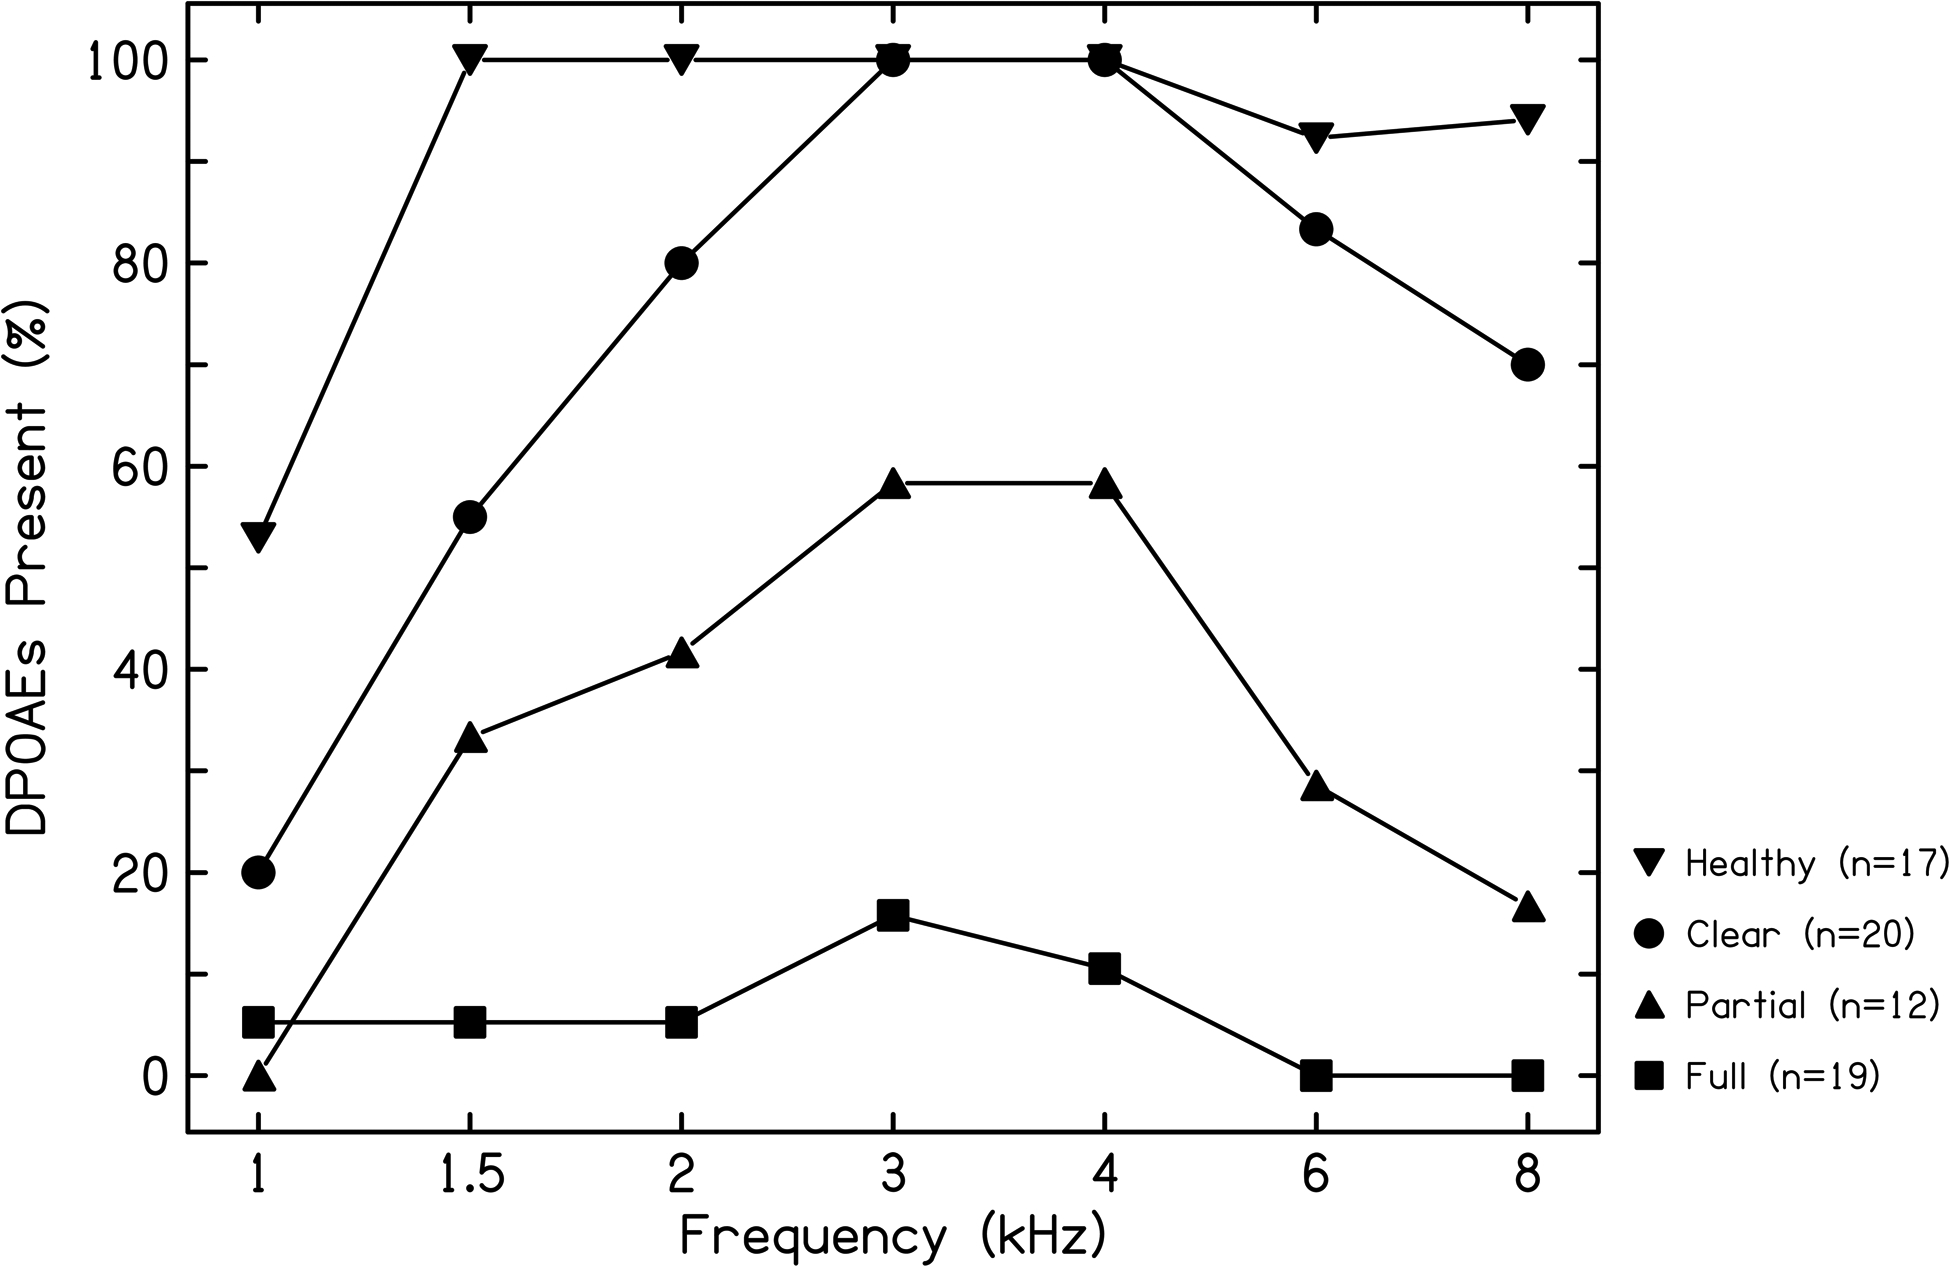
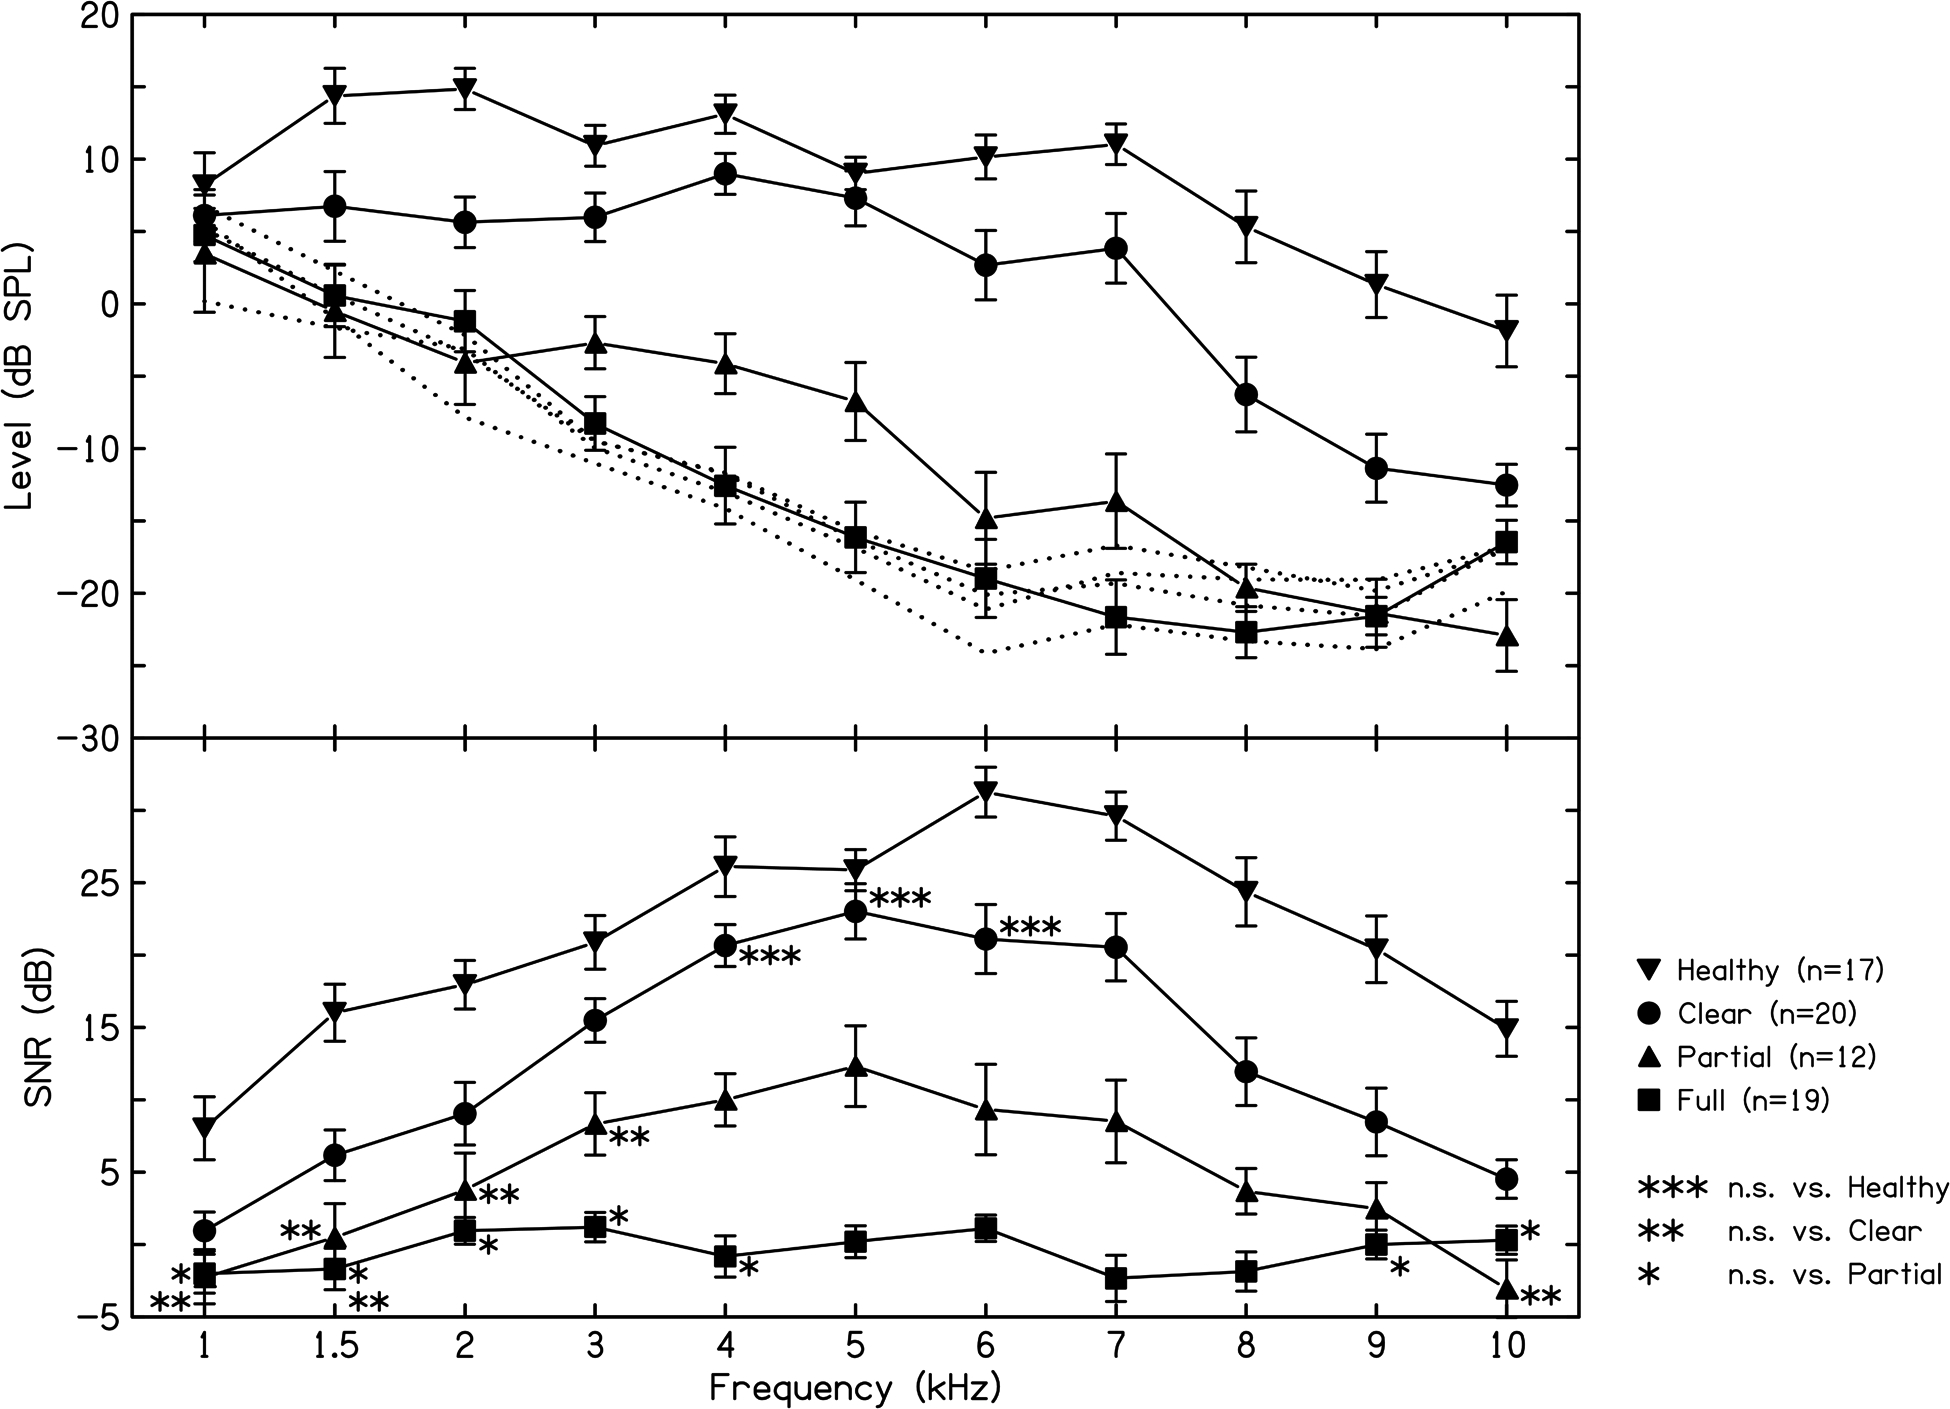
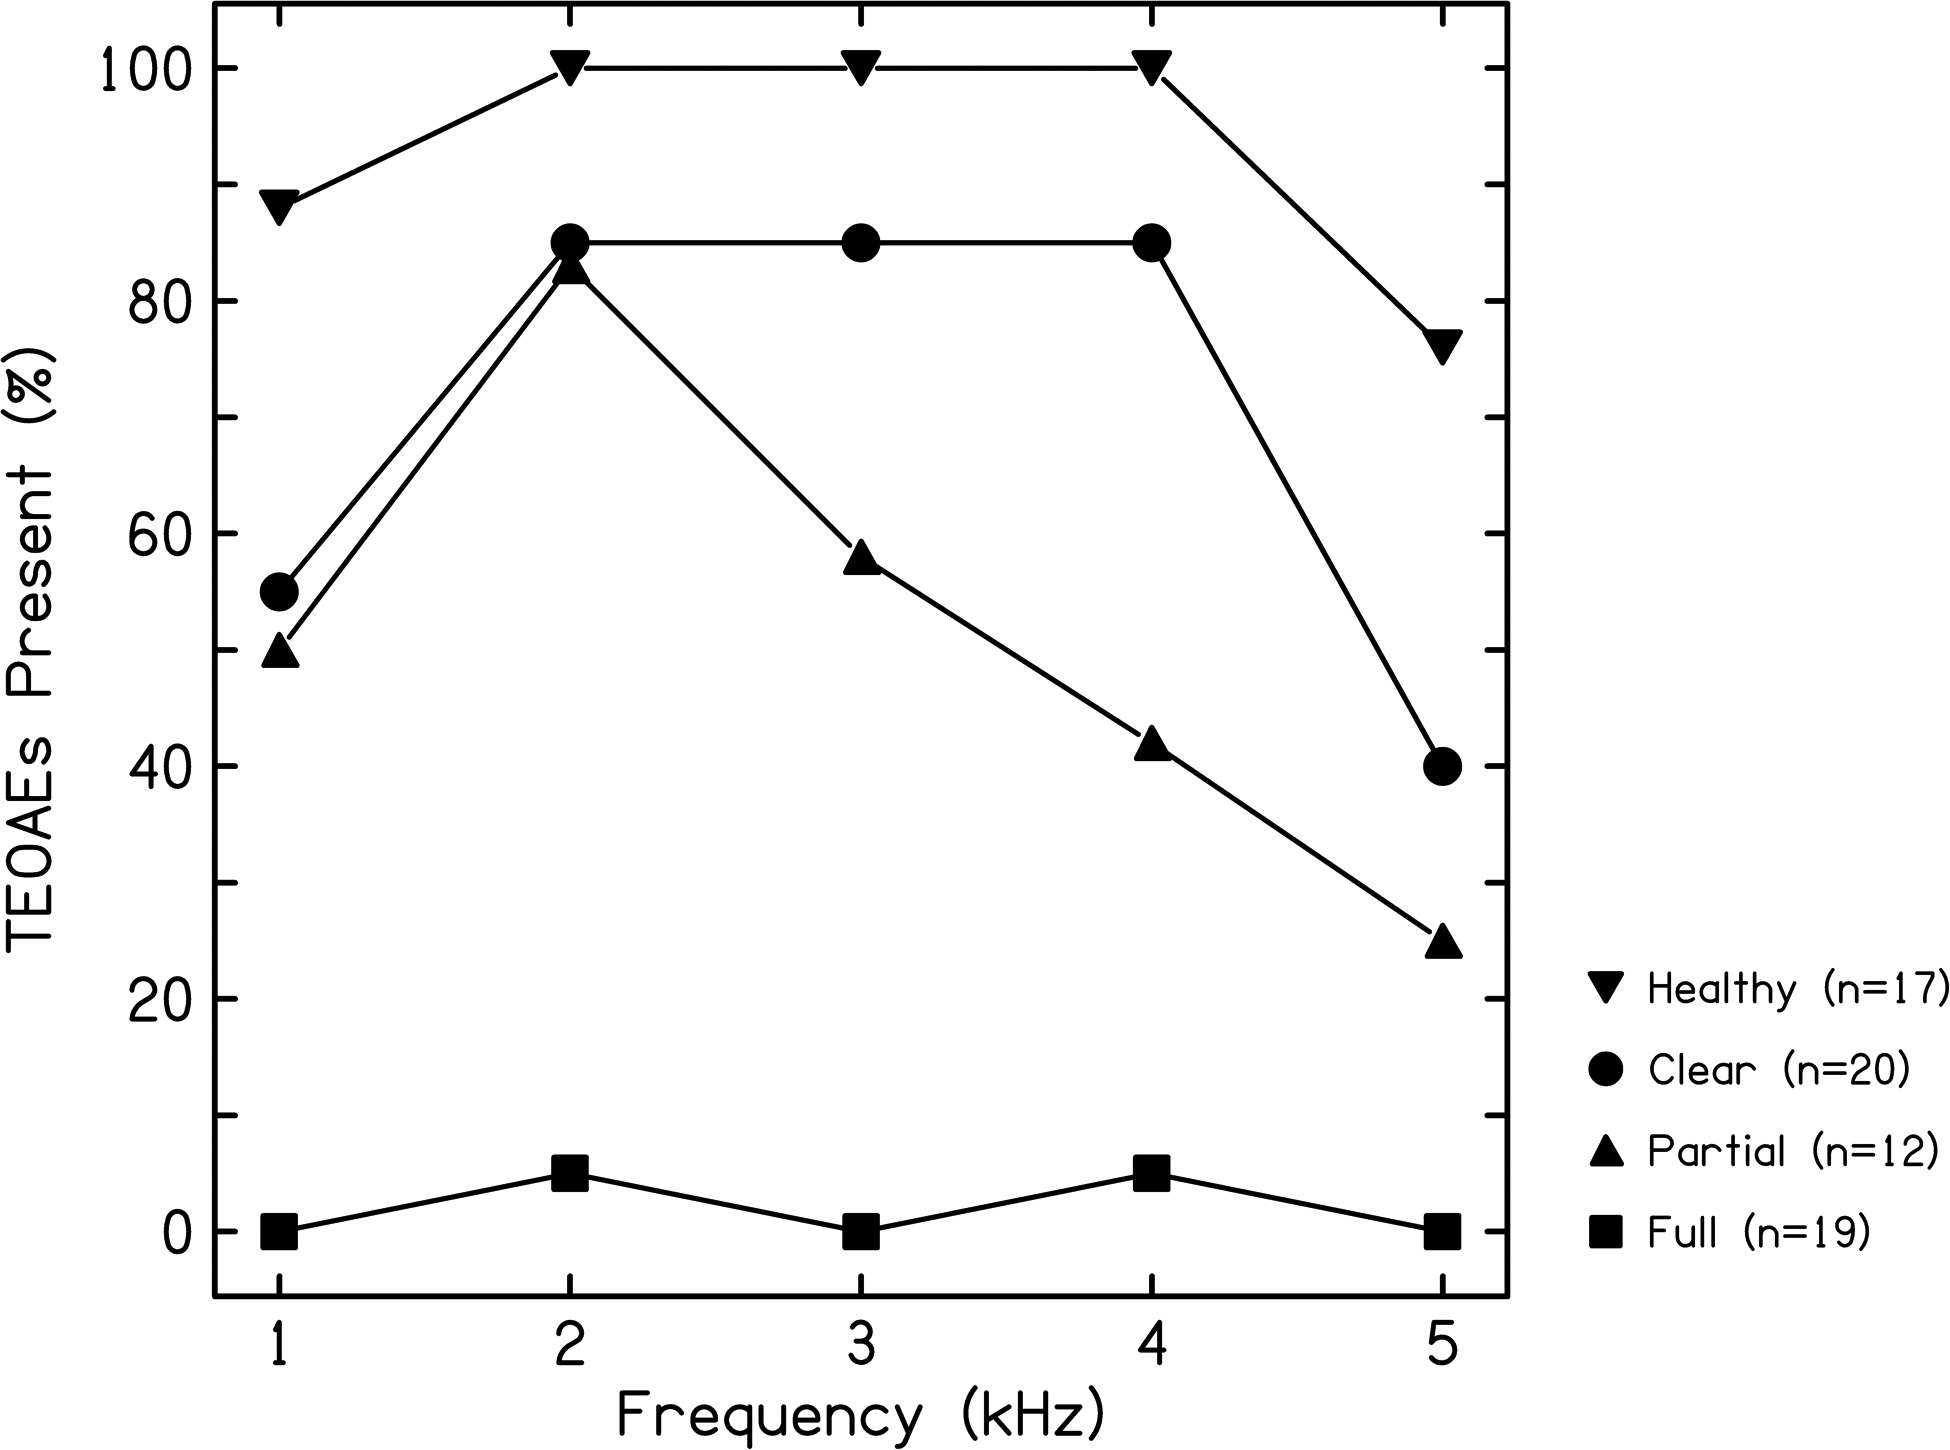
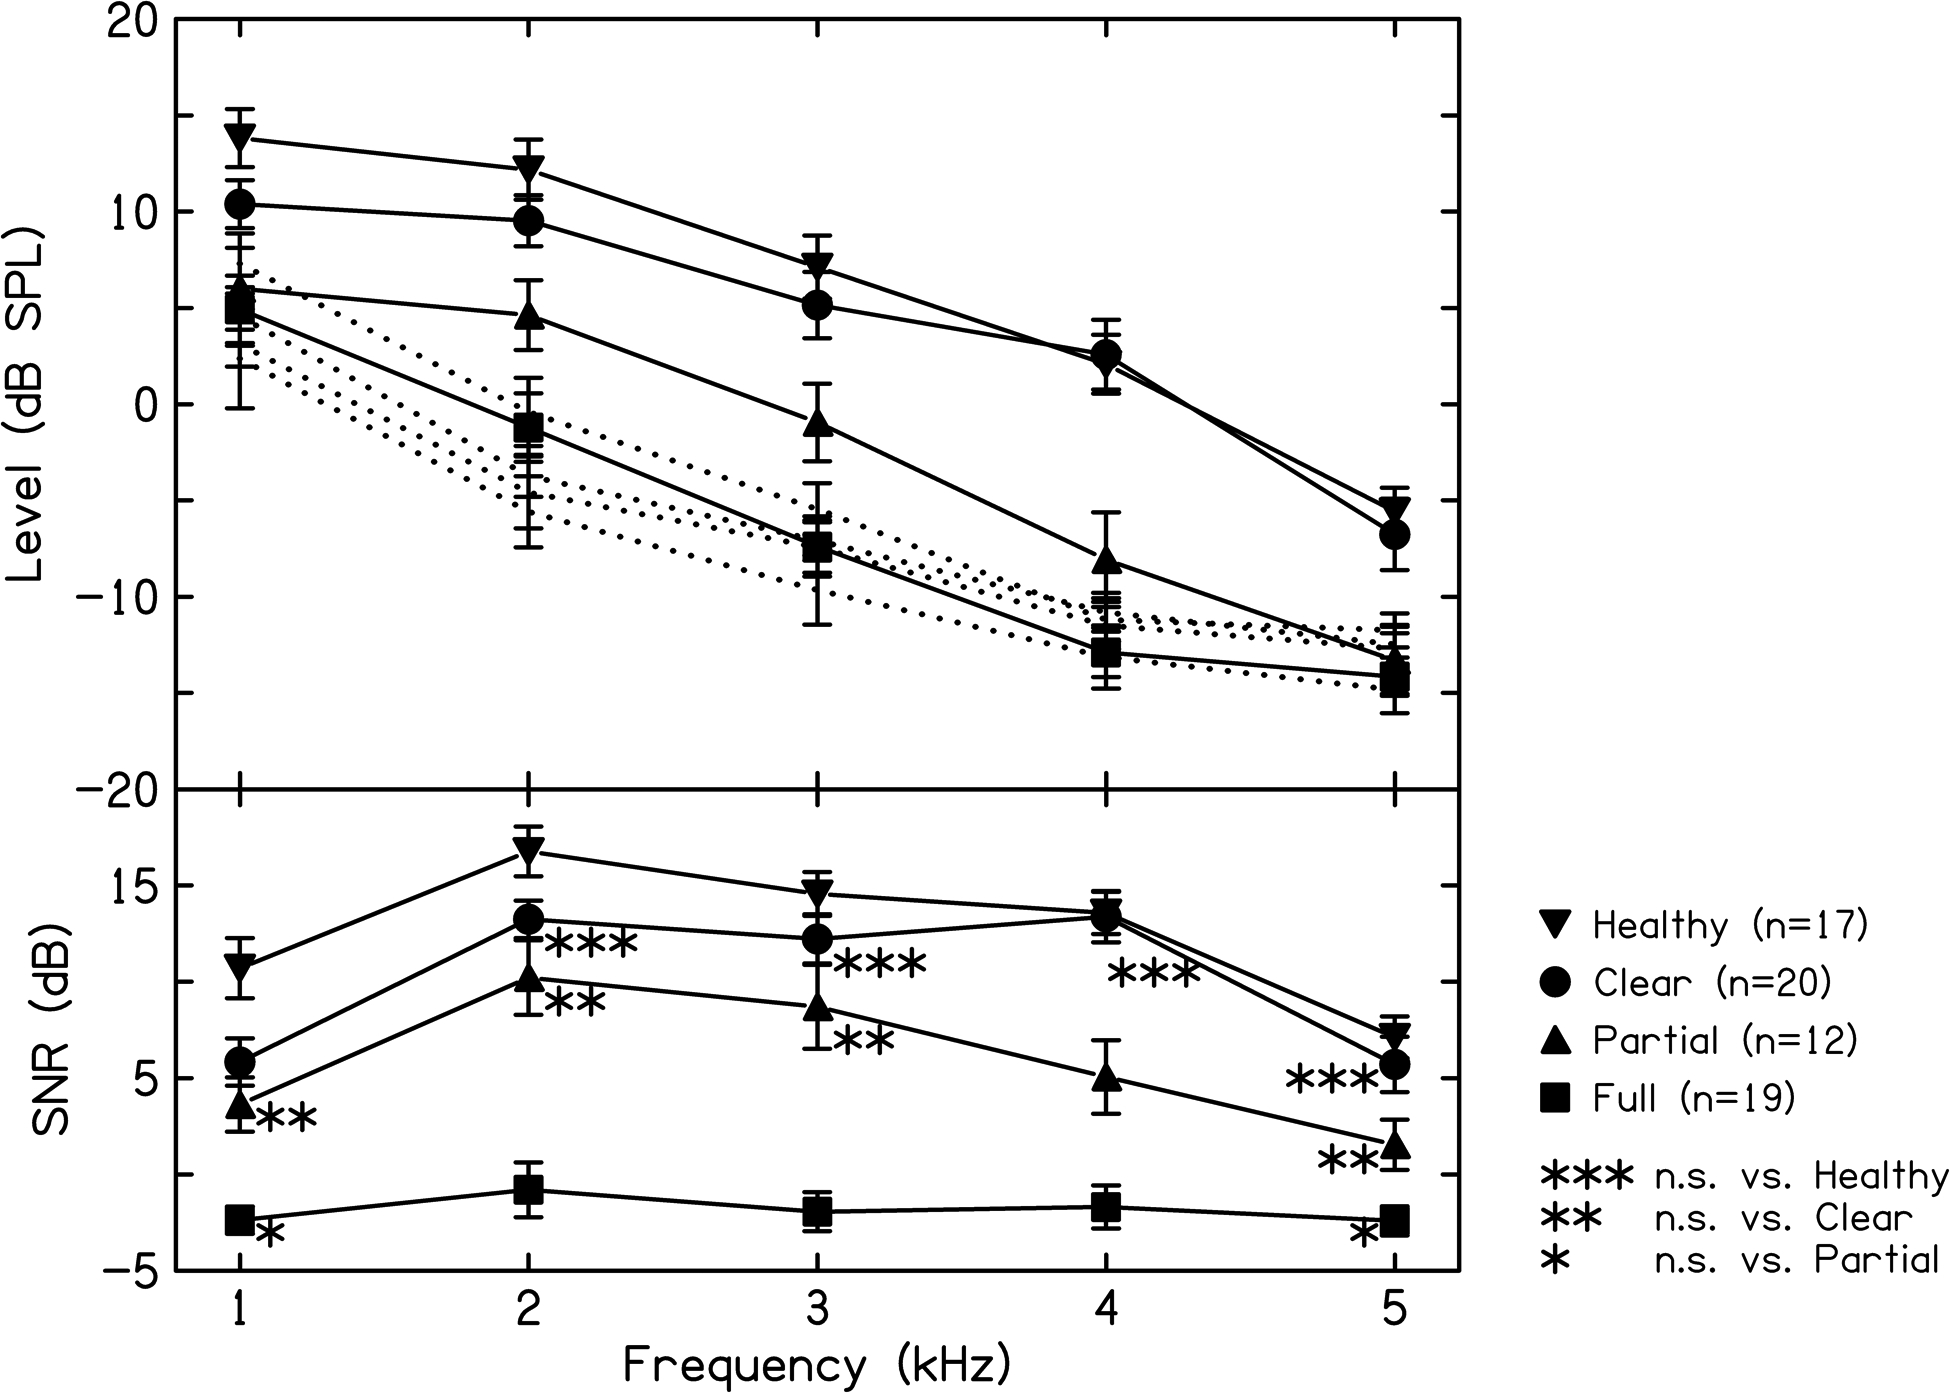
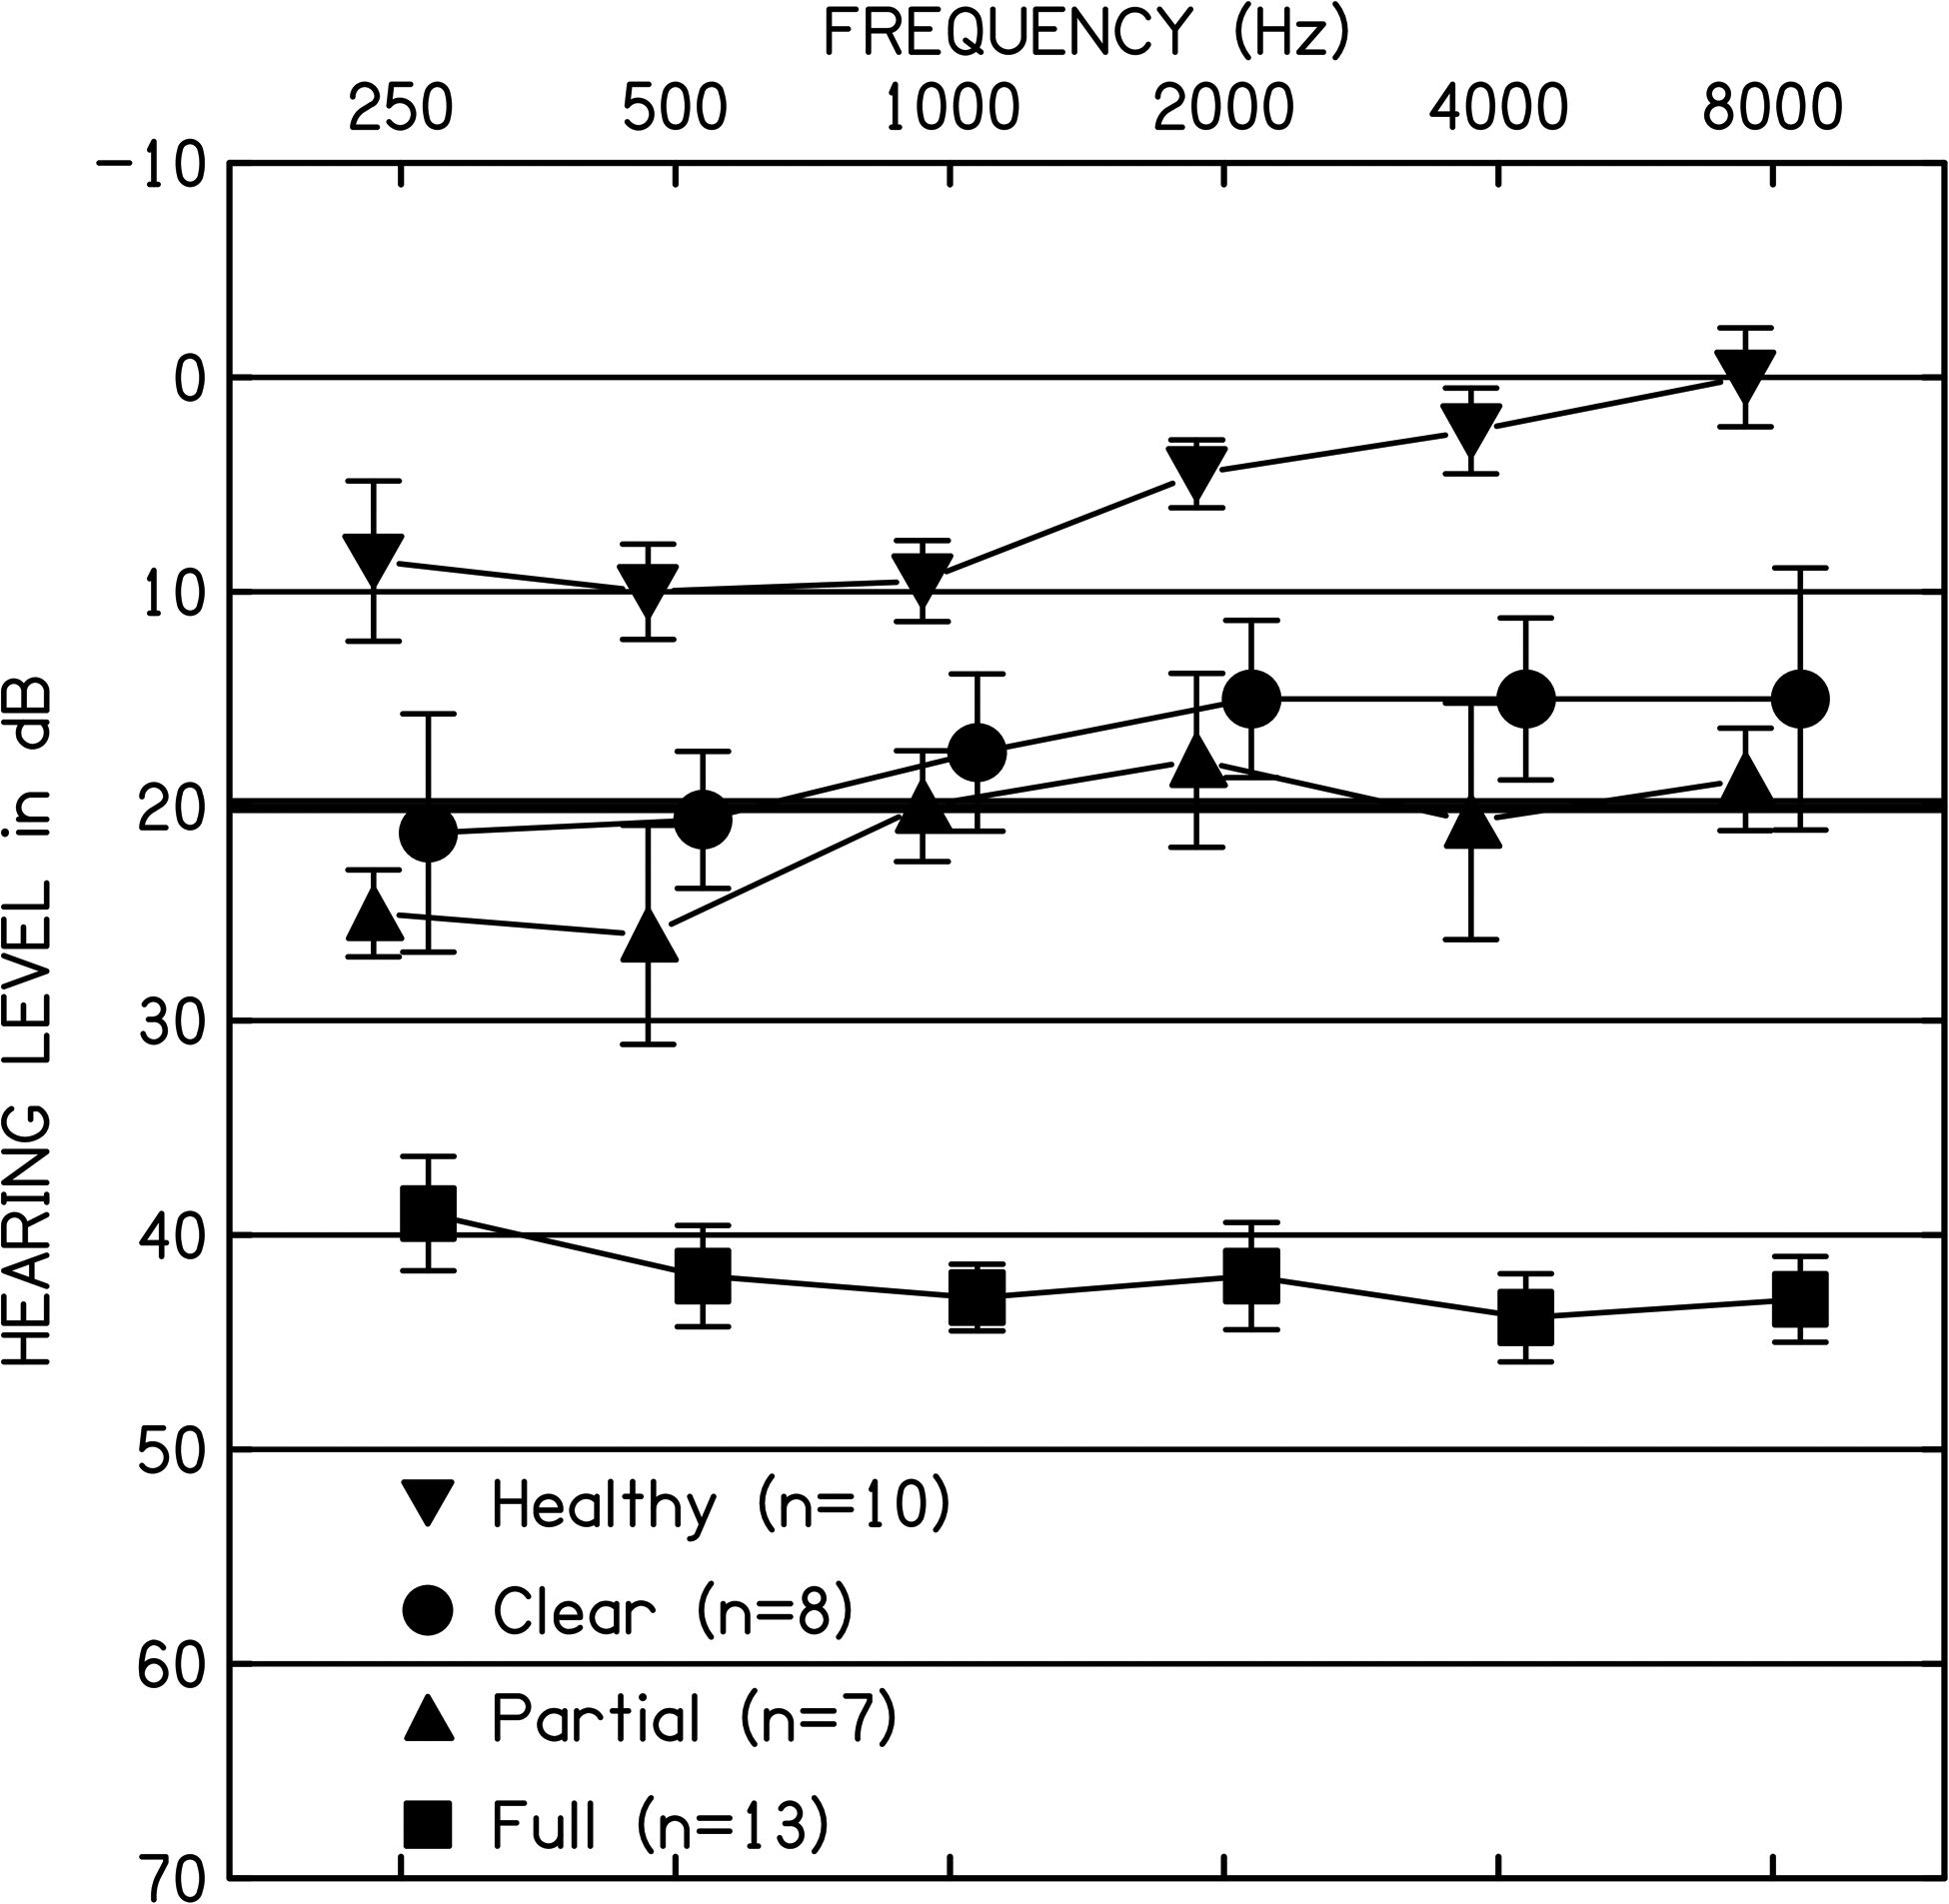
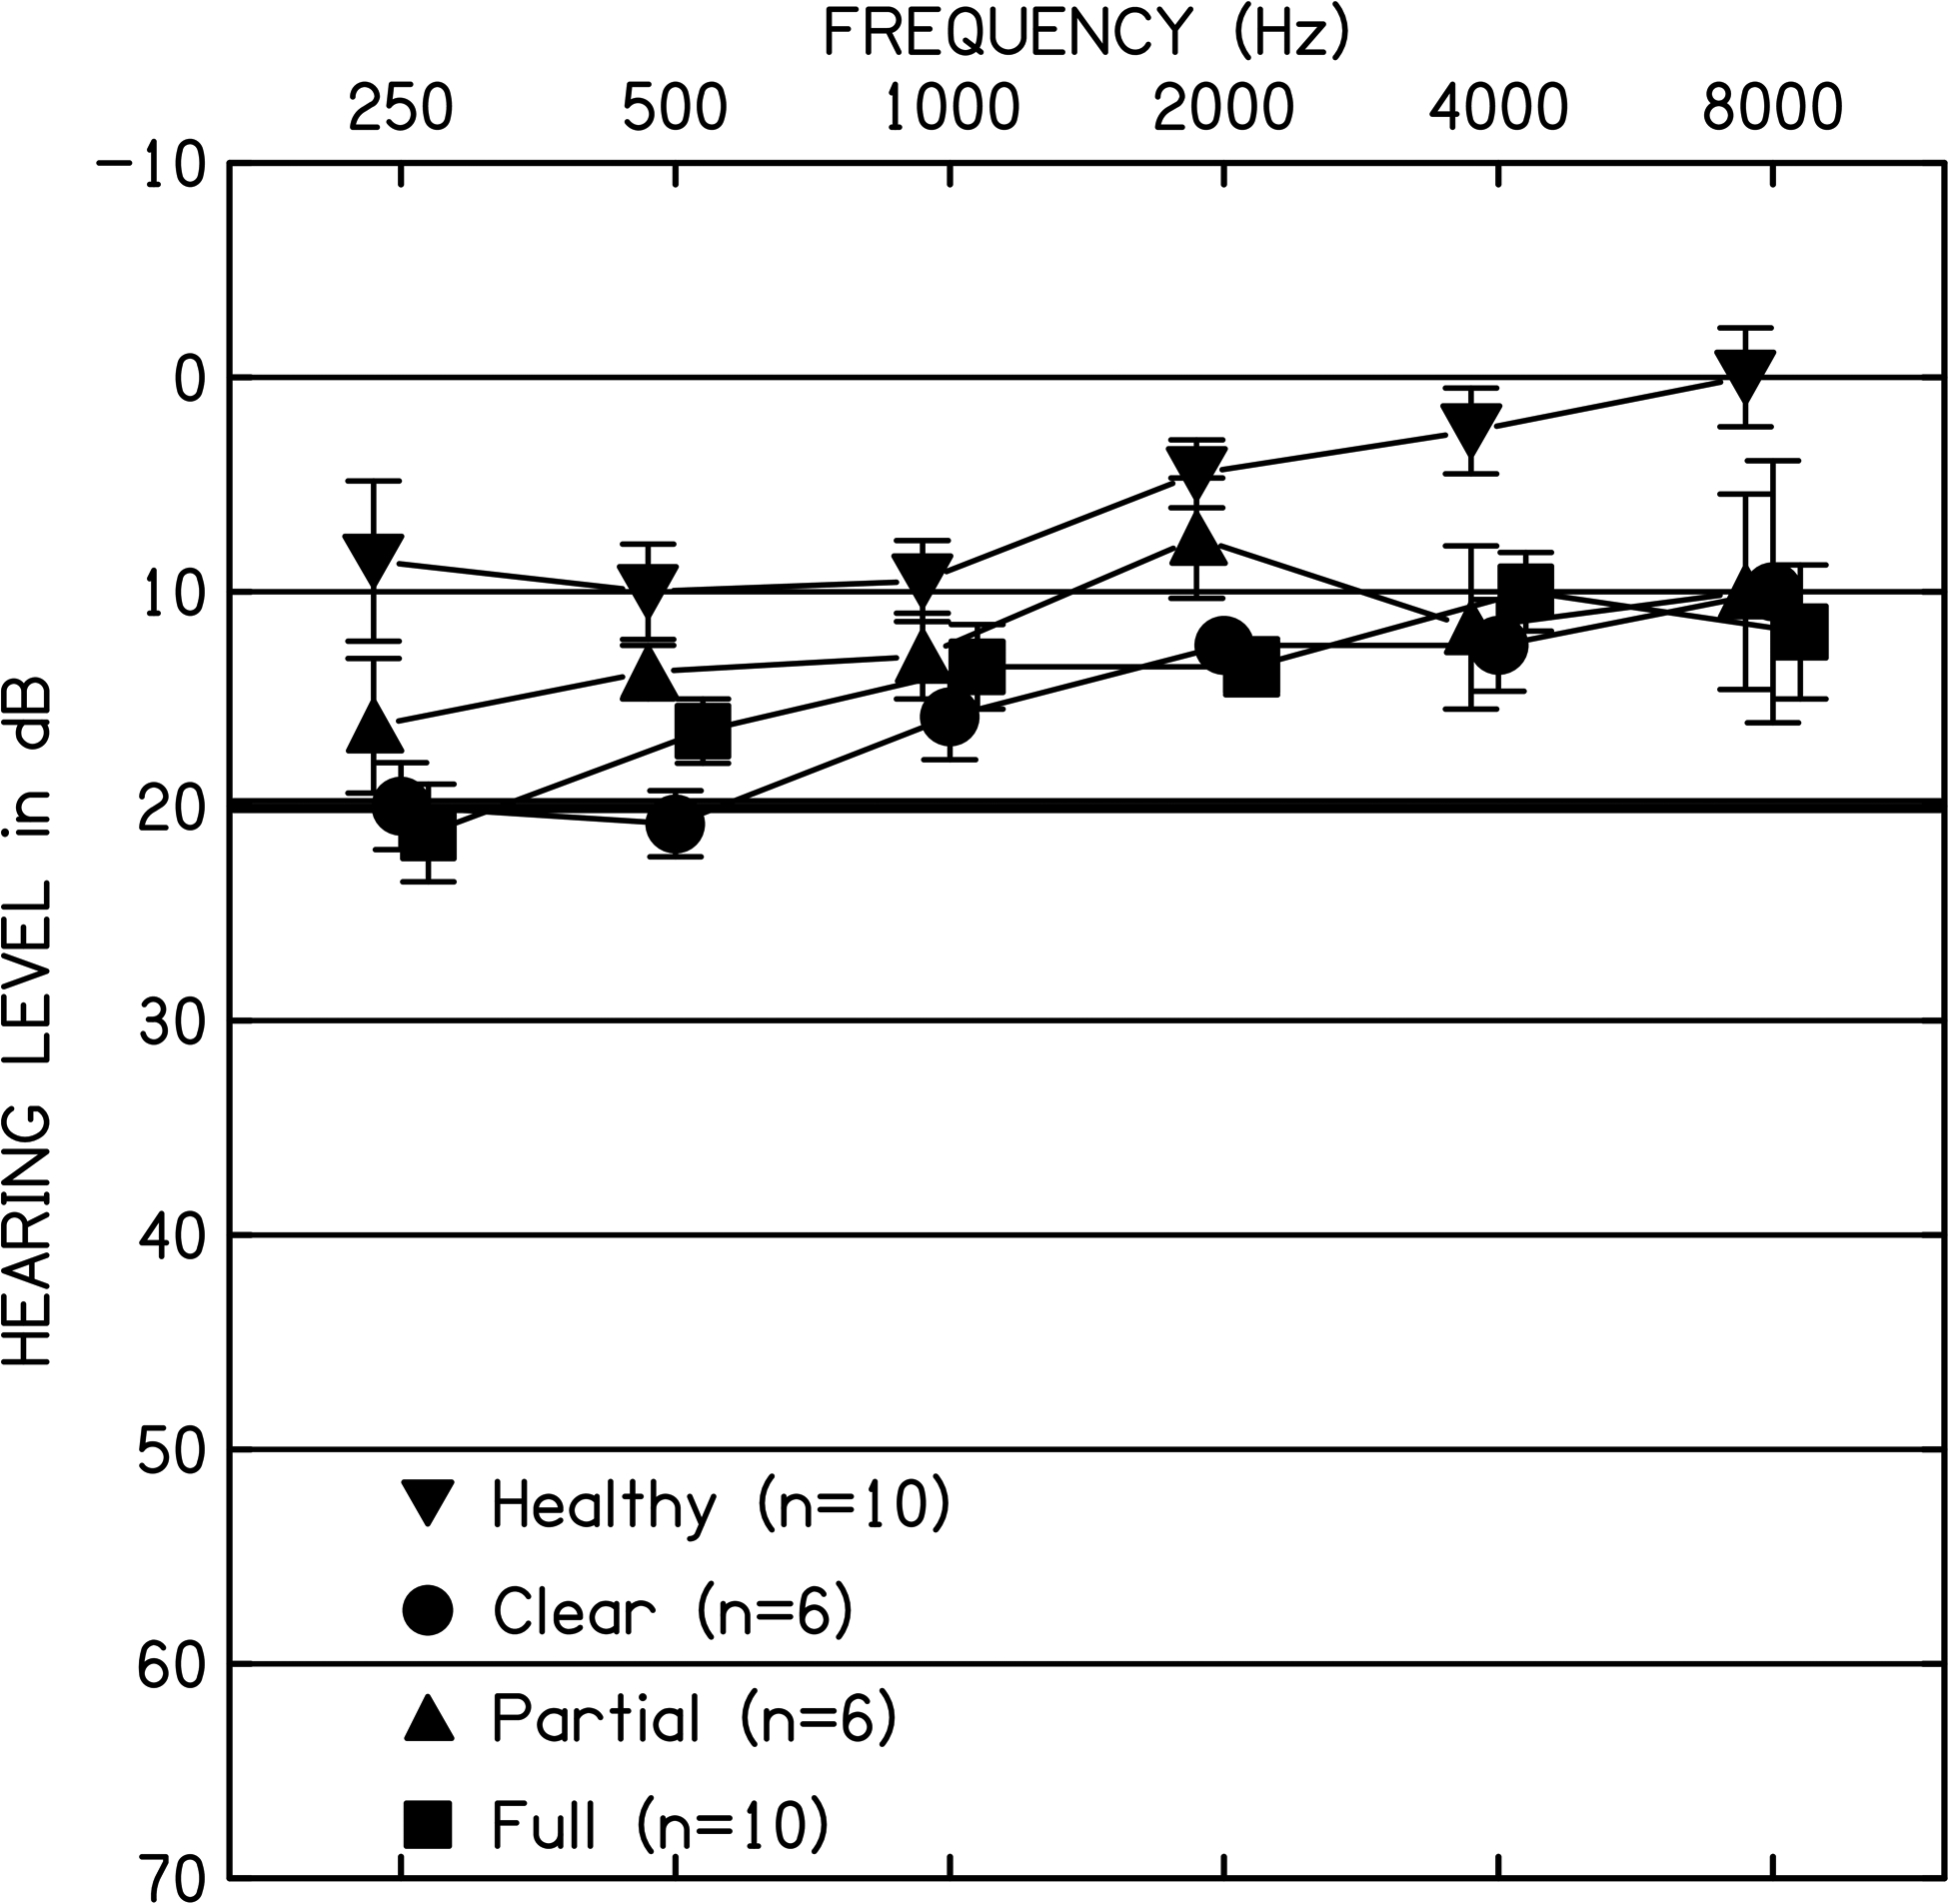
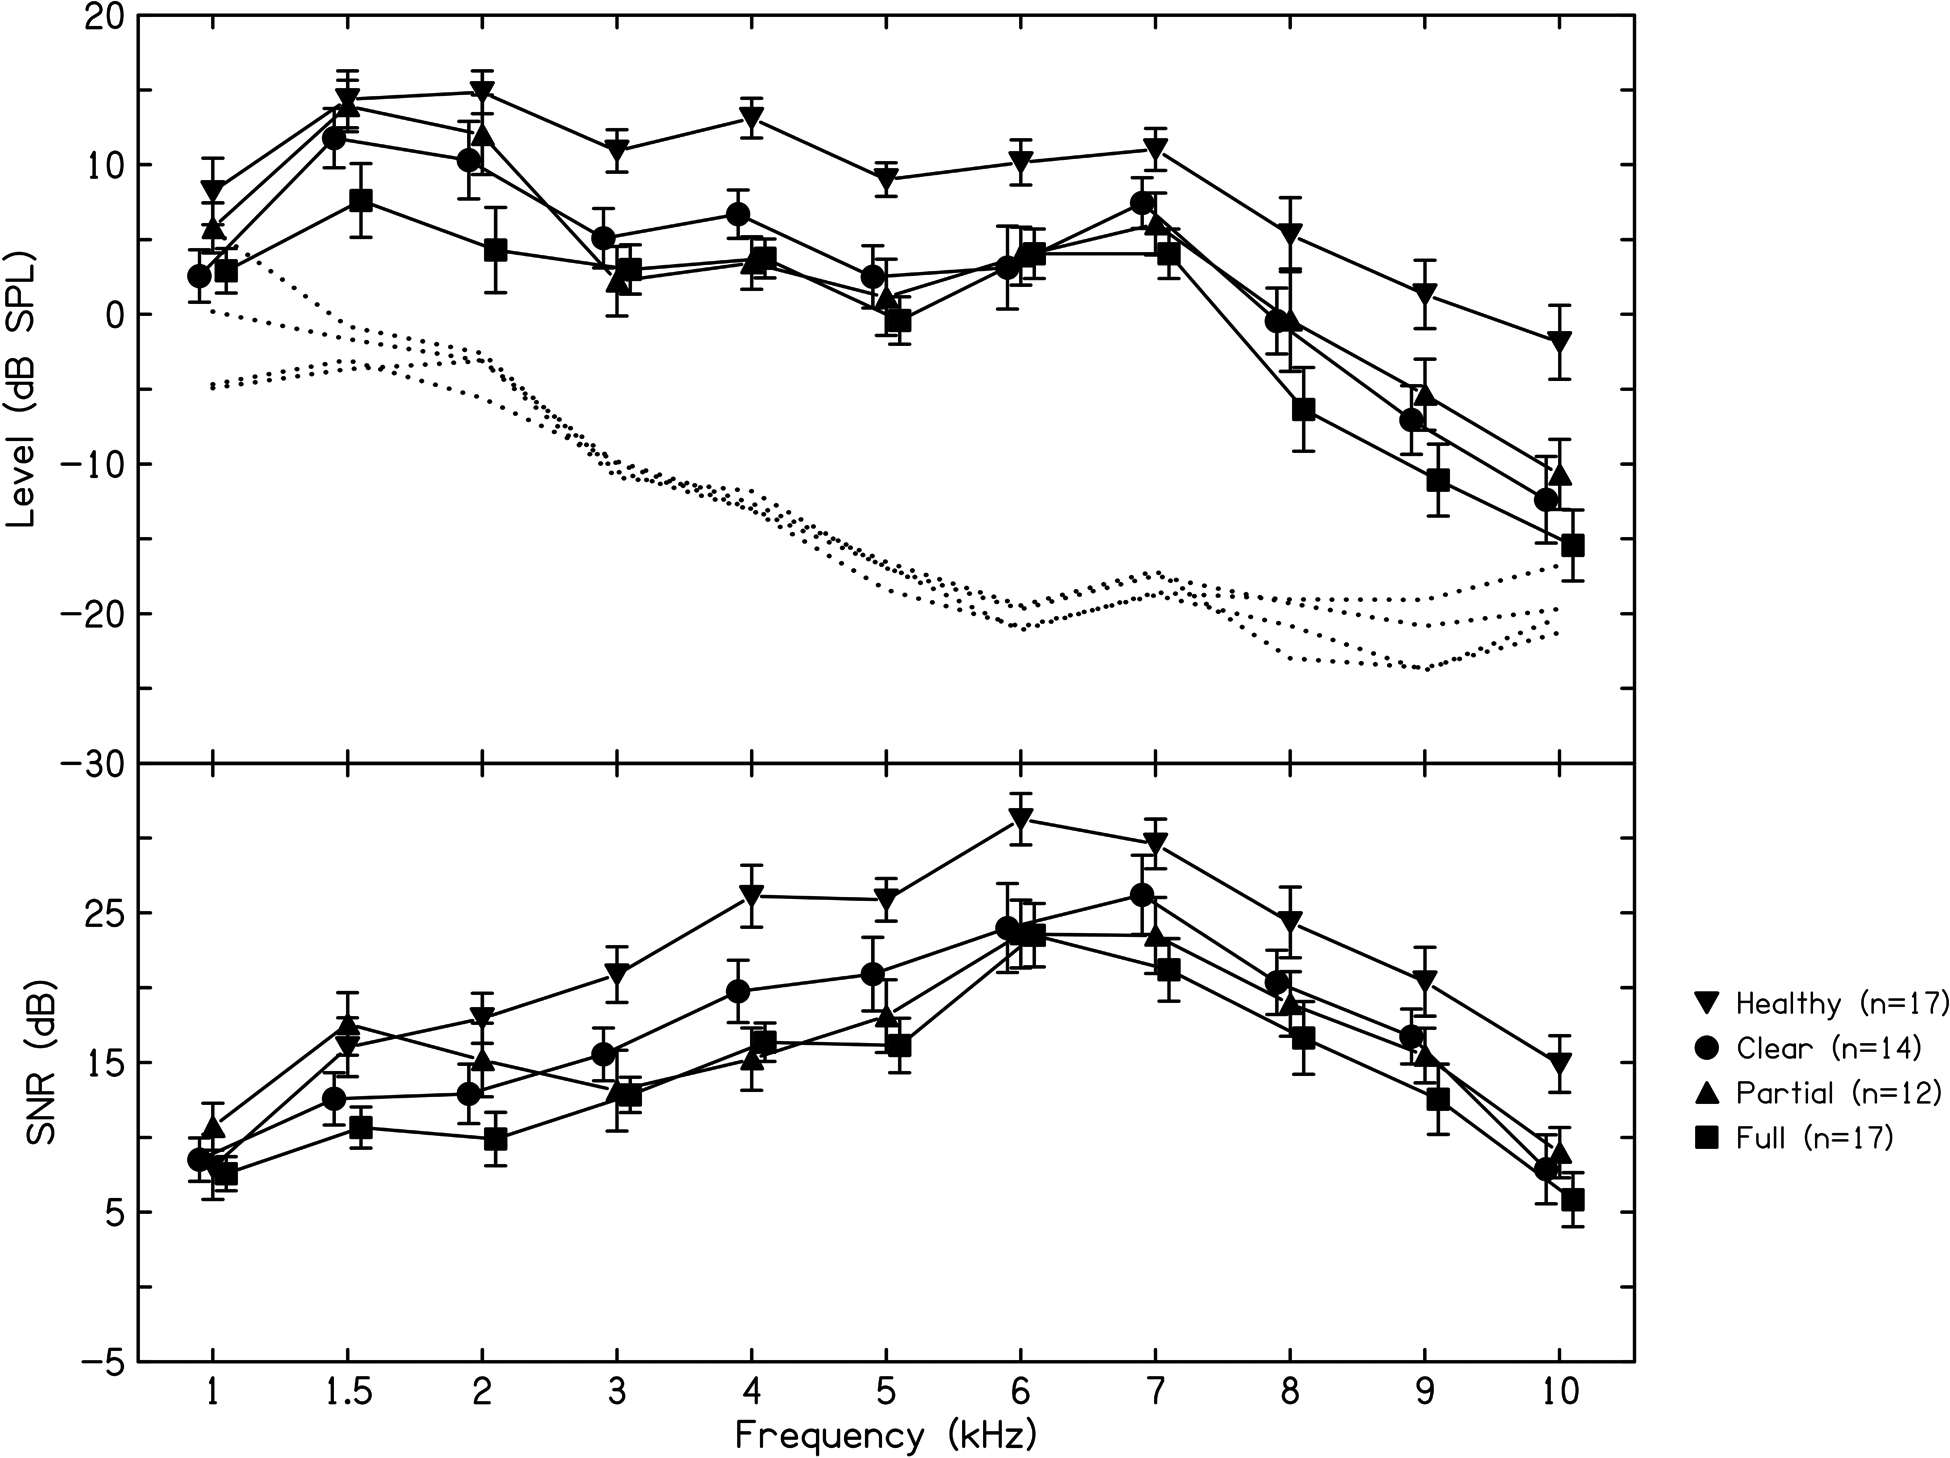
Results: Effusion volume, categorized in each ear as clear, partial, or full, effected the audiologic results. Ears with full effusions had moderate hearing losses, few to no measurable otoacoustic emissions, and delayed Wave V latencies. Ears with partial effusions and clear ears both had slight to mild hearing losses and normal Wave V latencies, though ears with partial effusions had fewer measurable otoacoustic emissions than clear ears. Normal-hearing control ears with no recent history of otitis media with effusion demonstrated normal audiometric thresholds, present otoacoustic emissions, and normal Wave V latencies. Repeat postoperative testing demonstrated improvements in audiologic testing results for all of the otitis media with effusion volume groups, with no significant differences remaining between the three otitis media with effusion groups. However, significant differences between otitis media with effusion ears and normal-hearing control ears persisted postoperatively, with otitis media with effusion ears demonstrating significantly poorer audiometric thresholds and reduced otoacoustic emissions as compared to normal control ears. The effect of effusion viscosity and purulence could not be systematically evaluated because minimal variability in effusion viscosity and purulence was observed in our sample, with nearly all effusions being mucoid and nonpurulent.
Conclusions: Effusion volume observed at the time of tympanostomy tube surgery was found to play a significant role in outcomes and responses on a range of audiologic tests that compose the standard clinical pediatric audiologic assessment battery. Full middle ear effusions were associated with a moderate hearing loss, and few to no measurable otoacoustic emissions were detected. Ears with a recent diagnosis of otitis media with effusion but clear at the time of tympanostomy tube placement had less hearing loss and a greater number of present otoacoustic emissions than ears with full or partial effusions but were still found to have poorer hearing sensitivity than the healthy control ears. Differences between ears with otitis media with effusion and healthy control ears persisted on postoperative assessments of otoacoustic emissions and audiometric thresholds, though there were no remaining effects of the presurgical effusion volume group.
Copyright © 2021 Wolters Kluwer Health, Inc. All rights reserved.
Conflict of interest statement
The authors have no conflicts of interest to disclose.
Figures
References
-
- American Academy of Audiology. (2020). Clinical Guidance Document for the Assessment of Hearing in Infants and Young Children. Retrieved from https://www.audiology.org/sites/default/files/publications/resources/Cli...
Publication types
MeSH terms
Grants and funding
LinkOut - more resources
Full Text Sources
Other Literature Sources
Medical
