

Interhemispheric Auditory Cortical Synchronization in Asymmetric Hearing Loss
- PMID: 33974786
- PMCID: PMC8378543
- DOI: 10.1097/AUD.0000000000001027
Interhemispheric Auditory Cortical Synchronization in Asymmetric Hearing Loss
Abstract
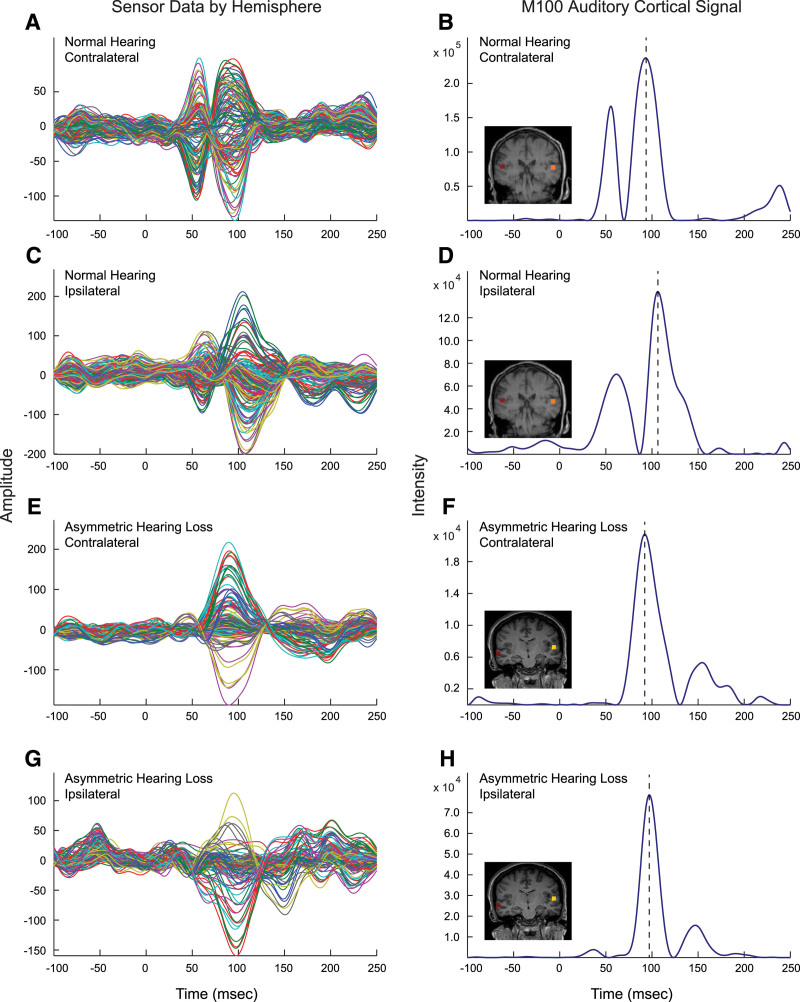
Objectives: Auditory cortical activation of the two hemispheres to monaurally presented tonal stimuli has been shown to be asynchronous in normal hearing (NH) but synchronous in the extreme case of adult-onset asymmetric hearing loss (AHL) with single-sided deafness. We addressed the wide knowledge gap between these two anchoring states of interhemispheric temporal organization. The objectives of this study were as follows: (1) to map the trajectory of interhemispheric temporal reorganization from asynchrony to synchrony using magnitude of interaural threshold difference as the independent variable in a cross-sectional study and (2) to evaluate reversibility of interhemispheric synchrony in association with hearing in noise performance by amplifying the aidable poorer ear in a repeated measures, longitudinal study.
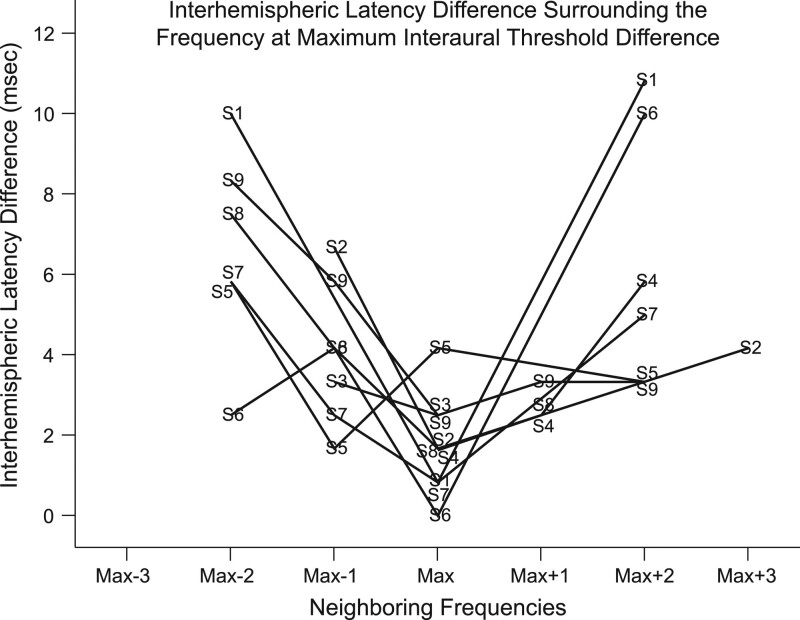
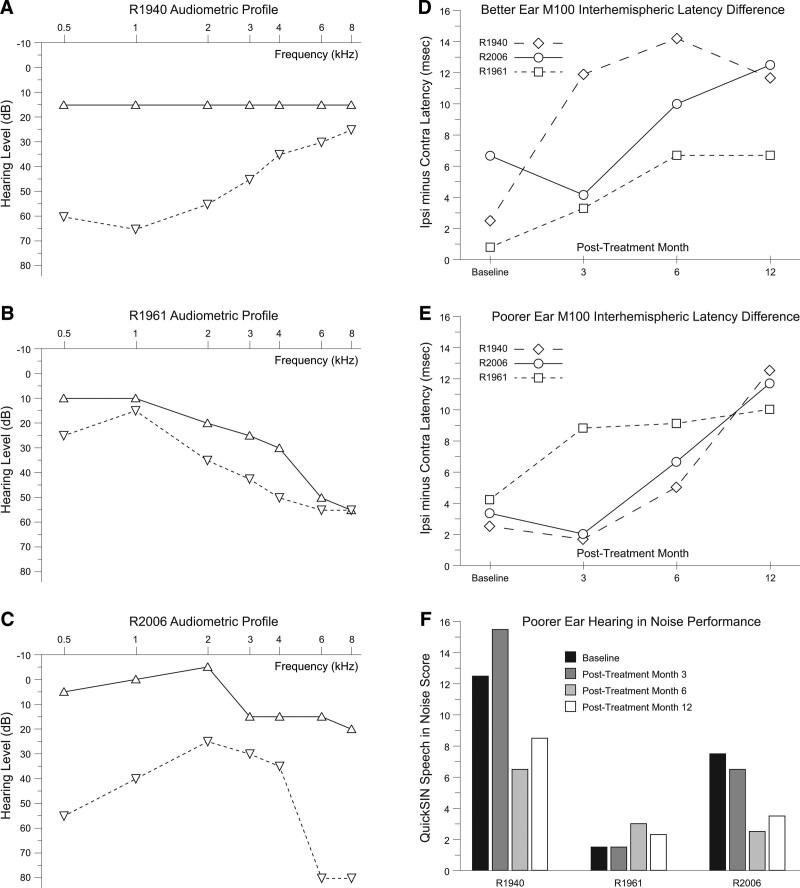
Design: The cross-sectional and longitudinal cohorts were comprised of 49 subjects (AHL; N = 21; 11 male, 10 female; mean age = 48 years) and NH (N = 28; 16 male, 12 female; mean age = 45 years). The maximum interaural threshold difference of the two cohorts spanned from 0 to 65 dB. Magnetoencephalography analyses focused on latency of the M100 peak response from auditory cortex in both hemispheres between 50 msec and 150 msec following monaural tonal stimulation at the frequency (0.5, 1, 2, 3, or 4 kHz) corresponding to the maximum and minimum interaural threshold difference for better and poorer ears separately. The longitudinal AHL cohort was drawn from three subjects in the cross-sectional AHL cohort (all male; ages 49 to 60 years; varied AHL etiologies; no amplification for at least 2 years). All longitudinal study subjects were treated by monaural amplification of the poorer ear and underwent repeated measures examination of the M100 response latency and quick speech in noise hearing in noise performance at baseline, and postamplification months 3, 6, and 12.
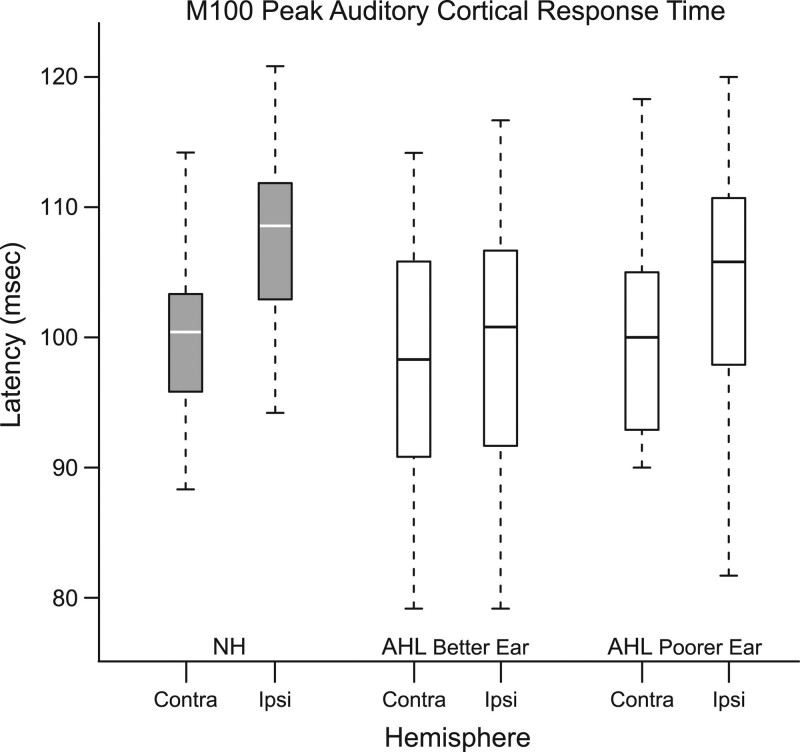
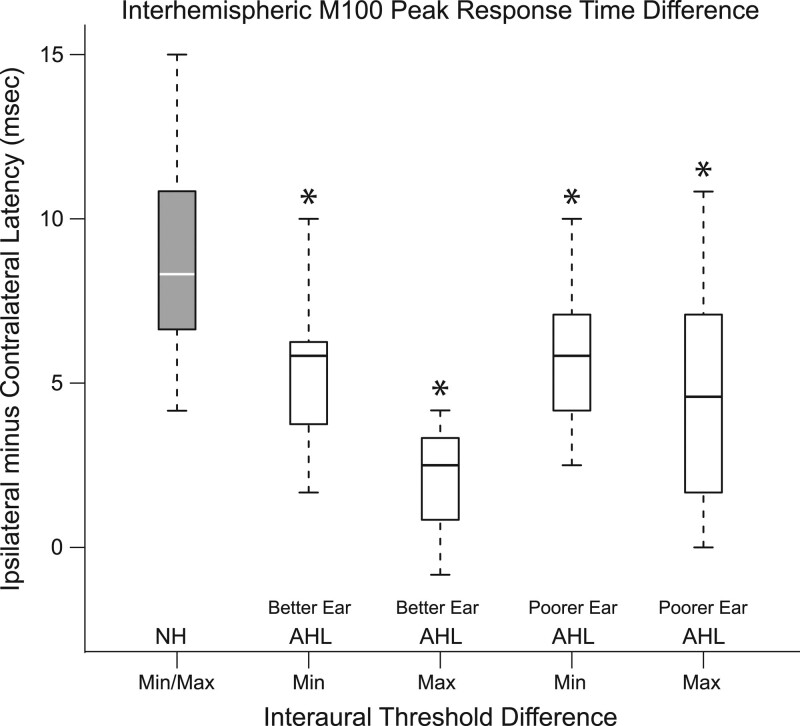
Results: The M100 response peak latency values in the ipsilateral hemisphere lagged those in the contralateral hemisphere for all stimulation conditions. The mean (SD) interhemispheric latency difference values (ipsilateral less contralateral) to better ear stimulation for three categories of maximum interaural threshold difference were as follows: NH (≤ 10 dB)-8.6 (3.0) msec; AHL (15 to 40 dB)-3.0 (1.2) msec; AHL (≥ 45 dB)-1.4 (1.3) msec. In turn, the magnitude of difference values were used to define interhemispheric temporal organization states of asynchrony, mixed asynchrony and synchrony, and synchrony, respectively. Amplification of the poorer ear in longitudinal subjects drove interhemispheric organization change from baseline synchrony to postamplification asynchrony and hearing in noise performance improvement in those with baseline impairment over a 12-month period.
Conclusions: Interhemispheric temporal organization in AHL was anchored between states of asynchrony in NH and synchrony in single-sided deafness. For asymmetry magnitudes between 15 and 40 dB, the intermediate mixed state of asynchrony and synchrony was continuous and reversible. Amplification of the poorer ear in AHL improved hearing in noise performance and restored normal temporal organization of auditory cortices in the two hemispheres. The return to normal interhemispheric asynchrony from baseline synchrony and improvement in hearing following monoaural amplification of the poorer ear evolved progressively over a 12-month period.
Copyright © 2021 The Authors. Ear & Hearing is published on behalf of the American Auditory Society, by Wolters Kluwer Health, Inc.
Conflict of interest statement
The authors have no conflicts of interest to disclose.
Figures
References
-
- Bilecen D., Seifritz E., Radü E. W., Schmid N., Wetzel S., Probst R., Scheffler K. Cortical reorganization after acute unilateral hearing loss traced by fMRI. Neurology, (2000). 54, 765–767. - PubMed
-
- Bloom J. S., Hynd G. W.The role of the corpus callosum in interhemispheric transfer of information: Excitation or inhibition? Neuropsychol Rev, (2005). 15, 59–71. - PubMed
-
- Carney E., Schlauch R. S.Critical difference table for word recognition testing derived using computer simulation. J Speech Lang Hear Res, (2007). 50, 1203–1209. - PubMed
-
- Chang J. L., Huwyler C. M., Cueva K. L., Henderson-Sabes J., Cheung S. W.Ear preference and interaural threshold asymmetry. Otol Neurotol, (2020). 41, e1178–e1184. - PubMed
Publication types
MeSH terms
Grants and funding
LinkOut - more resources
Full Text Sources
Other Literature Sources
Miscellaneous
