. 2021 May 18;35(7):109126.
doi: 10.1016/j.celrep.2021.109126. Epub 2021 Apr 27.

Systematic functional analysis of SARS-CoV-2 proteins uncovers viral innate immune antagonists and remaining vulnerabilities

Affiliations

Systematic functional analysis of SARS-CoV-2 proteins uncovers viral innate immune antagonists and remaining vulnerabilities

Manuel Hayn et al. Cell Rep. .

Abstract

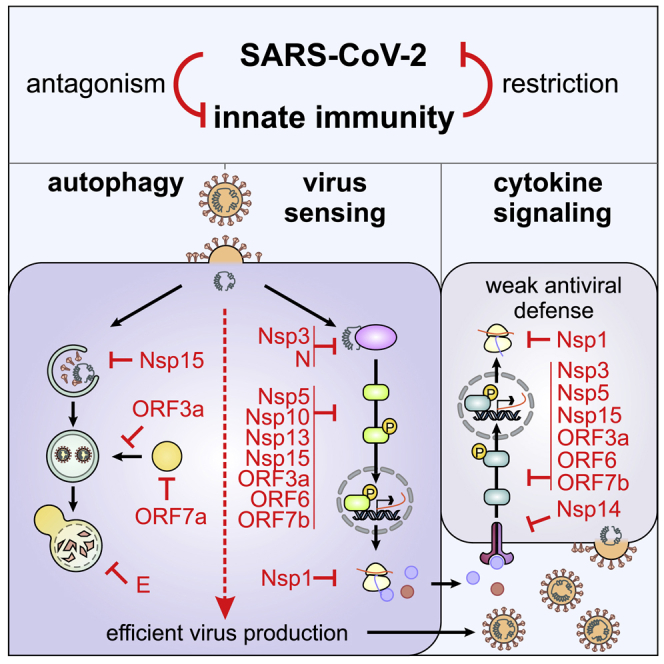
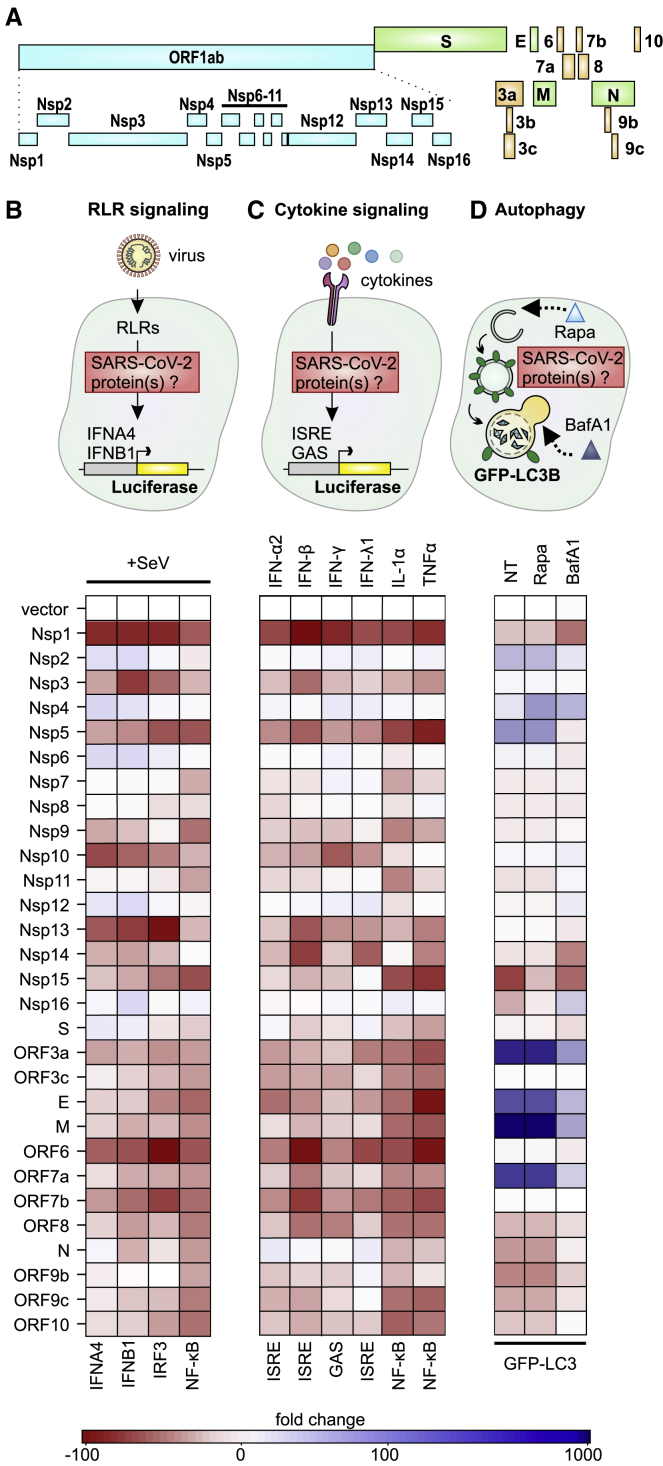
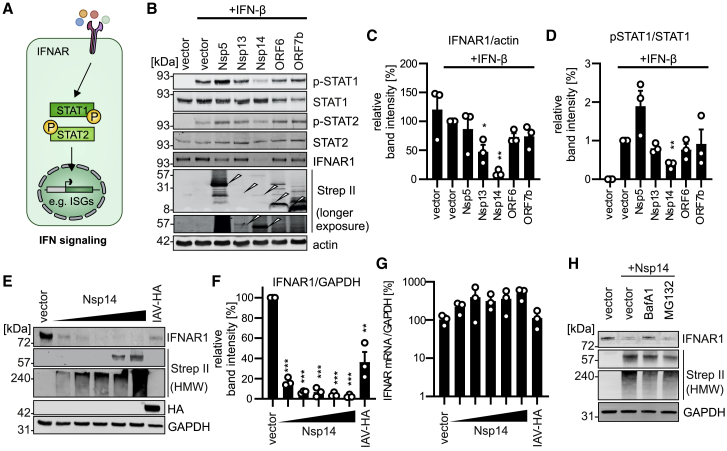
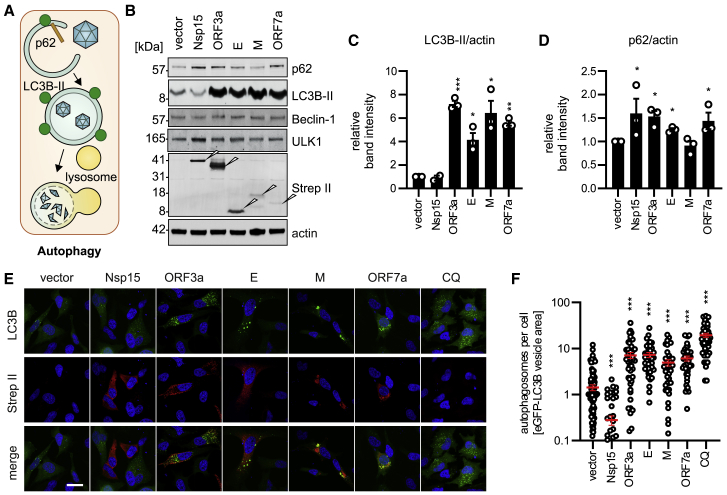
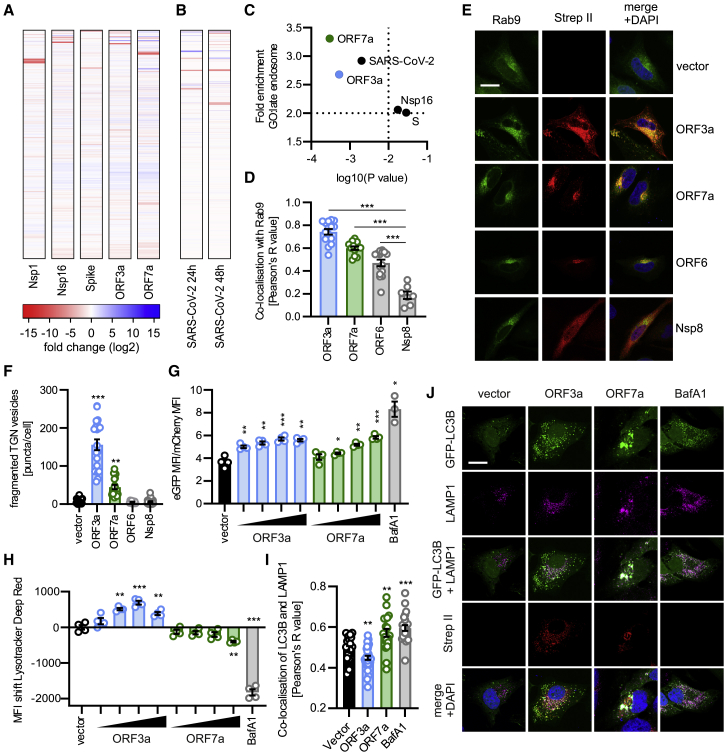
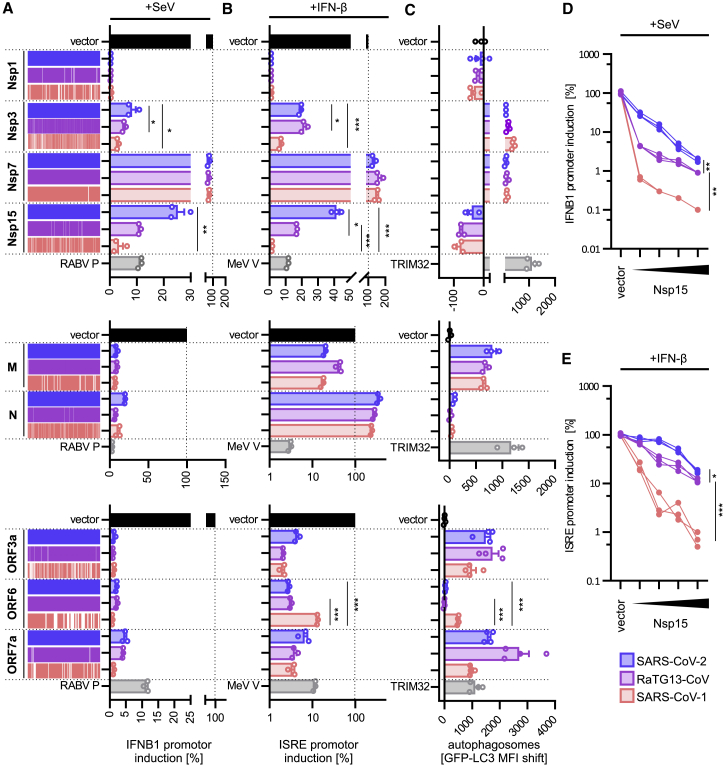
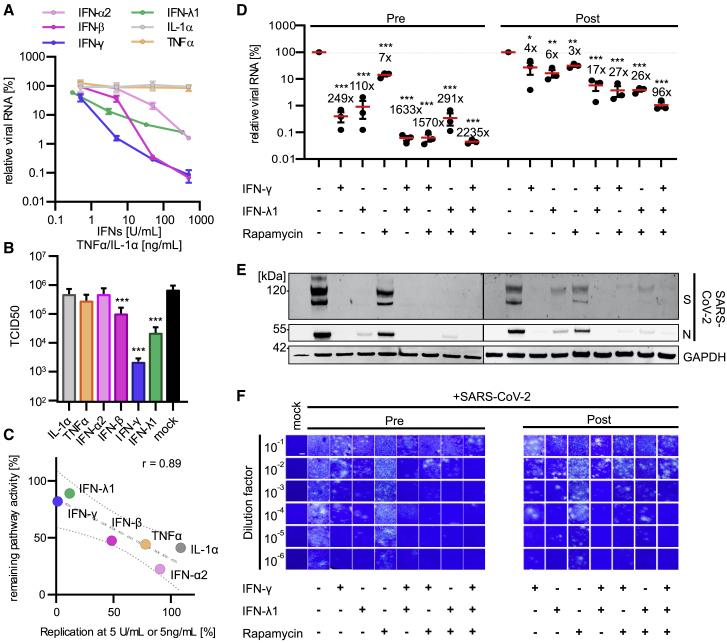
Severe acute respiratory syndrome coronavirus 2 (SARS-CoV-2) evades most innate immune responses but may still be vulnerable to some. Here, we systematically analyze the impact of SARS-CoV-2 proteins on interferon (IFN) responses and autophagy. We show that SARS-CoV-2 proteins synergize to counteract anti-viral immune responses. For example, Nsp14 targets the type I IFN receptor for lysosomal degradation, ORF3a prevents fusion of autophagosomes and lysosomes, and ORF7a interferes with autophagosome acidification. Most activities are evolutionarily conserved. However, SARS-CoV-2 Nsp15 antagonizes IFN signaling less efficiently than the orthologs of closely related RaTG13-CoV and SARS-CoV-1. Overall, SARS-CoV-2 proteins counteract autophagy and type I IFN more efficiently than type II or III IFN signaling, and infection experiments confirm potent inhibition by IFN-γ and -λ1. Our results define the repertoire and selected mechanisms of SARS-CoV-2 innate immune antagonists but also reveal vulnerability to type II and III IFN that may help to develop safe and effective anti-viral approaches.

Keywords: COVID-19; SARS-CoV; SARS-CoV-2; autophagy; cytokine; immune evasion; innate immunity; interferon.


Conflict of interest statement

Declaration of interests F.I.S. is a co-founder of DiosCURE Therapeutics SE and a consultant to IFM Therapeutics.

Figures

None
Graphical abstract
Figure 1
Figure 1
Systematic analysis of innate immune antagonism by SARS-CoV-2 proteins (A) Schematic depiction of 30 SARS-CoV-2-encoded proteins in the order they appear in the genome. The polyprotein ORF1a(b) is (auto)proteolytically cleaved into 16 non-structural proteins (Nsps; turquoise). The structural proteins (green) are Spike (S), Membrane (M), envelope (E), and nucleoprotein (N). The set is complemented by the accessory proteins (orange) ORF3a, ORF3b, ORF3c, ORF6, ORF7a, ORF7b, ORF8, ORF9b, ORF9c, and ORF10. (B–D) Schematic depiction of the assay setup (top panel) and heatmap (lower panel; red = inhibition, blue = induction) showing modulation of innate immune pathways by overexpression of indicated SARS-CoV-2 proteins. Stimuli of the respective pathways are indicated. (B and C) Readout by Luciferase reporter gene assay (color represents the mean of n = 3, biological replicates) using indicated promotor constructs in HEK293T cells, and (D) autophagosome measurement by quantification of membrane-associated GFP-LC3B in HEK293T-GFP-LC3B cells (color represents the mean of n = 4, biological replicates). The vector/control is set to 1 (white). SeV, Sendai virus; Rapa, rapamycin; BafA1, Bafilomycin A1. Heatmaps represent one example of at least two independent repeats, each consisting of three biological replicates. See also Figure S1.
Figure 2
Figure 2
SARS-CoV-2 interferes with type I IFN signaling (A) Schematic depiction of the type I IFN signaling pathway. (B) Exemplary immunoblot analysis showing activation of type I IFN signaling markers by using whole-cell lysates (WCLs) of HEK293T cells expressing indicated proteins and stimulated with IFN-β (1000 U/mL, 45 min). Blots were stained with anti-pSTAT1, anti-STAT1, anti-pSTAT2, anti-STAT2, anti-IFNAR1, anti-Strep II, and anti-actin. (C) Quantification of the band intensities in (B) for IFNAR1 normalized to the band intensities of actin. Bars represent mean of n = 3 ± SEM (biological replicates). (D) Quantification of the band intensities in (B) for phospho-STAT1 (pSTAT1) normalized to the band intensities of STAT1. Bars represent the mean of n = 3 ± SEM (biological replicates). (E) Exemplary immunoblot analysis showing endogenous levels of IFNAR1 in WCLs of HEK293T cells expressing indicated proteins. Blots were stained with anti-IFNAR1, anti-Strep II, anti-HA, and anti-GAPDH. IAV-HA, HA-tagged influenza virus HA protein. (F) Quantification of the band intensities in (E) for IFNAR1 normalized to the band intensities of GAPDH. Bars represent the mean of n = 3 ± SEM (biological replicates). (G) Quantitative real-time PCR analysis of IFNAR1 mRNA levels in HEK293T cells expressing indicated proteins, normalized to GAPDH mRNA. Vector transfected samples were set to 100%. Bars represent the mean of n = 3 ± SEM (biological replicates). (H) Exemplary immunoblot analysis showing endogenous levels of IFNAR1 in WCLs of HEK293T cells expressing Nsp14. Cells were treated with BafA1 (2 μM) or MG132 (50 μM) for 6 h before harvesting. Blots were stained with anti-IFNAR1, anti-Strep II, and anti-GAPDH. ∗, p < 0.05; ∗∗, p < 0.01; ∗∗∗, p < 0.001. See also Figure S2.
Figure 3
Figure 3
SARS-CoV-2 interferes with autophagy (A) Schematic depiction of autophagy. (B) Exemplary immunoblot analysis showing autophagy activity markers using WCLs of HEK293T cells expressing indicated proteins. Blots were stained with anti-SQSTM1/p62, anti-LC3B-II, anti-Beclin-1, anti-ULK1, anti-Strep II, and anti-actin. (C) Quantification of the band intensities in (B) for LC3B-II normalized to the band intensities of actin. Bars represent mean of n = 2-3 ± SEM (biological replicates). (D) Quantification of the band intensities in (B) for p62 normalized to the band intensities of actin. Bars represent mean of n = 3 ± SEM (biological replicates). (E) Exemplary confocal laser scanning microscopy images of autophagy activation by GFP-LC3B (green) puncta formation. Indicated Strep II-tagged SARS-CoV-2 proteins (red) were overexpressed in HeLa GFP-LC3B cells (green). CQ (chloroquine; 4 h, 10 μM) was used as a positive control. Nuclei, 4′,6-diamidino-2-phenylindole (DAPI;blue). Scale bar, 25 μm. (F) Quantification by area of GFP-LC3B puncta divided by cell number from the images in (E). Bars represent the mean of n = 38-100 ± SEM (individual cells). ∗, p < 0.05; ∗∗, p < 0.01; ∗∗∗, p < 0.001. See also Figure S2.
Figure 4
Figure 4
ORF3a and ORF7a disturb autophagy by distinct mechanisms (A and B) Heatmap (red = downregulation, blue = upregulation) depicting the fold changes of cellular and viral proteins during overexpression of indicated single SARS-CoV-2 proteins in HEK293T cells (A) or SARS-CoV-2 infection (MOI, 1) of Caco-2 cells 24 or 48 h post-infection as assessed by mass spectrometry (B). (C) Scatterplots of log2 fold enrichment and p value of the GO term “late endosome” in protein sets regulated more than 4-fold upon (A) expression of indicated viral protein or (B) SARS-CoV-2 infection. (D) Quantification of co-localization by Pearson correlation of Rab9 and indicated viral proteins in HeLa cells transiently transfected with the indicated viral protein and GFP-Rab9. Bars represent the mean of n = 7–15 ± SEM (individual cells). (E) Exemplary confocal microscopy images of HeLa cells transiently expressing indicated viral proteins (red) and a marker of late endosomes GFP-Rab9 (green). Cells were stained with anti-Strep II (red). Nuclei, DAPI (blue). Scale bar, 10 μm. (F) Quantification of non-Golgi-associated vesicles per cell as puncta/cell in HeLa cells overexpressing indicated proteins. Images in Figure S4A. Bars represent the mean of n = 15–25 ± SEM (individual cells). (G) Ratio between eGFP and mCherry mean fluorescence intensities in HEK293T stably expressing GFP-mCherry-LC3B and transfected with indicated constructs. BafA1 at 100 nM, 8 h. Bars represent the mean of n = 4 ± SEM (biological replicates). (H) Mean fluorescence intensity of Lysotracker-deep-red-stained HEK293T cells expressing indicated proteins, as assessed by flow cytometry. Bars represent the mean of n = 4 ± SEM (biological replicates). (I) Quantification of the co-localization of LAMP1 and LC3B in HeLa-GFP-LC3B cells expressing indicated proteins. Bars represent the mean of n = 19–32 ± SEM (individual cells). (J) Exemplary confocal microscopy images for (I). Cells were stained with anti-Strep II (red) and anti-LAMP1 (magenta). GFP-LC3B, green. Nuclei, DAPI (blue). Scale bar, 10 μm. BafA1 (100 nM, 4 h) was used as a positive control. ∗, p < 0.05; ∗∗, p < 0.01; ∗∗∗, p < 0.001. See also Figure S3 and S4.
Figure 5
Figure 5
Functional conservation of innate immune antagonism between SARS-CoV-2, RaTG13-CoV, and SARS-CoV-1 (A–C) Immune activation of type I IFN induction (A), type I IFN signaling (B), or autophagy (C) in the presence of indicated proteins (Nsp1, Nsp3, Nsp7, Nsp15, M, N, ORF3a, ORF6, and ORF7a) of SARS-CoV-2 (blue), RaTG13-CoV (purple), or SARS-CoV-1 (red) assessed by IFN-β-promotor luciferase reporter gene assays stimulated with Sendai virus (SeV; A). ISRE-promotor luciferase reporter gene assays stimulated with IFN-β (1,000 U/mL; B) or membrane-associated GFP-LC3B (C). Vector induction set to 100% (black). Controls are Rabies virus P, Measles virus V, or TRIM32 (gray). Bars represent the mean of n = 3 ± SEM (biological replicates) (A and B) or n = 4 ± SEM (biological replicates) (C). (D) Dose dependent effect of SARS-CoV-2, RaTG13-CoV or SARS-CoV-1 Nsp15 expression in HEK293T cells on IFN-β induction stimulated with SeV (24 h). Quantification by IFN-β promotor dependent luciferase reporter activity. Lines represent one individual replicate. (E) Dose-dependent effect of Nsp15 expression on IFN-β signaling in HEK293T cells, stimulated with IFN-β (1,000 U/mL, 8 h). Quantification by ISRE-promotor-dependent luciferase reporter activity. Lines represent one individual replicate. ∗, p < 0.05; ∗∗, p < 0.01; ∗∗∗, p < 0.001. See also Figure S5.
Figure 6
Figure 6
Concerted innate immune activation as an anti-viral approach (A) Quantification of SARS-CoV-2 N RNA in the supernatant of SARS-CoV-2-infected (MOI, 0.05; 48 h post infection [p.i.]) Calu-3 cells that were left untreated and/or were treated with indicated IFNs or pro-inflammatory cytokines as assessed by qPCR. Lines represent the mean of n = 2 ± SD (technical replicates). (B) TCID50 measurements of the assay in (A), at 5 IU/mL or 5 ng/mL of indicated compounds. Bars represent the mean of n = 3 ± SEM (biological replicates). (C) Correlation between average inhibition of the indicated innate immune signaling pathway and impact on replication of SARS-CoV-2 after treatment with the respective cytokine. r, Pearson’s correlation. (D) Quantification of SARS-CoV-2 N RNA in the supernatant of SARS-CoV-2-infected (MOI, 0.05; 48 h p.i.) Calu-3 cells that were left untreated and/or were treated with the indicated combinations of IFN-γ or IFN-λ1 (5 U/mL) or rapamycin (125 nM) either 24 h before the infection (pre) or 6 h post-infection (post). Dots represent individual experiments, and the lines represent the mean of n = 3 ± SEM (biological replicates). Fold reduction compared to control is indicated. (E) Exemplary immunoblot analysis of the SARS-CoV-2 infection by using WCLs of Calu-3 cells in (D). Blots were stained with anti-SARS-CoV-2 S, anti-SARS-CoV-2 N, and anti-GAPDH. (F) Exemplary images of cytopathic effect on Vero cells induced by infectious SARS-CoV-2 containing supernatant (SN) from (D), 48 h post-infection with indicated serial dilutions. Living cells were stained with crystal violet. Scale bar, 5 mm. ∗, p < 0.05; ∗∗, p < 0.01; ∗∗∗, p < 0.001. See also Figure S6.

Comment in

  • Manipulation of autophagy by SARS-CoV-2 proteins.
    Koepke L, Hirschenberger M, Hayn M, Kirchhoff F, Sparrer KM. Koepke L, et al. Autophagy. 2021 Sep;17(9):2659-2661. doi: 10.1080/15548627.2021.1953847. Epub 2021 Jul 19. Autophagy. 2021. PMID: 34281462 Free PMC article.

Similar articles

Cited by

References

    1. Andersen K.G., Rambaut A., Lipkin W.I., Holmes E.C., Garry R.F. The proximal origin of SARS-CoV-2. Nat. Med. 2020;26:450–452. - PMC - PubMed
    1. Báez-Santos Y.M., Mielech A.M., Deng X., Baker S., Mesecar A.D. Catalytic function and substrate specificity of the papain-like protease domain of nsp3 from the Middle East respiratory syndrome coronavirus. J. Virol. 2014;88:12511–12527. - PMC - PubMed
    1. Bastard P., Rosen L.B., Zhang Q., Michailidis E., Hoffmann H.-H., Zhang Y., Dorgham K., Philippot Q., Rosain J., Béziat V., HGID Lab. NIAID-USUHS Immune Response to COVID Group. COVID Clinicians. COVID-STORM Clinicians. Imagine COVID Group. French COVID Cohort Study Group. Milieu Intérieur Consortium. CoV-Contact Cohort. Amsterdam UMC Covid-19 Biobank. COVID Human Genetic Effort Autoantibodies against type I IFNs in patients with life-threatening COVID-19. Science. 2020;370:80. - PMC - PubMed
    1. Blanco-Melo D., Nilsson-Payant B.E., Liu W.C., Uhl S., Hoagland D., Møller R., Jordan T.X., Oishi K., Panis M., Sachs D. Imbalanced Host Response to SARS-CoV-2 Drives Development of COVID-19. Cell. 2020;181:1036–1045.e9. - PMC - PubMed
    1. Bozzo C.P., Nchioua R., Volcic M., Wettstein L., Weil T., Krüger J., Heller S., Conzelmann C., Müller J., Gross R. IFITM proteins promote SARS-CoV-2 infection of human lung cells. bioRxiv. 2020 doi: 10.1101/2020.08.18.255935. - DOI

Publication types

MeSH terms