. 2021 Jun 10;184(12):3192-3204.e16.
doi: 10.1016/j.cell.2021.04.033. Epub 2021 Apr 24.

Structural insight into SARS-CoV-2 neutralizing antibodies and modulation of syncytia

Affiliations

Structural insight into SARS-CoV-2 neutralizing antibodies and modulation of syncytia

Daniel Asarnow et al. Cell. .

Abstract

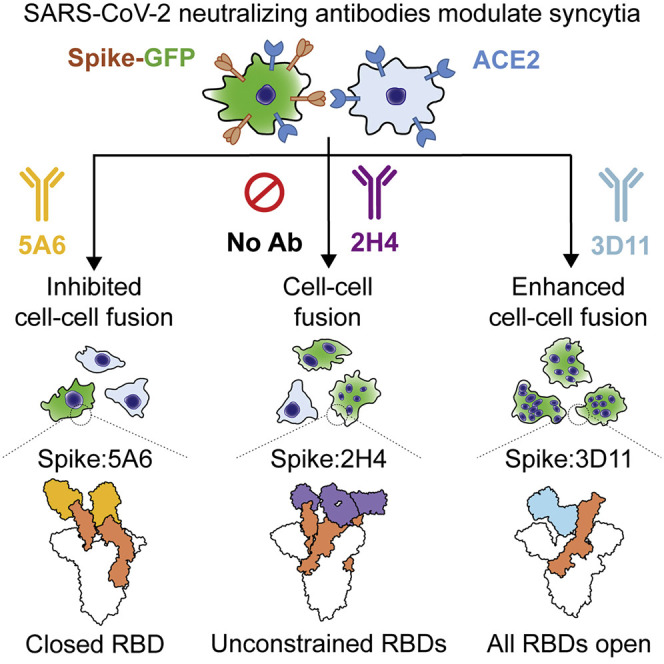
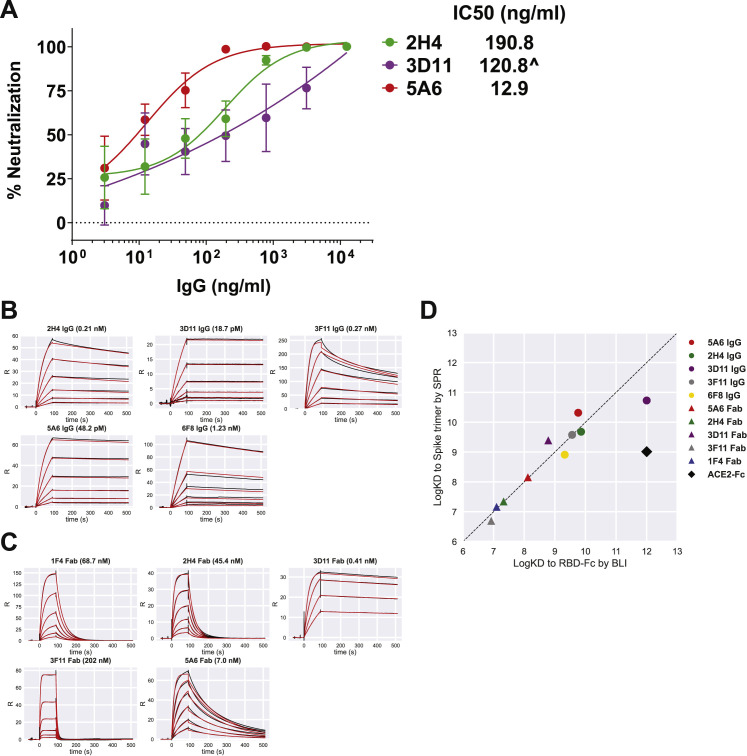
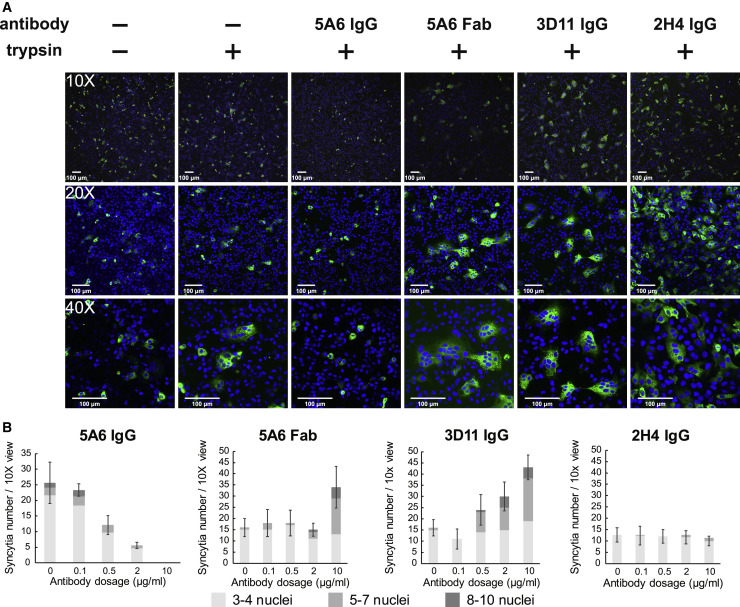
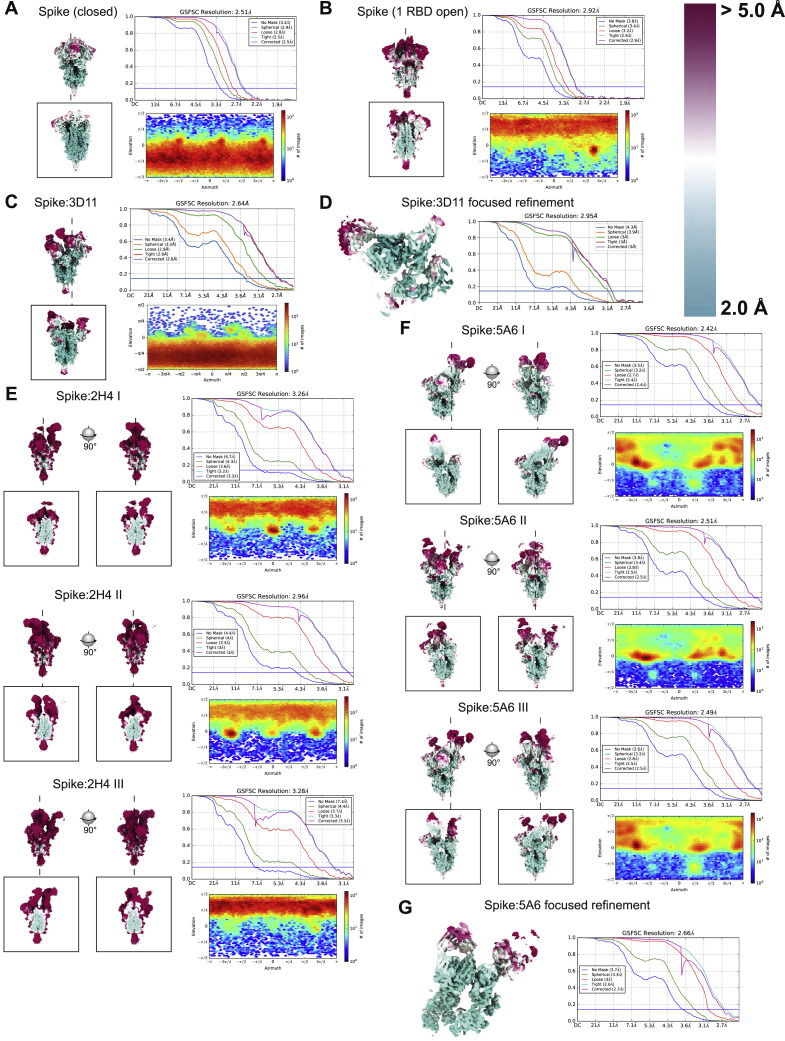
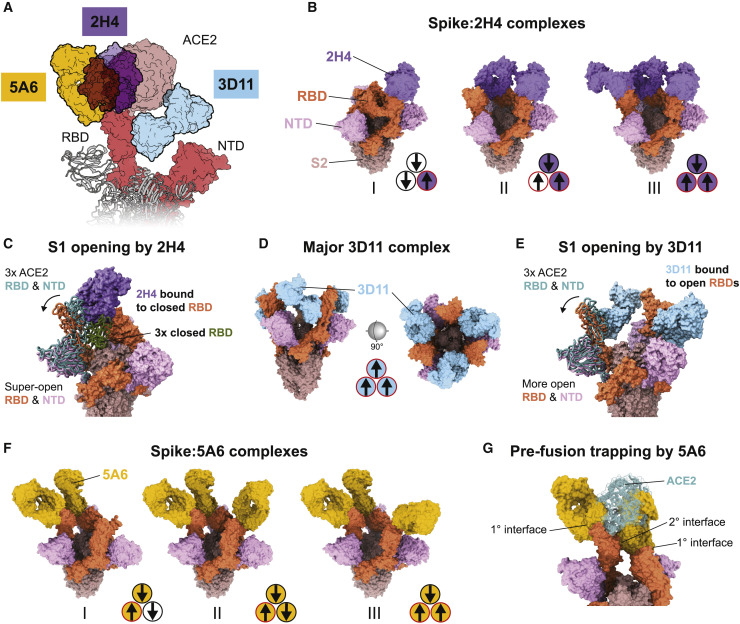
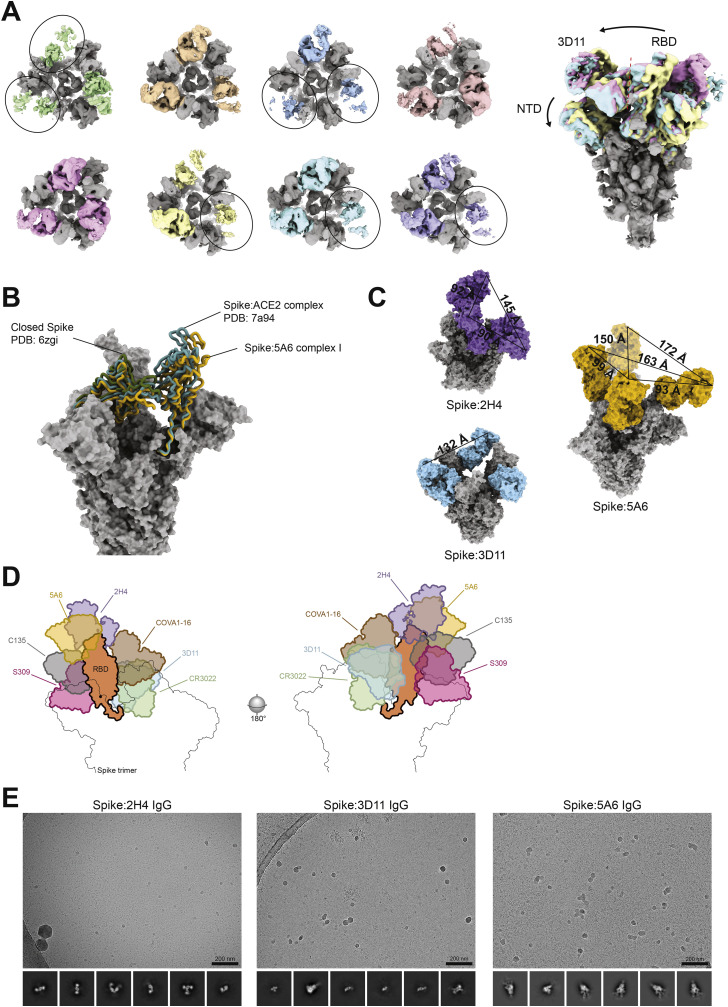
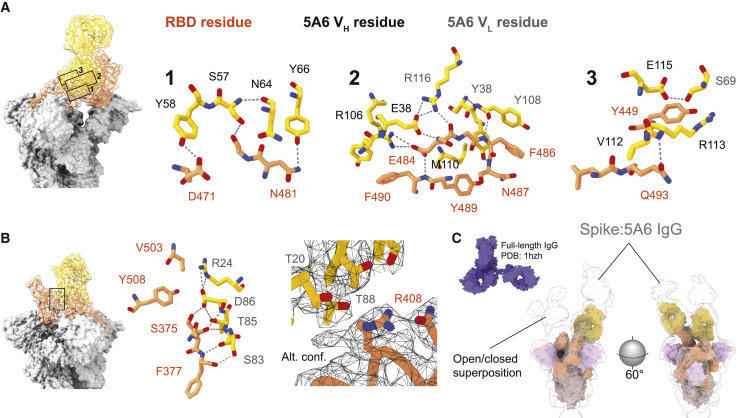
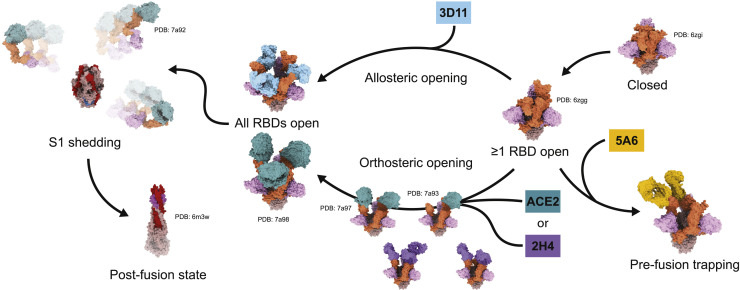
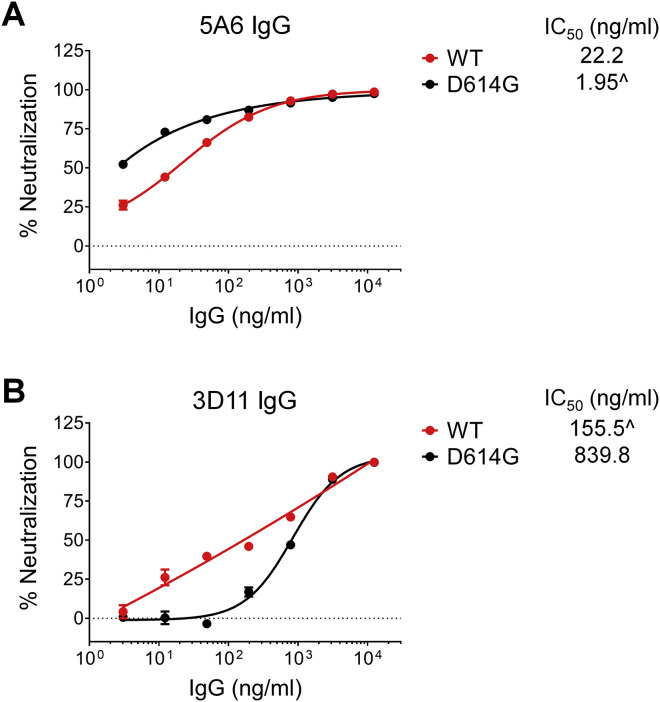
Infection with severe acute respiratory syndrome coronavirus 2 (SARS-CoV-2) is initiated by binding of the viral Spike protein to host receptor angiotensin-converting enzyme 2 (ACE2), followed by fusion of viral and host membranes. Although antibodies that block this interaction are in emergency use as early coronavirus disease 2019 (COVID-19) therapies, the precise determinants of neutralization potency remain unknown. We discovered a series of antibodies that potently block ACE2 binding but exhibit divergent neutralization efficacy against the live virus. Strikingly, these neutralizing antibodies can inhibit or enhance Spike-mediated membrane fusion and formation of syncytia, which are associated with chronic tissue damage in individuals with COVID-19. As revealed by cryoelectron microscopy, multiple structures of Spike-antibody complexes have distinct binding modes that not only block ACE2 binding but also alter the Spike protein conformational cycle triggered by ACE2 binding. We show that stabilization of different Spike conformations leads to modulation of Spike-mediated membrane fusion with profound implications for COVID-19 pathology and immunity.

Keywords: COVID-19; SARS-CoV; SARS-CoV-2; Spike protein; coronavirus; phage display; receptor binding domain (RBD); recombinant monoclonal antibody; syncytia.


Conflict of interest statement

Declaration of interests B.W., W.-H.L., C.-W.H., Y.H., P.M.L.N., E.Z.X.N., H.C.T., C.Y.L., R.A.M., M.K.S., F.J.T., Y.Y.C.Y., and C.-I.W. are listed as inventors of a filed patent for all 27 monoclonal antibodies mentioned in this manuscript.

Figures

None
Graphical abstract
Figure 1
Figure 1
Isolation of SARS-CoV-2 receptor-blocking antibodies from a naive human library (A) Blocking of ACE2/RBD (SARS-CoV-2) interactions by 27 Fab clones, tested by competition ELISA. The samples used in the assays were unpurified Fabs from bacterial supernatant; hence, the percentages of blocking were not indicative of their true potency. Red arrows indicate the 6 clones in subsequent studies. (B) KD of Fabs based on 1:1 Langmuir fitting and apparent KD of IgGs based on 1:2 bivalent analyte fitting of BLI sensorgrams for immobilized Fc-RBD. Values are the mean and standard deviation of two independent experiments. (C) Binding and dissociation of Fabs and IgGs to and from immobilized Fc-RBD by BLI. The concentration of Fabs and IgGs shown is 12.5 nM. (D) Epitope binning of 5A6 by BLI analysis. 5A6 is immobilized as the ligand. Tagless RBD is introduced as the first analyte. The second antibody is introduced as the second analyte. As controls, buffer alone, an isotype IgG, and 5A6 IgG were included as the second analyte. See also Figure S1 and Tables S1 and S2.
Figure S1
Figure S1
Characterization of SARS-CoV-2 receptor-blocking antibodies, related to Figure 1 (A) Blocking of ACE2/SARS-CoV-2 RBD interaction by 1F4, 2H4, 3D11, 3F11, 5A6 and 6F8 IgGs tested by competition ELISA. Data are presented as mean ± SD in triplicates and are representative of two independent experiments. (B) Binding avidity of 1F4, 2H4, 3D11, 3F11, 5A6 and 6F8 IgG antibodies to SARS-CoV-2 Spike RBD proteins tested by ELISA. Data are presented as mean ± SD in triplicates and are representative of two independent experiments. (C) Binding affinity of five Fab clones to SARS-CoV-2 Spike RBD protein measured by biolayer interferometry. Fab binding to immobilized Fc-RBD was tested using a range of Fab concentrations from 100 nM to 3.125 nM (in 2-fold dilution). A representative set of measurements from two independent experiments is shown with sensorgrams in black and curve fittings in red. (D) Binding avidity of six IgGs to the RBD by biolayer interferometry. IgG Binding to immobilized Fc-RBD was tested using a range of IgG concentrations from 12.5 nM to 0.39 nM (in 2-fold dilutions). The anti-Fc sensor chip was quenched with excess irrelevant, same-isotype IgG to prevent confounding from antibody binding directly to the chip. A representative set of measurements from two independent experiments is shown with sensorgrams in black and curve fittings in red.
Figure 2
Figure 2
SARS-CoV-2 neutralization by receptor blocking antibodies. (A) Infection of CHO-ACE2 cells by SARS-CoV-2 pseudovirus were determined in the presence of receptor-blocking IgGs (left panel) or Fabs (right panel). Luciferase activities in the CHO-ACE2 cells were measured, and the percent neutralization was calculated. Data are presented as mean ± SEM in triplicates and are representative of two independent experiments. The IC50 was calculated by a variable-slope four-parameter non-linear regression model using GraphPad Prism 7 software or the Quest Graph IC50 Calculator from AAT Bioquest (https://www.aatbio.com/tools/ic50-calculator) with top and bottom constraints set at 100% and 0%, respectively. (B) Infection of Vero E6 C1008 cells by SARS-CoV-2 live virus (isolated from a nasopharyngeal swab of an individual in Singapore) were determined in the presence of receptor-blocking IgGs (left panel) or Fabs (right panel). Infection-induced cytopathic effect was determined by detecting the amount of ATP present in the uninfected live cells from which the percent neutralization was calculated. Data are presented as mean ± SEM in triplicates and are representative of two independent experiments. The IC50 was calculated by a variable-slope four-parameter non-linear regression model in GraphPad Prism 7 software. Pseudovirus and live virus neutralization assays were not performed for 6F8 Fab because of 6F8 IgG’s low and similar potency to other clones. (C) Evaluation of antiviral activity of 5A6 in a model of reconstituted human airway epithelium (HAE). Viral genome quantification was performed using qRT-PCR, and results are expressed in relative virus production (intracellular or apical) compared with the control. Bars represent the mean ± SD in duplicates. ∗∗∗p < 0.001, ∗∗p < 0.01, and p < 0.05 compared with the control (no Ab) by one-way ANOVA. The trans-epithelial electrical resistance (TEER in Ω/cm2) was measures at 48 hpi (hours post-infection). (D) Correlation curve of affinity/avidity for RBD and live virus neutralization potency (IC50) of receptor-blocking IgG antibodies (circles), Fab antibodies (triangles), and ACE2-Fc (black diamond). The IC50 values were calculated using a four-parameter logistic regression model in the Quest Graph IC50 Calculator from AAT Bioquest. (E) Binding of the IgG (solid lines, circles) and 5A6 Fab (dashed line, red triangle) to the purified SARS-CoV-2 pseudovirus. Data are presented as mean ± SD in duplicates and are representative of two independent experiments. See also Figure S2 and Table S2.
Figure S2
Figure S2
SARS-CoV-2 live virus neutralization and antibody binding to the Spike trimer measured by SPR, related to Figure 2 (A) The potency of 2H4, 3D11 and 5A6 IgG antibodies in neutralizing live SARS-CoV-2 virus assays determined by measuring the viral genome copy number (GCN). Infection of Vero E6 C1008 cells by SARS-CoV-2 live virus (isolated from a nasopharyngeal swab of a patient in Singapore) were determined in the presence of receptor blocking IgGs 2H4, 3D11 and 5A6. 48 hours post infection, culture supernatant was harvested and viral GCN was determined by RT-qPCR targeting the N gene and GCN values were determined by comparing Ct values against a logGCN standard curve. The GCN values were then converted to percent neutralization and plotted with a non-linear regression curve fit using PRISM. IC50 was calculated by a variable slope four parameter non-linear regression model in Graphpad PRISM 7 without or ˆwith top and bottom constraints set at 100% and 0% respectively. Data are presented as mean ± SEM from 6 replicates. (B) Binding avidity of IgG clones 2H4, 3D11, 3F11, 5A6, and 6F8 for intact Spike trimer measured by surface plasmon resonance (SPR). A range of IgG concentrations from 12.5 nM to 0.39 nM (in 2-fold serial dilution) are shown, with sensorgrams in black and curve fits in red. (C) Binding affinity of Fab clones 1F4, 2H4, 3D11, 3D11, and 5A6 for intact Spike trimer measured by surface plasmon resonance (SPR). A range of Fab concentrations from 100 nM to 3.125 nM (in 2-fold serial dilution) are shown, with sensorgrams in black and curve fits in red. (D) Log-log scatterplot comparing antibody binding constants for Fc-RBD (x axis) to those for Spike trimer (y axis). Affinity or avidity of antibodies or Fab fragments for the flexible Fc-RBD construct represent binding without geometric constraints, while measurements using immobilized Spike trimers represent binding with the specific geometries afforded by the Spike:antibody complexes. For most species, SPR and BLI measurements are similar, however 3D11 IgG and ACE2-Fc bind significantly more weakly to relatively unrestricted Fc-RBD than to Spike trimer (note that the 3D11 IgG binds > 10x more tightly than 3D11 Fab in both sets of experiments, indicating avid binding). 5A6 IgG binds somewhat more tightly to Spike trimer than to Fc-RBD, perhaps indicating that RBDs within a Spike trimer have particularly favorable geometries for binding.
Figure 3
Figure 3
Anti-SARS-CoV-2 Spike RBD IgG antibodies affect trypsin-induced cell syncytium formation Vero E6 cells were transfected with the furin recognition mutation of SARS-CoV-2 S-protein (R682RAR to A682AAR)-GFP. After 48 h, the cell culture medium was changed to DMEM (no serum), treated with antibodies or left untreated, and incubated for 1 h at 37°C. The cells were then treated with trypsin at 15 μg/mL for 2 h at 37°C or left untreated. Cells were fixed with 4% paraformaldehyde (PFA) and stained with DAPI. (A) S protein-expressing Vero E6 cells treated with 5A6 IgG (20 μg/mL), 5A6 Fab (20 μg/mL), 3D11 IgG (20 μg/mL), and 2H4 IgG (10 μg/mL) in 10×, 20×, and 40× objective view. Images were taken using an Olympus confocal microscope. (B) Dosage response of 5A6 IgG, 5A6 Fab, 3D11 IgG, and 2H4 IgG. S protein-expressing Vero E6 cells were treated with 0, 0.1, 0.5, 2, and 10 μg/mL of each antibody. For 5A6 IgG dosage response, 2 × 10⁵ cells/sample were used for transfection. For 5A6 Fab, 2H4 IgG, and 3D11 IgG dosage response, 1.6 × 105 cells/sample were used for transfection. Data quantification was calculated on syncytium numbers and nuclei numbers in each syncytium. Data are presented as mean ± SD of three images.
Figure S3
Figure S3
Cryo-EM densities and resolution estimation, related to Figure 4 Density maps colored by local resolution, Fourier shell correlation curves, and particle orientation distributions for the structures reported in this work. All maps use the same local resolution scale, shown at the top right of the figure. (A) The apo Spike, with all RBDs closed. (B) The apo Spike, with one RBD open. (C) The Spike:3D11 complex. (D) Refinement of Spike:3D11, focused on the Fab variable domains and RBD epitope. (E) Spike:2H4 complexes with one, two, or three Fabs bound. (F) Spike:5A6 complexes. (G) Refinment of Spike:5A6 complex I, focused on the Fab variable domains and quatenary epitope involving two RBDs (one open, with the clockwise adjacent RBD trapped closed).
Figure 4
Figure 4
Structures of Spike-Fab complexes (A) Schematic of three Fabs—5A6 (goldenrod), 2H4 (purple), and 3D11 (sky blue)—bound to the SARS-CoV-2 Spike protein. All Fabs are shown in relation to the complex formed by an open RBD (red) and the extracellular domain of ACE2 (rose brown). (B) Spike:2H4 complexes depicted as surface models, with 2H4 in purple, RBDs in coral, NTDs in plum, and the S2 core in rose brown. Triads of small circles to the lower left of each complex figure represent the three RBDs, with an inset arrow indicating the open (up) or closed (down) conformation and purple fill indicating a bound Fab. The ensemble of Spike:2H4 complexes is reminiscent of several intermediates in the conformational cycle triggered by serial binding of ACE2. (C) A cutaway of Spike:2H4 complex II, highlighting the steric effect of 2H4 bound to a closed RBD on the counterclockwise adjacent RBD and NTD. The 2H4-bound RBD clashes with both RBDs from the fully closed trimer conformation (PDB: 6ZGI; dark green) and the fully opened conformation with three ACE2 molecules (PDB: 7A98; cadet blue). (D) The single major Spike:3D11 complex with colors as in (B) (3D11 in sky blue). All RBDs are open, resembling the open trimer bound to three copies of ACE2. Right: the extracellular view along the Spike trimer axis reveals its S2 core essentially unsheathed. (E) A cutaway of the Spike:3D11 complex, showing that its effect on the neighboring RBD is similar to that of 2H4 but less pronounced. Colors are as in (C), with 3D11 in sky blue. (F) Spike:5A6 complexes with colors as in (B) and 5A6 in goldenrod. Each complex exhibits the same quaternary state across two RBDs, with 5A6 bound between one closed RBD and a counterclockwise adjacent open RBD also bearing a copy of 5A6. The third RBD is usually open and may also bind 5A6. (G) The quaternary epitope seen in all Spike:5A6 complexes involves two distinct interfaces and appears to trap the pre-fusion Spike by locking closed one RBD. Binding to either interface results in steric occlusion of ACE2 (PDB: 7A94; cadet blue) from the RBD. Both Fabs synergistically block ACE2 binding to the open RBD, whereas the Fab at the quaternary epitope blocks ACE2 binding to two RBDs simultaneously. See also Figures S3, S4, and S5; Table S3; and Videos S1, S2, and S3.
Figure S4
Figure S4
Additional structural details, related to Figure 4 (A) Eight subclasses of the Spike:3D11 complex, determined using symmetry relaxation in Relion 3.1. At left, top views show that these classes vary in the occupancy of Fab at each RBD. Only Fabs are colored, with missing or weak Fab densities are indicated by black ellipses. At right, two extremum classes and one intermediate show relative motion of the RBDs and NTDs, relaxations which likely contribute to the S2 unsheathing that eventually permits Spike-mediated membrane fusion. Fabs, RBDs, and NTDs are colored, and a dashed line delineates Fab and RBD. The general direction of S2-opening movements, as observed in the classes, are indicated by black arrows. (B) The quaternary epitope bound by 5A6 is cryptic because the Fab stabilizes unique conformations of RBDs, observed only the the complex, that contribute to the epitope. RBDs from Spike:5A6 complex I (goldenrod) are shown relative to the fully closed Spike (PDB: 6zgi, forest green) and to the Spike with one RBD open and bound to ACE2 (PDB: 7a94, cadet blue). Interestingly, the open RBD bound to 5A6 is more open than that bound to ACE2, yet the neighboring RBD trapped closed by 5A6 is more closed than in the singular ACE2 complex or the fully closed Spike. (C) The hinge regions connecting the Fc domain of an IgG antibody to each of its two Fabs are 23 residues long, approximately 10 of which are flexible due to disulfide bonds. Assuming a standard polypeptide length of about 3.5 Å per residue, each hinge might extend as far as 35 Å, allowing for some 70 Å separation between the two Fabs. As shown, the shortest gaps between Fabs in the Spike:2H4 and Spike:5A6 complexes are ~90 Å, however variation of the elbow angles between Fab V and C domains could reduce the effective separation. Different Fab clones have elbow angles across just over 90° (Stanfield et al., 2006), and changes as great as 37° have been observed between multiple structures of the same clone (Wilson and Stanfield, 1994). For example, a 15° elbow bend might reduce separation by 10 Å at each Fab (20 Å total), to about the maximum length of the hinge. Bivalent, IgG-bound states thus likely differ in Fab elbow angle and feature some relaxation of the RBDs, in order to support the avid binding of IgG antibodies to Spike trimer observed in our experiments. (D) Comparison of 2H4, 3D11, and 5A6 to non-receptor binding motif antibodies reported in literature. The 2D representation of molecular surface models, with superposed RBDs, shows that C135 and S309 bind to the outward face of the RBD, which is exposed in the closed state, while our antibodies 5A6 and 2H4 bind to the tip of the RBD at epitopes that partially overlap the RBS. Finally, COVA1-16, CR3022, and our 3D11 clone all bind to the inward face of the RBD, which is hidden in the closed state. These last three have overlapping epitopes, but different binding geometries such that, unlike COVA1-16 and 3D11, CR3022 actually clashes severely with the NTD even when the bound RBD is open. (E) Example cryo-EM images and selected 2D class averages for Spike incubated with 2H4 IgG (left), 3D11 IgG (center), or 5A6 IgG (right). Images were collected on a Talos Arctica at 200 keV and low-pass filtered to 20 Å. The Spike:2H4 IgG sample contains numerous, relatively small particles, and some of its 2D class averages resemble monomeric Spike (classes 4 and 6) or two Spike monomers crosslinked by antibody (class 3). In the Spike:3D11 IgG sample, much of the protein is contained within stereotypical aggregates approximately 150 nm in size. Notable 2D averages resemble a Fab bound to Spike RBD (classes 3-5), rare Spike trimers in the closed conformation (class 2), and a potential Spike dimer or pair of monomers crosslinked by antibody (class 6). In contrast to the others, Spike:5A6 IgG is a well behaved sample (despite the crowded micrograph). The 2D class averages are easily recognizable as intact Spike trimer, as is the unique binding mode of 5A6.
Figure 5
Figure 5
Binding mode and epitope of 5A6 (A) A tour of the primary interface between the Spike RBD and 5A6, using three immediately adjacent cross-sections along the viewing axis. Spike residues and labels are colored in coral or by heteroatom, and 5A6 residues are colored goldenrod, with labels for VH residues in black and VL residues in gray. Fab residue labels use the international ImMunoGeneTics information system (IMGT) (Lefranc et al., 2003). Predicted hydrogen bonds are shown as dashed gray lines. The interface features extensive hydrogen bonding, numerous hydrophobic contacts, and multiple salt bridges. A aromatic cluster formed by 5A6 VL Y38 and Y108, and RBD F486; a salt bridge between 5A6 VH R106 and RBD E484; and a cation-pi interaction between Fab VH R112 and RBD Y449 are particularly notable. (B) The secondary interface between 5A6 and the neighboring open RBD comprises mostly hydrogen bonds, many of which involve main-chain atoms. Atom and label colors are as in (A). An interesting feature is stabilization of an alternate conformation of RBD R408 by 5A6 VL T20 and T88. (C) Two views of the Spike:5A6 IgG complex cryo-EM map (translucent gray) overlaid on the surface model of Spike:5A6 Fab complex I (colors as in Figure 4). The docked Fab complex model and the IgG complex cryo-EM density reveal a congruent epitope binding geometry in both formats, with two RBDs in the characteristic open/closed trapped conformation. Fc domains are visible as unmodeled blobs to the back of each Fab and are like a superposition of multiple possible stoichiometries. The third RBD seems to be a superposition of open and closed RBDs with IgG bound. The surface model of a full-length human IgG X-ray crystal structure (PDB: 1HZH) is shown for scale (comparison is facilitated by use of orthographic projection).
Figure 6
Figure 6
Spike functional modulation by receptor-blocking antibodies A schematic model representing the possible effects of receptor-blocking antibodies, and ACE2 itself, on the conformational cycle of the SARS-CoV-2 Spike trimer. On the virus surface, the Spike is found predominantly in the closed conformation or a “receptor-seeking” conformation with one RBD open. When serially bound by ACE2 or an orthosteric mimetic antibody like 2H4, the Spike trimer passes through a series of conformations that eventually permit S1 shedding and the S2 post-fusion transition that mediates membrane fusion. Alternatively, allosteric antibodies such as 3D11 can advance the trimer directly to the end of the opening process, potentiating formation of syncytia through fusion of neighboring cells. Allosteric opening most likely contributes to lower potency in a high-affinity receptor-blocking antibody and might even suggest the possibility of antibody-dependent enhancement of infection. Finally, the Spike might instead be recognized by 5A6, which inhibits membrane fusion and syncytium formation by preventing S1 shedding and trapping the pre-fusion trimer. By enjoining the exposure and conformational transition of the S2 subunit, the 5A6 complex represents an unproductive dead end for the Spike trimer. See also Figure S6.
Figure S5
Figure S5
Cryo-EM processing, related to Figure 4 (A) A micrograph drawn from the Spike:5A6 complex dataset, representative of those obtained for the Fab complexes. (B) Selected 2D class averages of Spike:5A6 particles, evincing clear secondary structure and multiple Fabs bound to the RBDs. (C) Cryo-EM image processing workflow for Spike alone, leading to structures of the trimer with all RBDs closed, and with one RBD open or in an intermediate state. (D) Processing workflow for the Spike:2H4 complex, resulting in structures with one, two, or three Fabs bound, as presented in the text. (E) Processing workflow for the Spike:3D11 complex, culminating in a high-resolution structure of the Fab and RBD epitope. (F) Processing workflow for the Spike:5A6 complex, resulting in the complexes presented in the text. Note the fourth class found during the second 3D classification step is a lower resolution duplicate of Spike:5A6 complex III. Processing culminates in a high-resolution of the Fab and its quaternary epitope involving two RBDs.
Figure S6
Figure S6
Neutralization of the SARS-CoV-2 pseudovirus with Spike mutant D614G, related to Figure 6 (A) Neutralization by 5A6 of SARS-CoV-2 pseudovirus bearing either wild-type Spike protein (red), or Spike with the D614G mutation (black). The efficacy of 5A6 IgG is against D614G mutant Spike is improved over wild-type. (B) Neutralization by 3D11 of SARS-CoV-2 pseudovirus bearing either wild-type Spike protein (red), or Spike with the D614G mutation (black). 3D11 IgG suffers a severe loss of efficacy against the mutant pseudovirus (more than 5-fold weaker IC50). Data are presented as mean ± SEM in triplicates and are representative of two independent experiments. IC50 was calculated by variable slope four parameter non-linear regression model using Graphpad PRISM 7 Software without or ˆwith top and bottom constraints set at 100% and 0% respectively.

Similar articles

Cited by

References

    1. Afonine P.V., Poon B.K., Read R.J., Sobolev O.V., Terwilliger T.C., Urzhumtsev A., Adams P.D. Real-space refinement in PHENIX for cryo-EM and crystallography. Acta Crystallogr. D Struct. Biol. 2018;74:531–544. - PMC - PubMed
    1. Barnes C.O., Jette C.A., Abernathy M.E., Dam K.A., Esswein S.R., Gristick H.B., Malyutin A.G., Sharaf N.G., Huey-Tubman K.E., Lee Y.E., et al. SARS-CoV-2 neutralizing antibody structures inform therapeutic strategies. Nature. 2020;588:682–687. - PMC - PubMed
    1. Benton D.J., Wrobel A.G., Xu P., Roustan C., Martin S.R., Rosenthal P.B., Skehel J.J., Gamblin S.J. Receptor binding and priming of the spike protein of SARS-CoV-2 for membrane fusion. Nature. 2020;588:327–330. - PMC - PubMed
    1. Brouwer P.J.M., Caniels T.G., van der Straten K., Snitselaar J.L., Aldon Y., Bangaru S., Torres J.L., Okba N.M.A., Claireaux M., Kerster G., et al. Potent neutralizing antibodies from COVID-19 patients define multiple targets of vulnerability. Science. 2020;369:643–650. - PMC - PubMed
    1. Burton D.R., Saphire E.O., Parren P.W. A model for neutralization of viruses based on antibody coating of the virion surface. Curr. Top. Microbiol. Immunol. 2001;260:109–143. - PubMed

Publication types

MeSH terms

Substances