. 2021 Jun 3;81(11):2332-2348.e9.
doi: 10.1016/j.molcel.2021.04.014. Epub 2021 May 10.

Intrinsically disordered Meningioma-1 stabilizes the BAF complex to cause AML

Affiliations

Intrinsically disordered Meningioma-1 stabilizes the BAF complex to cause AML

Simone S Riedel et al. Mol Cell. .

Abstract

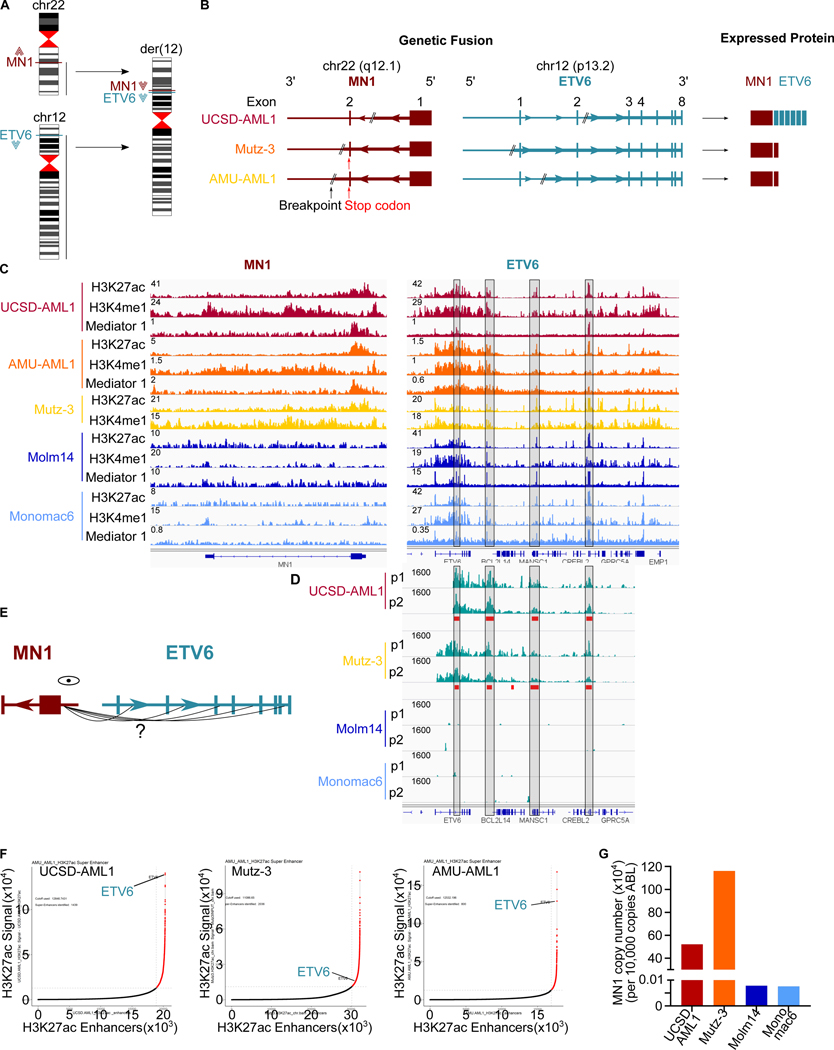
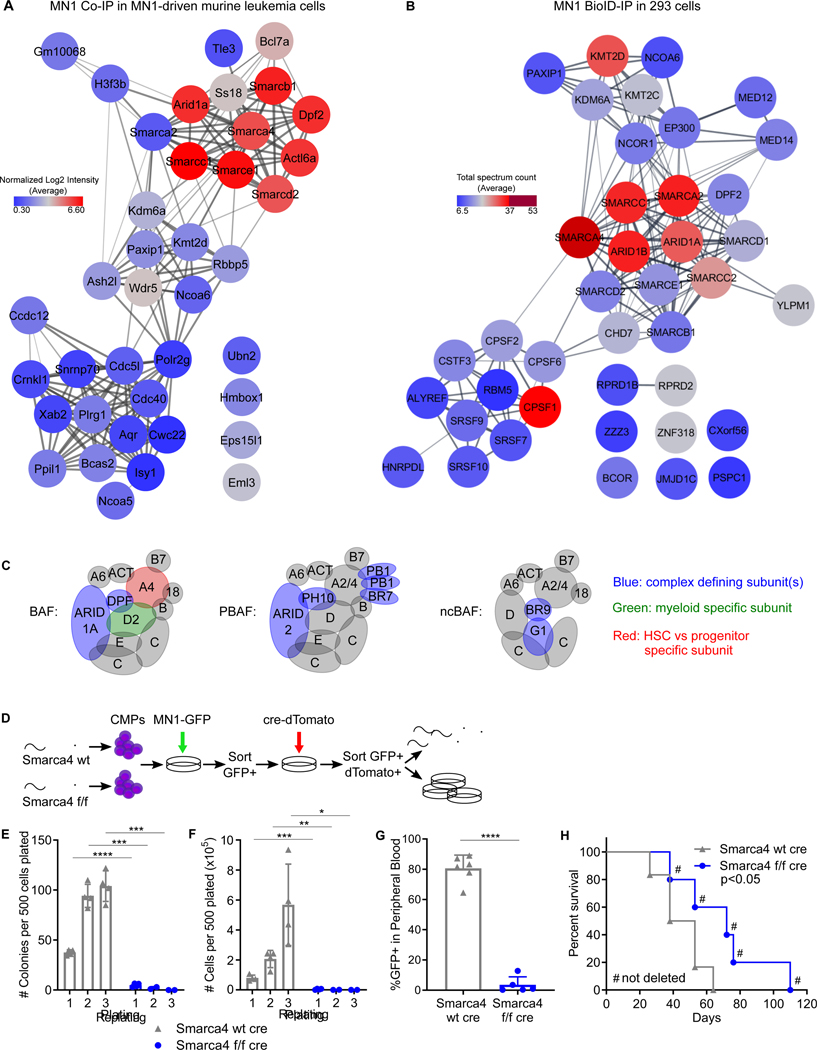
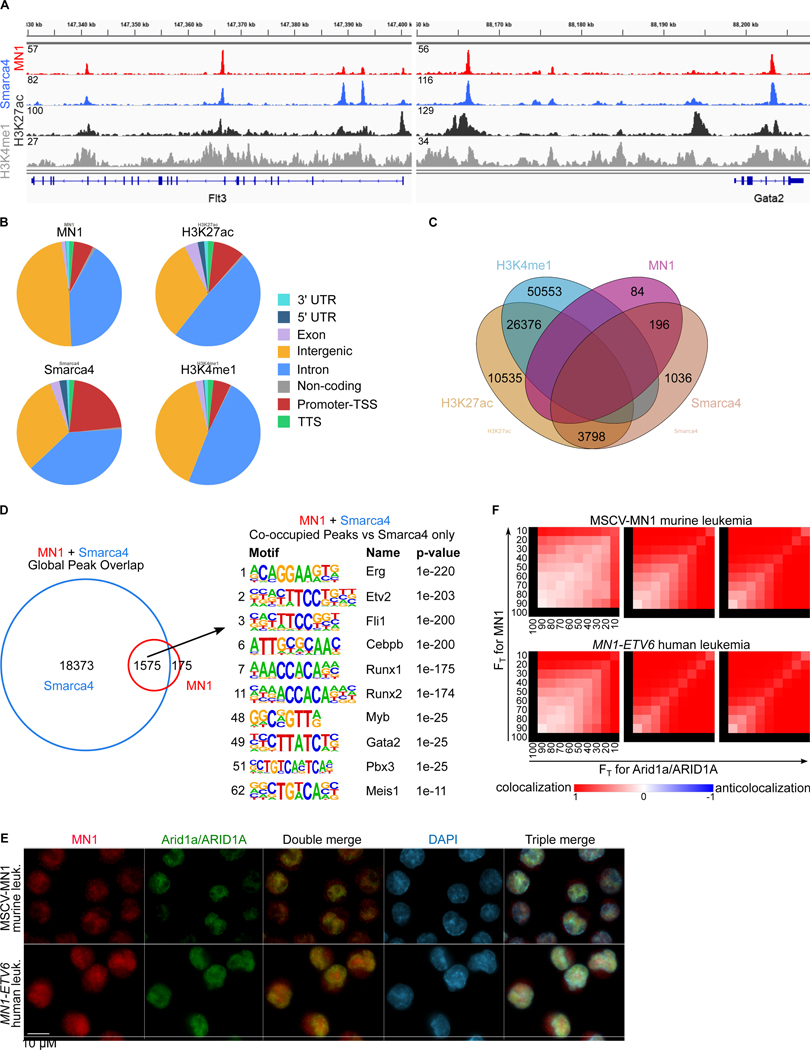
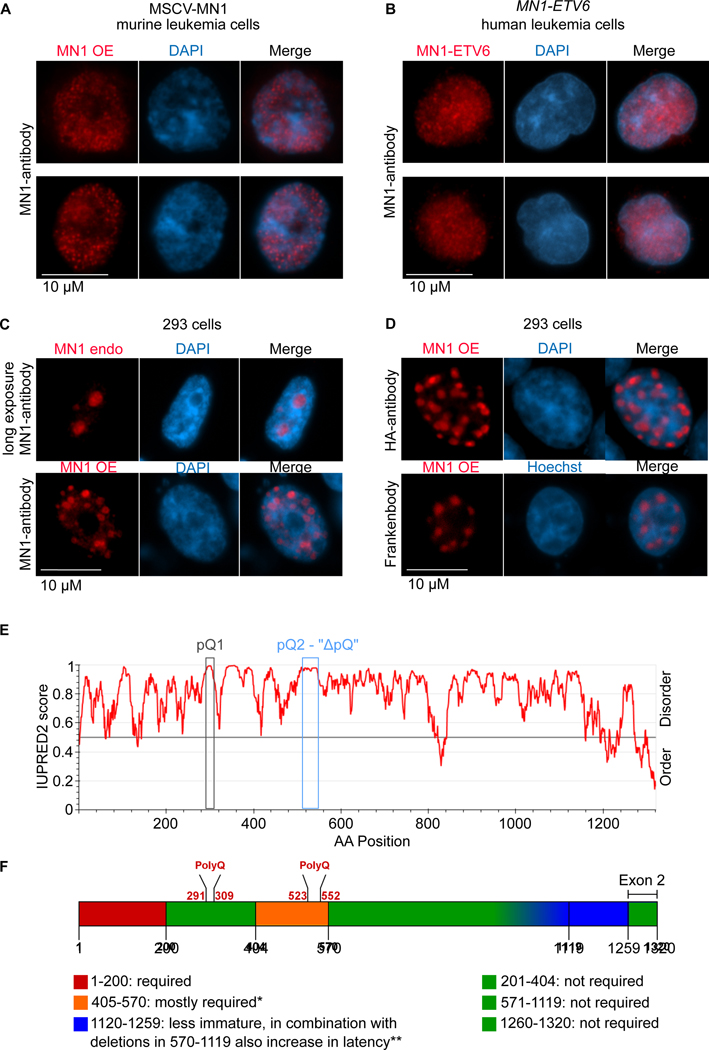
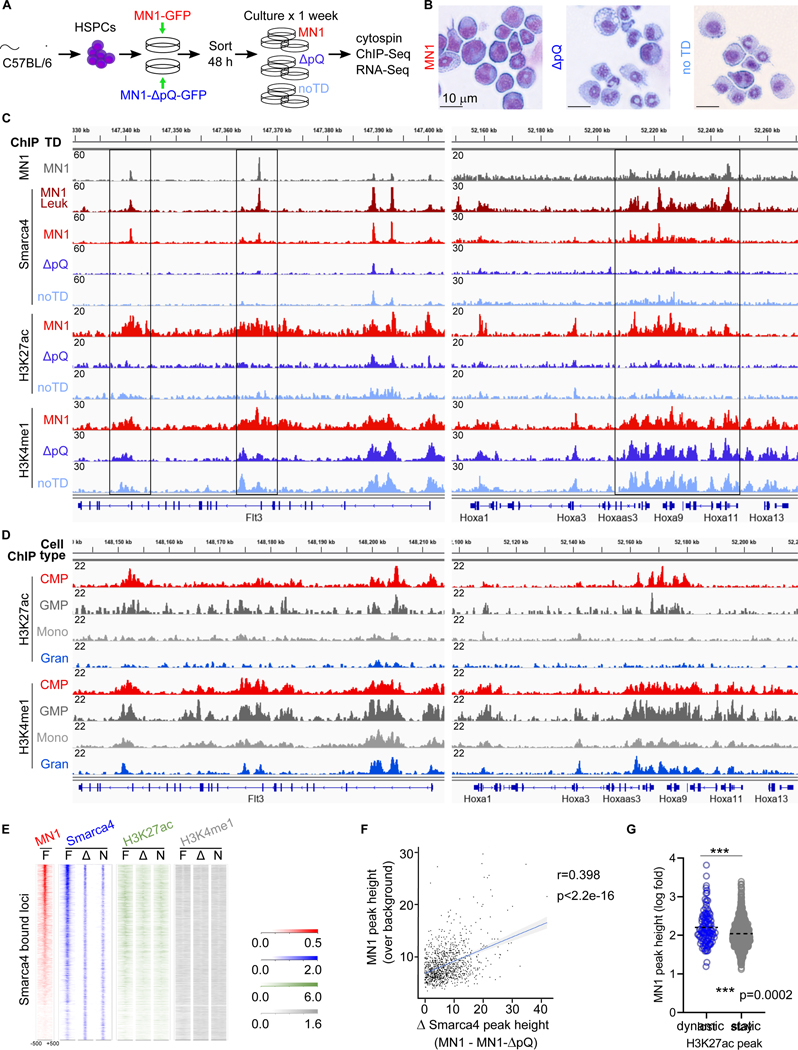
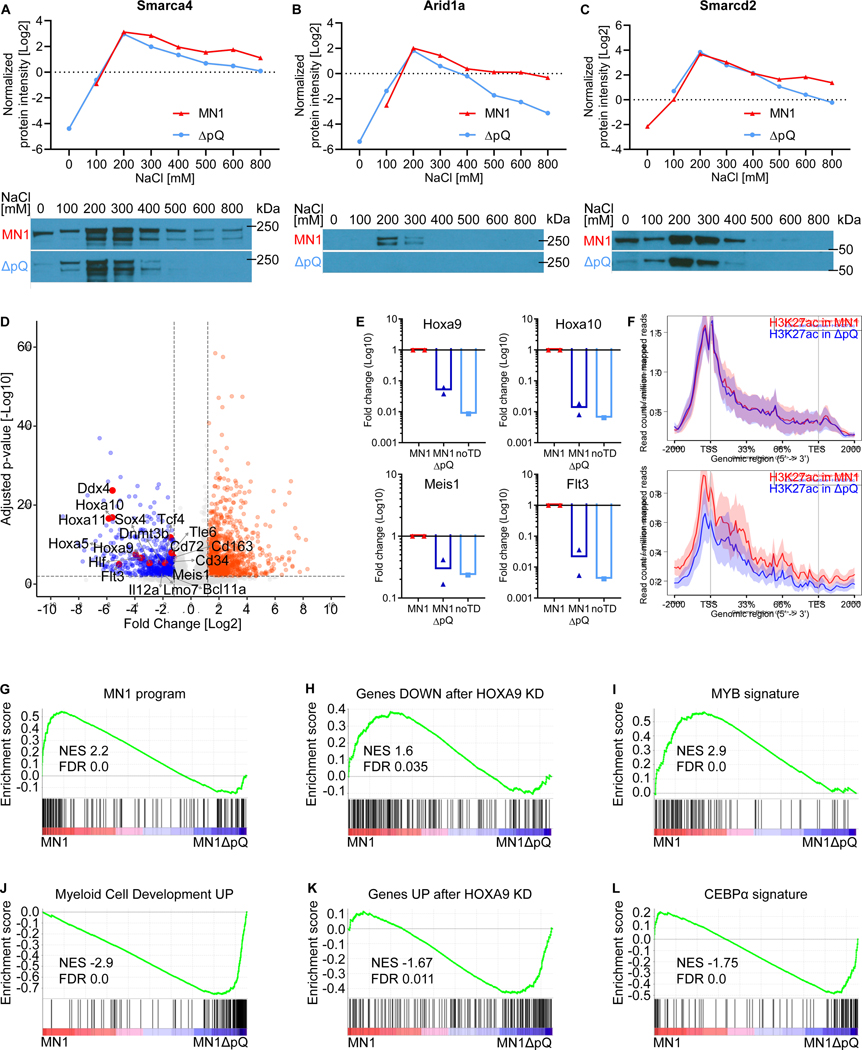
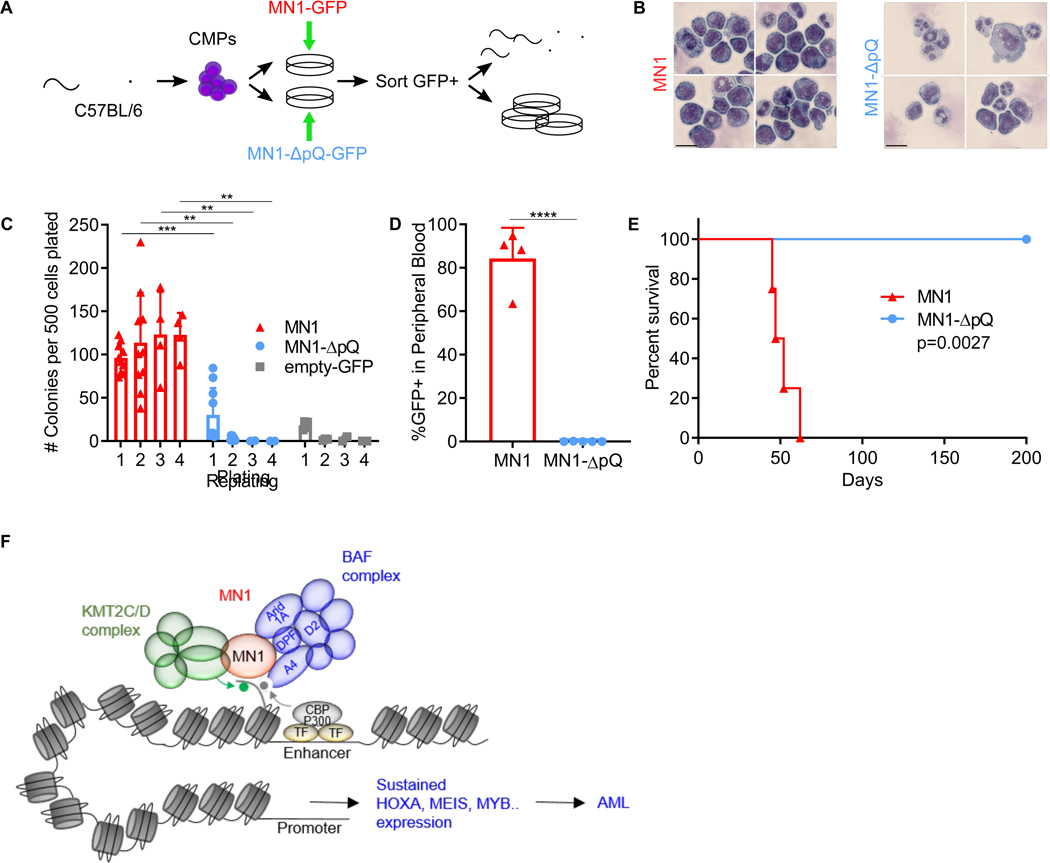
Meningioma-1 (MN1) overexpression in AML is associated with poor prognosis, and forced expression of MN1 induces leukemia in mice. We sought to determine how MN1 causes AML. We found that overexpression of MN1 can be induced by translocations that result in hijacking of a downstream enhancer. Structure predictions revealed that the entire MN1 coding frame is disordered. We identified the myeloid progenitor-specific BAF complex as the key interaction partner of MN1. MN1 over-stabilizes BAF on enhancer chromatin, a function directly linked to the presence of a long polyQ-stretch within MN1. BAF over-stabilization at binding sites of transcription factors regulating a hematopoietic stem/progenitor program prevents the developmentally appropriate decommissioning of these enhancers and results in impaired myeloid differentiation and leukemia. Beyond AML, our data detail how the overexpression of a polyQ protein, in the absence of any coding sequence mutation, can be sufficient to cause malignant transformation.

Keywords: AML; BAF; IDP; IDR; Meningioma-1; SWI/SNF; intrinsically disordered protein/region; leukemia; polyQ.


Conflict of interest statement

Declaration of interests K.M.B. holds a patent on the use of DOT1L inhibitors for MN1 leukemia. K.M.B. has received research funding from Syndax and has previously consulted for Agios. I.H. received research funding from Bristol-Myers Squibb (BMS), Celgene, Merck Sharpe & Dohme (MSD), Astellas, Otsuka, Ono, Kyowa Kirin, Sanofi, Shionogi, Zenyaku, Daiichi Sankyo, Taiho, Takeda, Chugai, Eli Lilly, Nihon Shinyaku, Novartis, Pfizer, Fujimoto, Tanabe-Mitsubishi, Fukuyu Hospital, and Yamada Yohojo and received honoraria from or holds membership on an entity’s board of directors, speaker’s bureau, or its advisory committees for Celgene, Janssen, Takeda, Ono, BMS, Novartis, Daiichi Sankyo, Kyowa Kirin, Eisai, Nihon-Shinyaku, Pfizer, AbbVie, Otsuka, Shionogi, Mundi, CSL, and MSD. All other authors declare no competing interests.

Figures

Figure 1.
Figure 1.. The MN1 promoter interacts with ETV6 regulatory regions in t(12;22) leukemias with and without MN1 fusion protein.
(A) Schematic of t(12;22) translocations. (B) Schematic of MN1 and ETV6 loci involved in t(12;22) translocation in UCSD-AML1, Mutz-3 and AMU-AML1 cells. UCSD-AML1 cells express a MN1-ETV6 fusion protein. Translocations in Mutz-3 and AMU-AML1 cells involve the native MN1 stop codon in the fusion. As a result, no fusion protein is generated, and only full-length MN1 is expressed on an RNA and protein level. (C) ChIP-seq tracks for H3K27ac (top) and H3K4me1 (middle) in t(12;22) cells UCSD-AML1 (red),

Mutz-3 (orange) and AMU-AML1 (yellow), as well as control cells without MN1-translocation Molm14 (dark blue) and Monomac6 (light blue). On the left side the MN1 locus is shown, the right side shows the ETV6 locus. The black boxes marks a region within and downstream of ETV6 identified as interacting with the MN1 promoter by 4C (see (D)). (D) Schematic of 4C experiment anchored at the MN1 promoter. (E) Interaction between the MN1 promoter and ETV6 enhancer / regulatory elements in t(12;22) UCSD-AML1 (MN1-ET6 FP) and Mutz-3 (no FP), but not Molm14 or Monomac6 control cells. Blue: 4C sequencing tracks, red: statistically significant interaction acc PeakC (Geeven et al., 2018). (F): ROSE algorithm identifies the ETV6 enhancer as super-enhancer in UCSD-AML1, Mutz-3 and AMU-AML1 cells. (G): high expression of MN1 in t(12;22) UCSD-AML1 (as part of a MN1-ET6 FP) and Mutz-3 (no FP), but not Molm14 or Monomac6. See also Figure S1
Figure 2.
Figure 2.. MN1 interacts with the myeloid progenitor specific BAF complex to drive AML.
(A) MN1 CoIP in MN1-driven murine leukemia cells followed by mass spectrometry (B) MN1 proximity-dependent biotinylation (BioID) in 293 cells followed by mass spectrometry (A+B) Node color represents the average protein abundance (log2 normalized signal intensity) of two independent experiments. Color scale goes from low abundance (blue) to high abundance (red). The canonical BAF complex shows the highest abundance. Connectivity map is based on the STRING database. (C) Schematic of the BAF, PBAF and non-canonical (nc) BAF complex based on (Mashtalir et al., 2018). Complex defining subunits are depicted in blue. The Smarcd2 subunit (green) has documented roles in myeloid development. Smarca4 (Brg1, red) is the ATPase subunit in hematopoietic progenitor cells, while in hematopoietic stem cells the ATPase subunit is Smarca2 (Brm). (D) Functional validation of the BAF core ATPase subunit Smarca4 in MN1 leukemia – experimental schematic. CMP cells were isolated from Smarca4 wt and Smarca4 f/f littermates. Cells were transduced with MN1 (GFP), sorted for GFP, then transduced with cre recombinase (dTomato). Sorted cells were injected into mice and subjected to in vitro assays. (E and F) Results from replating assays in semisolid medium. Colonies (E) and total cells (F) were counted every 5–6 days for a total of 3 platings. Graph shows mean and SD, n = 3 individual experiments, *p<0.05, **p<0.01, ***p<0.001, ****p<0.0001 (unpaired t-test) (G) Leukemic burden of Smarca4f/f and Smarca4−/− MN1 AML cells (GFP+) in the peripheral blood of mice 20 days after transplant as detected by flow cytometry., n=5–6 animals per group, ****p<0.0001 (unpaired t-test) (H) Kaplan Meier analysis of mice transplanted with Smarca4f/f and Smarca4−/− MN1 AML cells. # denotes mice that succumbed to leukemia not fully deleted for Smarca4. Two individual CMP donors per group, n=5–6 animals per group. p<0.05 (Cox-Mantel). See also Figure S2 and 3 and Table S1 + S2
Figure 3.
Figure 3.. MN1 colocalizes with the BAF complex on enhancer chromatin.
(A) ChIP-seq tracks of Flt3 and Gata2 loci from MN1 driven murine leukemia cells. MN1 track on top (red), below Smarca4 track (blue), H3K27ac (dark grey), and H3K4me1 (light grey). (B) Distribution of genomic elements associated with MN1, Smarca4, H3K27ac and H3K4me peaks. (C) Venn diagram of overlap between MN1, Smarca4, H3K4me1 and H3K27ac. (D) HOMER motif analysis of MN1 and Smarca4 co-occupied regions compared to Smarca4 –only. Number on the left denotes the rank of the shown motif. (E) Immunofluorescence microscopy images of fixed and stained cells. Scale bars are 10μm. Representative images of MN1-driven murine leukemia cells co-stained for MN1 (red) and Arid1a (green). DNA was counterstained with DAPI (blue). (F): Threshold overlap score analysis (TOS, (Stauffer et al., 2018)) of the immunofluorescence images in (E). Shown are three individual fields per cell line (representing nearly all the evaluable cells in each experiment). A full list of the HOMER analysis is available in Table S3.
Figure 4.
Figure 4.. MN1 is an intrinsically disordered protein with a long polyQ-stretch
(A) Representative MN1-driven murine leukemia cells stained for MN1 (red) and DNA counterstained with DAPI (blue). (B) Representative MN1-ETV6 translocated human UCSD-AML1 leukemia cells stained for MN1 (red) and DNA counterstained with DAPI (blue). (C) Nuclear distribution of MN1 in untransfected 293 cells (top panels, long exposure to capture low baseline level expression of MN1) and in MN1 transfected 293 cells (bottom panels, short exposure). MN1 detection using a polyclonal MN1 antibody (D) confirmatory MN1 staining in 293 cells transfected with HA-tagged MN1 using an HA-antibody (top panels) or co-expression of an intracellular single-chain variable fragment binding the linear HA epitope (“Frankenbody”, bottom panels) (E) IUPRED2 prediction for intrinsic disorder of MN1. The x-axis shows the amino acid position, the y-axis shows the score for the predicted disorder with a score closer to 1 indicating higher disorder. Blue box marks the region of the 28-polyQ-stretch that was subsequently deleted (ΔpQ). (F) Summary of published MN1 deletion studies (Kandilci et al., 2013; Lai et al., 2014; Wenge et al., 2015). Generally, red/orange areas were previously determined as necessary for MN1 oncogenic function, while green areas are dispensable. Specifically, the most N-terminal fragment AA1–200 was absolutely required for leukemia initiation in all studies. In contrast, deletion of AA201–404 did not affect penetrance or differentiation, and only minimally affected latency. This region encompasses the first Q-rich region, a stretch of several consecutive PQQQ motives. A series of deletions in AA404–570, which encompasses the second polyQ-rich region, abrogated leukemogenesis, with only one mutant (Δ458–560+Δ570–1119 (Kandilci et al., 2013)) reported to induce hematopoietic malignancy with incomplete penetrance, long latency and both T-lymphoid and myeloid differentiation. Remarkably, deletion of the large AA570–1119 region did not affected leukemogenesis. MN1 with a deletion in AA1120 – 1320 induced in a completely penetrant and aggressive myeloid neoplasm but failed to induce the profound differentiation block of full length MN1, when combined with deletions in AA570–1119, latency was also increased. Finally, the very C-terminus encoded by exon 2 (AA1250–1320) is not required (Kandilci et al., 2013). See also Figure S4–6
Figure 5
Figure 5. Overexpression of MN1 stabilizes H3K27ac at MN1-bound loci.
(A) Schematic of the experimental setup. Isolated progenitor cells were transduced with either MN1 or MN1-ΔpQ. GFP+ cells and GFP- cells (equals no transduction, noTD) were sorted and maintained in culture for 1 week to allow differentiation, then submitted to ChIP-Seq and RNA-Seq. (B) Cytospins of cells transduced with the indicated construct at the time point of collection for ChIP-seq analysis (Figure 5) and RNA-Seq (Figure 6) analysis. (C) ChIP-seq tracks of murine MN1 leukemias and in vitro MN1 transduced or untransduced control HSPCs. The grey MN1 track at the top shows MN1 binding and the dark red track underneath (“MN1-leuk”) shows Smarca4 binging peaks in established leukemias as a reference. The remaining tracks refer to short term cultured cells as shown in A+B. Vertical labeling on the left (“ChIP”) indicates which marks are shown in the respective tracks. From top to bottom, MN1, Smarca4, H3K27ac, H3K4me1. Adjacent horizontal labeling (“TD” = transduction) indicates the construct used to transduce HSPCs or establish leukemias: MN1 (red) or MN1-ΔpQ (dark blue, “ΔpQ”). Untransduced control cells are light blue (“no TD” = no transduction). Shown are two loci with known functions in AML that display high MN1 peaks and aberrantly maintained Smarca4 binding and H3K27 acetylation, the Hoxa-cluster on the left and Flt3 on the right. (D) ChIP-seq tracks for H3K27ac and H3K4me1 at the Hoxa cluster and Flt3 locus during normal myeloid development. Tracks were obtained from publication Lara-Astiaso et al. Vertical labeling on the left (“ChIP”) indicates which marks are shown in the respective tracks. Adjacent horizontal labeling indicates the cell type. Common myeloid progenitors (CMP, red), granulocyte macrophage progenitors (GMP, dark grey), monocytes (Mono, light grey), granulocytes (Gran, blue). (E) Tag density plot for the indicated proteins/chromatin marks of Smarca4 bound loci anchored on MN1 in full length MN1 (“F”), MN1-ΔpQ (“Δ”) transformed cells, and untransduced control cells (“N”). (F) Correlation of MN1 peak height over background (y-axis) with the differential of Smarca4 peak height (x-axis) at loci that loose Smarca4 in MN1-ΔpQ transduced cells (ΔSmarca4, x-axis). R = Pearson correlation. (G) Violin plot of the genome-wide correlation between dynamic or static H3K27ac peaks (x-axis) and MN1 peak height (y-axis). ChIP-seq identified H3K27ac peaks that are only present in MN1, but not MN1-ΔpQ transformed or untransduced differentiating bone marrow progenitors after 7 days of culture (“dynamic”). In contrast, “static” H3K27ac are present in all the conditions. Dynamic H3K27ac peaks were associated with greater MN1 peak height at that locus (***p=0.0002, Mann Whitney). See also Figure S7
Figure 6
Figure 6. Overexpression of MN1, but not MN1-ΔpQ, aberrantly stabilizes the binding of the BAF complex to chromatin.
(A-C) Chromatin fractionation of bone marrow progenitor cells overexpressing either MN1 or MN1-ΔpQ. Increasing salt concentrations are used to elute proteins bound to chromatin. Proteins with tighter binding need higher salt concentrations to be eluted. Top Panel: Normalized iBAQ quantified peptide abundance in indicated chromatin fractions measured by mass spectrometry. Bottom panel: Western blot images for the respective fractionations. Three key BAF complex members Smarca4 (A), Arid1a (B), and Smarcd2 (C) are shown in the presence of either MN1 or MN1-ΔpQ. (D) RNA-seq volcano plot showing genes downregulated (left, blue) and genes upregulated (right, orange) in MN1-ΔpQ transformed cells compared to MN1. Labels indicate downregulated MN1 target genes. n=4 for MN1-ΔpQ (includes n=1 noTD), n=3 for MN1. (E) RT-qPCR confirmation of four key MN1 target loci, Hoxa9, Hoxa10, Meis1, and Flt3, for the three conditions MN1 (red, n=2), MN1-ΔpQ (dark blue, n=2), and noTD (light blue, n=1). (F) H3K27ac ChIP-Seq signal height and position upstream, downstream and over the coding frame of genes that are part of the leukemogenic MN1 program as defined by Heuser and colleagues (Heuser et al., 2011) and downregulated in MN1-ΔpQ (blue line) compared to MN1 (red line) transformed cells. A set of genes with matched expression levels in MN1 transformed cells that were not part of the MN1-program served as controls. (G-L) GSEA analysis of differentially regulated genes in MN1-ΔpQ transformed cells compared to MN1. (G) The leukemogenic MN1 program as defined by Heuser and colleagues (Heuser et al., 2011). (H) Genes downregulated after HOXA9 knock down (KD) (geneset: HOXA9_DN.V1_DOWN). (I) Genes dependent on Myb in the KMT2A/NRASG12D R2 cells (Roe et al., 2015). (J) Gene set associated with myeloid cell development (geneset: BROWN_MYELOID_CELL_DEVELOPMENT_UP). (K) Genes upregulated after HOXA9 knock down (KD) (geneset: HOXA9_DN.V1_UP). (L) Genes regulated by CEBPα. in the KMT2A/NRASG12D R2 cells (Roe et al., 2015) All genesets can be found in Supplemental Table S5. See also Figure S8, Table S4 and Table S5
Figure 7
Figure 7. The MN1 polyQ-stretch is required for leukemogenesis
(A) Experimental schematic. Isolated CMPs are transduced with either MN1 or MN1-ΔpQ, GFP+ cells are sorted and injected into mice or used for in vitro assays. (B) Cytospins of cells transduced with the indicated construct after the first methylcellulose plating (shown in C). Representative images of MN1 transduced cells (left) and MN1-ΔpQ transduced cells (right). (C) Replating assay in semisolid medium. Colonies were counted every 5–6 days for four platings total. MN1 (red triangles) and MN1-ΔpQ (blue circles) represent data from five independent experiments, each plated in duplicate. The empty-GFP control (grey squares) shows data from one experiment plated in duplicates. **p<0.01, ***p<0.001, (unpaired t-test) (D) Leukemic burden in mice transplanted with MN1 (red triangles) or MN1-ΔpQ-transduced cells (blue circles) in mice 17 days after transplantation. Peripheral blood of transplanted mice was collected and GFP+ cells were detected by flow cytometry. Shown are the mean and SD, n=5–6 animals per group, ****p<0.0001 (t-test) (E) Kaplan-Meier analysis of mice transplanted with MN1- (red triangles) or MN1-ΔpQ-transduced cells (blue circles). n=4–5 animals per group. p<0.005 (Cox-Mantel). See also Figure S9

Comment in

References

    1. Alver BH, Kim KH, Lu P, Wang X, Manchester HE, Wang W, Haswell JR, Park PJ, and Roberts CW (2017). The SWI/SNF chromatin remodelling complex is required for maintenance of lineage specific enhancers. Nat Commun 8, 14648. - PMC - PubMed
    1. Amemiya HM, Kundaje A, and Boyle AP (2019). The ENCODE Blacklist: Identification of Problematic Regions of the Genome. Sci Rep 9, 9354. - PMC - PubMed
    1. Boulay G, Sandoval GJ, Riggi N, Iyer S, Buisson R, Naigles B, Awad ME, Rengarajan S, Volorio A, McBride MJ, et al. (2017). Cancer-Specific Retargeting of BAF Complexes by a Prion-like Domain. Cell 171, 163–178 e119. - PMC - PubMed
    1. Bray NL, Pimentel H, Melsted P, and Pachter L. (2016). Near-optimal probabilistic RNA-seq quantification. Nat Biotechnol 34, 525–527. - PubMed
    1. Brown AL, Wilkinson CR, Waterman SR, Kok CH, Salerno DG, Diakiw SM, Reynolds B, Scott HS, Tsykin A, Glonek GF, et al. (2006). Genetic regulators of myelopoiesis and leukemic signaling identified by gene profiling and linear modeling. J Leukoc Biol 80, 433–447. - PubMed

Publication types

MeSH terms