. 2021 May 1;134(9):jcs254979.
doi: 10.1242/jcs.254979. Epub 2021 May 11.

An SNX10-dependent mechanism downregulates fusion between mature osteoclasts

Affiliations

An SNX10-dependent mechanism downregulates fusion between mature osteoclasts

Maayan Barnea-Zohar et al. J Cell Sci. .

Abstract

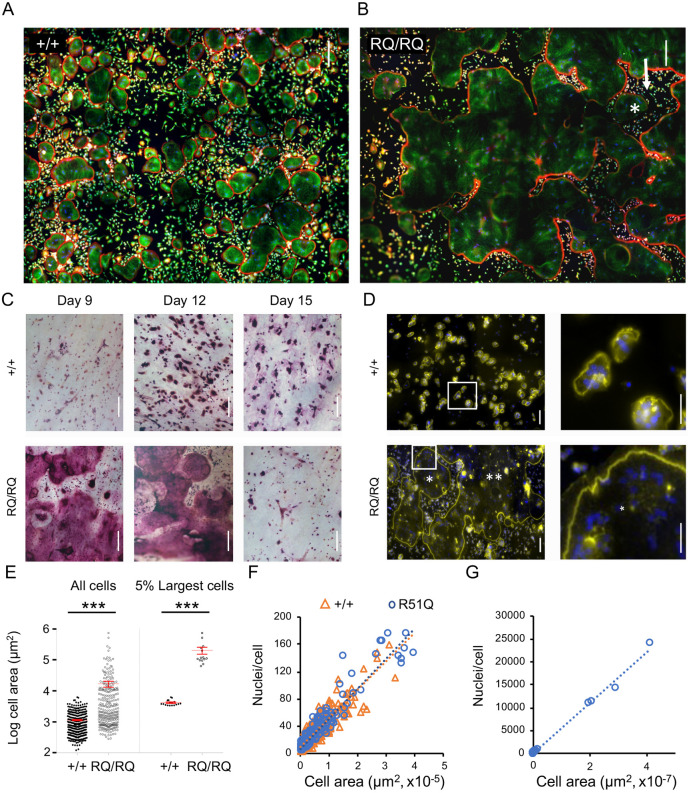
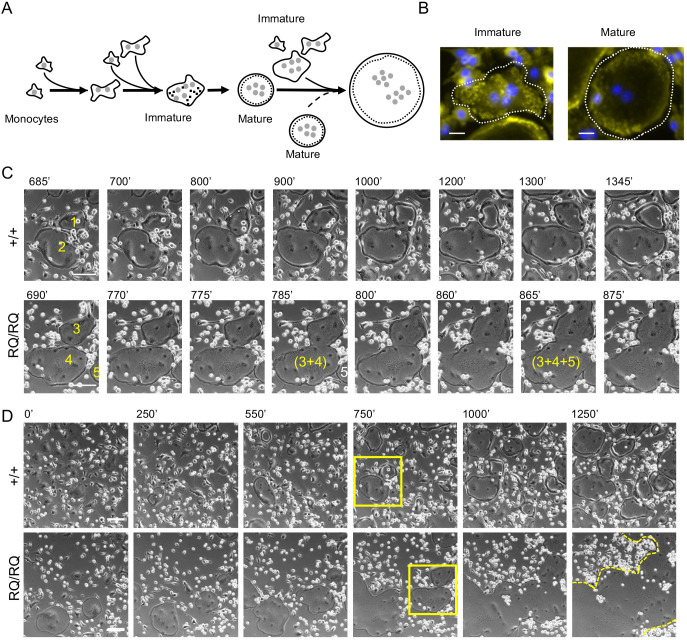
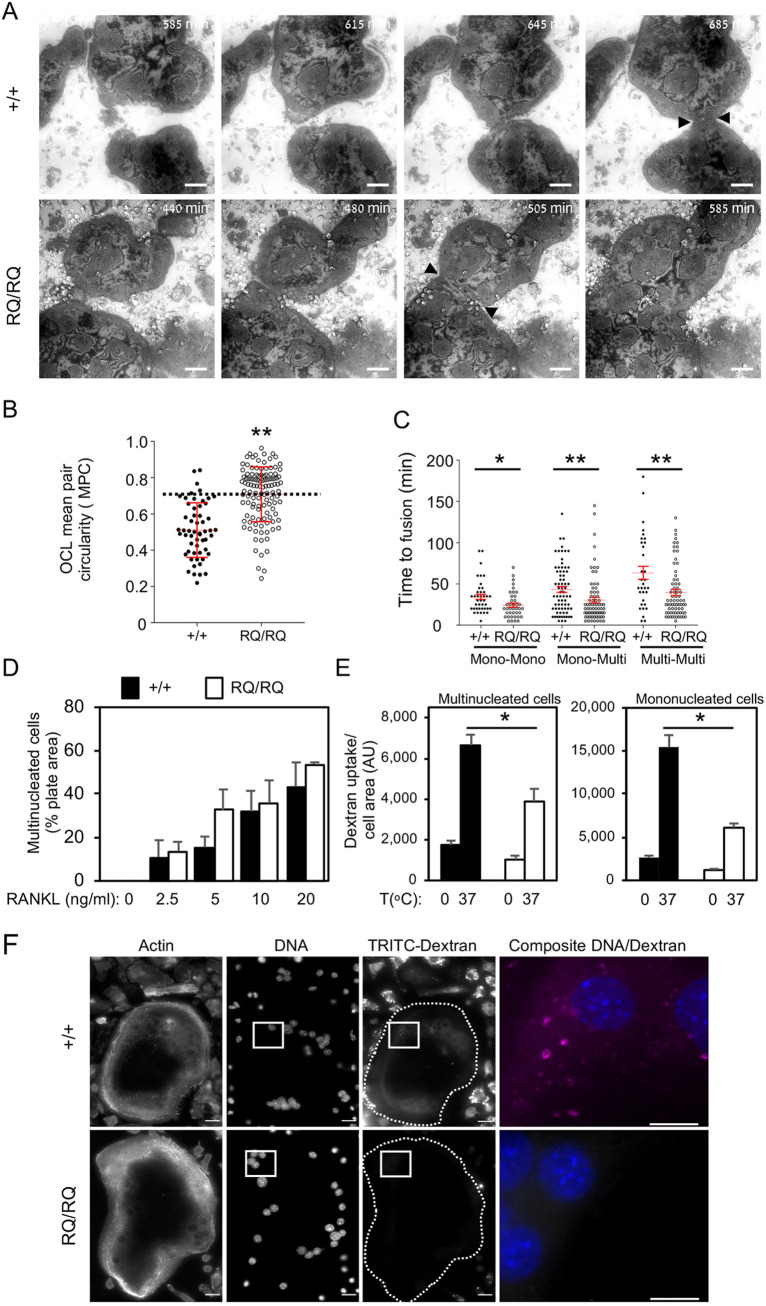
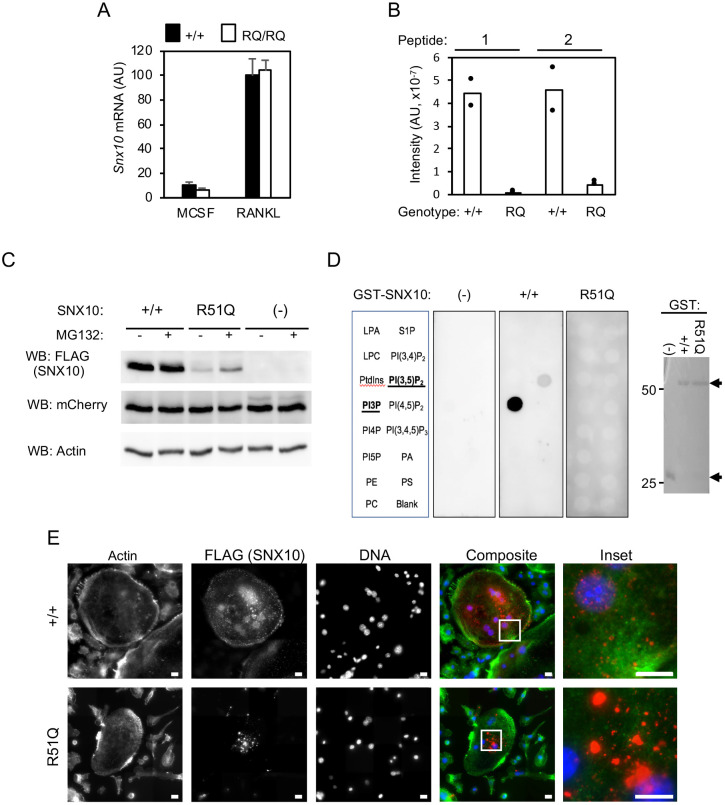
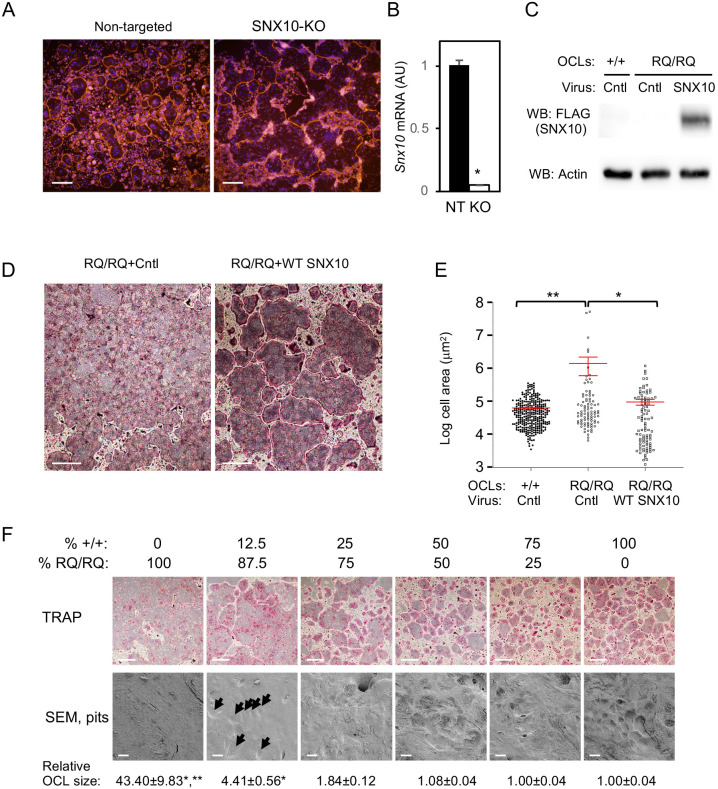
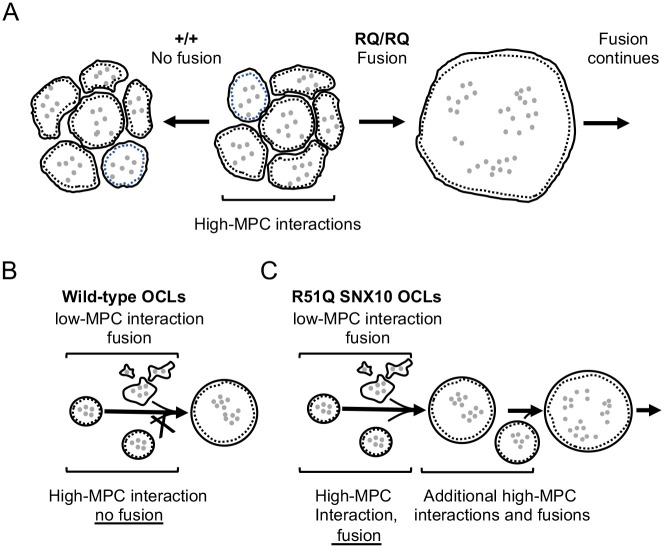
Homozygosity for the R51Q mutation in sorting nexin 10 (SNX10) inactivates osteoclasts (OCLs) and induces autosomal recessive osteopetrosis in humans and in mice. We show here that the fusion of wild-type murine monocytes to form OCLs is highly regulated, and that its extent is limited by blocking fusion between mature OCLs. In contrast, monocytes from homozygous R51Q SNX10 mice fuse uncontrollably, forming giant dysfunctional OCLs that can become 10- to 100-fold larger than their wild-type counterparts. Furthermore, mutant OCLs display reduced endocytotic activity, suggesting that their deregulated fusion is due to alterations in membrane homeostasis caused by loss of SNX10 function. This is supported by the finding that the R51Q SNX10 protein is unstable and exhibits altered lipid-binding properties, and is consistent with a key role for SNX10 in vesicular trafficking. We propose that OCL size and functionality are regulated by a cell-autonomous SNX10-dependent mechanism that downregulates fusion between mature OCLs. The R51Q mutation abolishes this regulatory activity, leading to excessive fusion, loss of bone resorption capacity and, consequently, to an osteopetrotic phenotype in vivo. This article has an associated First Person interview with the joint first authors of the paper.

Keywords: Bone; Cell fusion; Osteoclast; Osteopetrosis; SNX10.


Conflict of interest statement

Competing interests The authors declare no competing or financial interests.

Figures

Fig. 1.
Fig. 1.
R51Q SNX10 OCLs are gigantic. (A,B) Spleen-derived OCLs from +/+ (A) and RQ/RQ (B) mice grown on glass coverslips. Each image is a composite of 12 smaller fields; most of the RQ/RQ image is occupied by part of a single OCL. Cells were stained for actin (red), tubulin (green) and DNA (blue). Boundaries of individual OCLs are marked in Fig. S1C,D. Arrow in B indicates external area that is completely surrounded by the cell, and which contains an OCL (asterisk). (C) Spleen-derived OCLs from +/+ and RQ/RQ mice were grown on bone for the indicated periods, followed by TRAP staining. Figures represent four +/+ and nine RQ/RQ mice from three experiments. RQ/RQ image at day 12 is a composite of two identical images captured at different focal planes. (D) Cells grown on bone were stained for actin (yellow, SZs) and for DNA (blue, nuclei). Most of the RQ/RQ image is occupied by two giant cells that are marked with one or two asterisks, respectively. Each figure is a composite of 15 smaller fields. Right panels show magnified views of boxed areas in the left panels; asterisk (RQ/RQ image) indicates a region within a single OCL. Figures represent three mice/genotype analyzed in two experiments. (E) Size distribution of spleen-derived OCLs grown on bone and stained for TRAP. The left plot shows the average size (mean±s.d.) of multinucleated (≥three nuclei) OCLs shown is 1151±54 µm2 (+/+; N=353 cells) versus 16,892±3682 µm2 (RQ/RQ; N=280 cells). The right plot shows the average sizes of the largest 5% of OCLs were 4207±217 µm2 (+/+; N=17 cells) versus 206,175±52,323 µm2 (RQ/RQ; N=14 cells). ***P<0.0001 (unpaired two-tailed Student's t-test). The y-axis scale is logarithmic. Data are from one mouse per genotype, and represent four similar experiments with cells grown on bone or plastic. (F) Scatter diagram depicting the number of nuclei and area per cell in RQ/RQ and +/+ OCLs (N=205, 544 cells, respectively) of similar size ranges. Linear trendlines for both genotypes overlap (R2: +/+=0.8143, RQ/RQ=0.9095). Data are from one +/+ mouse and two RQ/RQ mice. (G) Similar to F, showing RQ/RQ OCLs of all size ranges. N=219 RQ/RQ OCLs, R2=0.9951. The large group of cells at the lower left is the same one shown in F. In panels D-G, cells were analyzed at their prime (day 8 for RQ/RQ OCLs, and day 12 for +/+ OCLs, owing to the faster development of the mutant cells). Scale bars: 200 µm (A-C); 100 µm (D, left panels); 50 µm (D, right panels).
Fig. 2.
Fig. 2.
RQ/RQ OCLs are large due to deregulated fusion. (A) Schematic outline of osteoclastogenesis as monocytes develop into OCLs when cultured with M-CSF and RANKL, based on live cell imaging studies. Small shaded circles, nuclei; black dots, podosomes; dashed circular lines, the podosomal SZL structure. Dashed arrow highlights fusion between two mature round OCLs, which is detected only in RQ/RQ cultures. (B) Immature (left) and mature (right) +/+ OCLs. Cells were stained for actin (podosomes, yellow) and DNA (nuclei, blue). Dashed white line indicates cell boundaries. (C) Image series showing mature round +/+ OCLs interacting for 660 min without fusing (cells 1 and 2, Movie 1), versus two rapid fusion events between mature RQ/RQ OCLs that occur during 175 min (cells 3, 4 and 5; from Movie 2). Small bright cells are monocytes. Numbers indicate individual cells; parentheses indicate fused cells. (D) Lower magnification images showing fusion of +/+ (from Movie 1) and RQ/RQ (Movie 2) OCLs. Rectangles indicate areas enlarged in C. Dashed line in RQ/RQ culture, t=1250 min, marks outline of a single large OCL. Composite movies of larger field views of OCL fusion are presented as Movies 3 (+/+) and 4 (RQ/RQ). Scale bars: 20 µm (B); 100 µm (C,D).
Fig. 3.
Fig. 3.
Fusion dynamics of homozygous R51Q SNX10 OCLs. (A) Images captured from IRM movies showing fusion of +/+ and RQ/RQ OCLs at the indicated times (from Movies 5 and 6, respectively). Arrowheads mark the area of contact between +/+ cells (top, t=685 min) and fusion between RQ/RQ cells (bottom, t=505 min). See also Figs S2, S3. (B) Scatter plot showing the MPC of pairs of multinucleated +/+ and RQ/RQ OCLs that fused, from Movies 3 and 4. Horizontal dashed line indicates MPC=0.7. MPC values (mean±s.d.) are 0.511±0.150 (+/+) and 0.708±0.151 (RQ/RQ), N=56 and 117 cell pairs, respectively. **P<0.0001 (unpaired two-tailed Student's t-test). (C) Elapsed time between initial cell-cell contact and subsequent fusion. Mono, mononucleated monocytes; Multi, multinucleated OCLs. Data are mean±s.e., N=31-73 fusion events per category and genotype. Data are from N=3 +/+ and 3 RQ/RQ mice from three experiments. *P=0.017, **P<0.0085 (unpaired two-tailed Student's t-test). (D) Percentage of the well surface area covered by +/+ and RQ/RQ OCLs differentiated with RANKL for 5 days (mean±s.e., N=3 mice/genotype in three experiments). OCL images are presented in Fig. S4A. (E) Uptake of dextran by +/+ and RQ OCLs (left) and mononucleated cells (right) following incubation for 30 min at 0 or 37°C in the presence of TRITC-dextran (40 kDa). Fluorescence images were acquired at identical settings for all conditions. Shown is the total TRITC fluorescence per cell normalized by cell area (mean±s.e.): *P≤0.0002 by one-way ANOVA with Tukey-Kramer post-hoc analysis. N=29-32 (+/+ multinucleated) and 11-13 (RQ/RQ multinucleated) or 59-64 (+/+ mononucleated) and 39-56 (RQ/RQ mononucleated) cells/bar from two experiments. Dextran uptake at 0°C and cell size ranges were similar in both genotypes. (F) Images of mature +/+ and RQ/RQ OCLs that had been incubated with TRITC-dextran for 30 min at 37°C. Dashed lines indicate cell boundaries. Scale bars: 100 µm (A); 20 µm (F); 10 µm (F, composite image at the far right). AU, arbitrary units.
Fig. 4.
Fig. 4.
Mislocalization, reduced stability and reduced lipid-binding ability of R51Q SNX10 in RQ/RQ OCLs. (A) qPCR analysis of Snx10 mRNA expression (mean±s.d.) in +/+ and RQ/RQ monocytes/macrophages (M-CSF) or OCLs produced from them (RANKL). N=12 +/+ and 14 RQ/RQ mice. (B) Targeted proteomics of +/+ and RQ/RQ OCL lysates. Two peptides (peptide 1, LQSNALLVQLPELPSK; and peptide 2, NLFFNMNNR, starting at residues 64 and 80, respectively, in the SNX10 sequence) were detected and quantified. N=2 mice/genotype. (C) RAW264.7 cells were infected with lentiviral vectors expressing FLAG-tagged wild-type (+/+) or R51Q SNX10, or were empty (−). Some cells were treated with 20 nM MG-132 for 4 h before processing. mCherry protein, which is co-expressed from the same lentiviral constructs, and actin serve as infection/expression and loading controls, respectively. (D) In the left panels, equal amounts of GST fusion proteins of +/+ or R51Q SNX10 were used to probe membrane phospholipid arrays. (−), negative control (GST alone). Array incudes lysophosphatidic acid (LPA), lysophosphocholine (LPC), phosphatidylinositol (PtdIns), PtdIns (3) phosphate (PI3P), PtdIns (4) phosphate (PI4P), PtdIns (5) phosphate (PI5P), phosphatidylethanolamine (PE), phosphatidylcholine (PC), sphingosine 1-phosphate (S1P), PtdIns (3,4) bisphosphate [PI(3,4)P2], PtdIns (3,5) bisphosphate [PI(3,5)P2], PtdIns (4,5) bisphosphate [PI(4,5)P2], PtdIns (3,4,5) trisphosphate [PI(3,4,5)P3], phosphatidic acid (PA) and phosphatidylserine (PS). The right panel shows a Coomassie-stained protein gel documenting the amounts of GST proteins used to probe the arrays. One experiment out of two performed is shown. Arrows mark GST-SNX10 (top) and GST (bottom). (E) Localization of wild-type and mutant SNX10 in OCLs. cDNA for +/+ SNX10 bearing a C-terminal FLAG tag was expressed in wild-type OCLs by adenoviral transduction; a tagged cDNA for R51Q SNX10 was similarly expressed in RQ/RQ OCLs, and the cells were probed for actin (green fluorescence), FLAG (SNX10, red) and DNA (blue). No FLAG signal was detected in untransduced cells (not shown). Scale bars: 10 µm. AU, arbitrary units.
Fig. 5.
Fig. 5.
The R51Q SNX10OCL fusion phenotype is caused by loss of SNX10 function. (A) SNX10-knockout (SNX10-KO) RAW 264.7 cells and control cells treated with a non-targeting control sgRNA were seeded on plastic plates and differentiated into OCL-like cells with M-CSF and RANKL for 4 days. The cells were stained for actin (TRITC-phalloidin, red) and DNA (Blue). Individual OCL boundaries and the sequence of the mutated locus are presented in Fig. S5. Data are from one SNX10-KO clone and are representative of six independent clones. (B) qPCR analysis of Snx10 mRNA expression (mean±s.e.) in non-targeted RAW 264.7 cells (NT) and in SNX10-KO (KO) cells shown in A. P=0.00049 (unpaired two-tailed Student's t-test, N=3 repeats). (C) Protein blot documenting expression of exogenous wild-type SNX10 in RQ/RQ OCLs, for panels D and E. Cntl, control adenovirus expressing GFP. SNX10, adenovirus expressing wild-type FLAG-tagged SNX10. (D) Images of TRAP-stained RQ/RQ OCLs infected with control (+Cntl) or wild-type SNX10 (+WT SNX10) adenoviruses. (E) Areas (mean±s.e.) of OCLs infected with control or wild-type SNX10 adenoviruses, from one experiment representative of two performed. *P=0.0042, **P=0.0002 (one-way ANOVA). N=88-309 multinucleated cells/category from three experiments. The y-axis scale is logarithmic. (F) +/+ and RQ/RQ monocytes/macrophages were mixed as indicated and differentiated into OCLs on plastic (TRAP) or bone (SEM). TRAP-stained cells (top) and scanning electron microscopy (SEM) of pits excavated by the cells (bottom) are shown, as well as cell sizes (mean±s.e., relative to the culture of 100% +/+ cells). *P<0.0001 versus 100% +/+ cell culture, **P<0.0001 versus 12.5% +/+ cells (unpaired two-tailed Student's t-test). N=222-606 cells/category (100%-12.5% +/+ cells) and N=28 cells (0% +/+ cells). Arrows mark resorbed pits in the 12.5% SEM image. Images are from one experiment, representing six TRAP and two SEM experiments. Scale bars: 500 µm (A); 250 µm (D,F, TRAP); 20 µm (F, SEM). AU, arbitrary units.
Fig. 6.
Fig. 6.
R51Q SNX10 abolishes a regulatory mechanism that blocks fusion between pairs of mature OCLs. (A) During osteoclastogenesis in vitro, round mature OCLs become surrounded by similarly mature OCLs, with which they form high-MPC interactions. In +/+ cultures (left), fusion halts at this point, but in RQ/RQ cultures (right) this is followed by massive continuous fusion. Gray dots indicate nuclei, and dashed lines represent SZLs. (B) Pairs of mature round OCLs of high-MPC values do not fuse in +/+ cultures, but fuse readily in RQ/RQ cultures. (C) OCL pairs of low-MPC values fuse in both genotypes.

References

    1. Aker, M., Rouvinski, A., Hashavia, S., Ta-Shma, A., Shaag, A., Zenvirt, S., Israel, S., Weintraub, M., Taraboulos, A., Bar-Shavit, Z.et al. (2012). An SNX10 mutation causes malignant osteopetrosis of infancy. J. Med. Genet. 49, 221-226. 10.1136/jmedgenet-2011-100520 - DOI - PubMed
    1. Battaglino, R. A., Jha, P., Sultana, F., Liu, W. and Morse, L. R. (2019). FKBP12: A partner of Snx10 required for vesicular trafficking in osteoclasts. J. Cell. Biochem. 120, 13321-13329. 10.1002/jcb.28606 - DOI - PMC - PubMed
    1. Blair, H. C., Yaroslavskiy, B. B., Robinson, L. J., Mapara, M. Y., Pangrazio, A., Guo, L., Chen, K., Vezzoni, P., Tolar, J. and Orchard, P. J. (2009). Osteopetrosis with micro-lacunar resorption because of defective integrin organization. Lab. Invest. 89, 1007-1017. 10.1038/labinvest.2009.58 - DOI - PMC - PubMed
    1. Boissy, P., Saltel, F., Bouniol, C., Jurdic, P. and Machuca-Gayet, I. (2002). Transcriptional activity of nuclei in multinucleated osteoclasts and its modulation by calcitonin. Endocrinology 143, 1913-1921. 10.1210/endo.143.5.8813 - DOI - PubMed
    1. Brukman, N. G., Uygur, B., Podbilewicz, B. and Chernomordik, L. V. (2019). How cells fuse. J. Cell Biol. 218, 1436-1451. 10.1083/jcb.201901017 - DOI - PMC - PubMed

Publication types