. 2021 May;18(178):20200803.
doi: 10.1098/rsif.2020.0803. Epub 2021 May 12.

A simple criterion to design optimal non-pharmaceutical interventions for mitigating epidemic outbreaks

Affiliations

A simple criterion to design optimal non-pharmaceutical interventions for mitigating epidemic outbreaks

Marco Tulio Angulo et al. J R Soc Interface. 2021 May.

Abstract

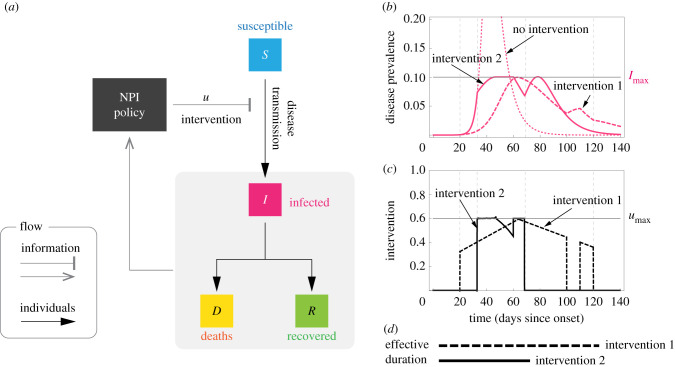
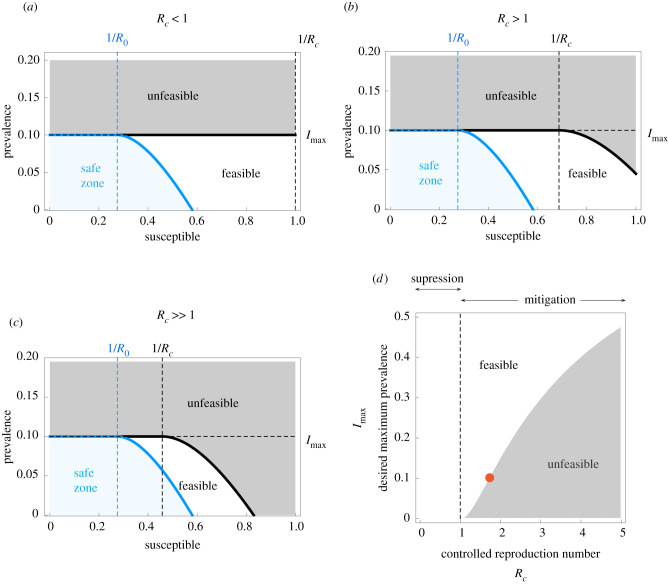
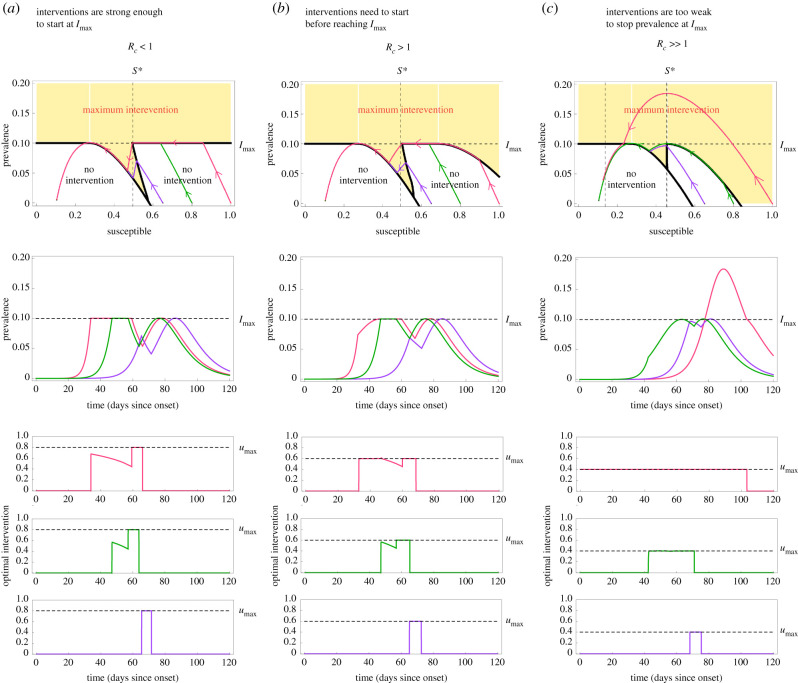
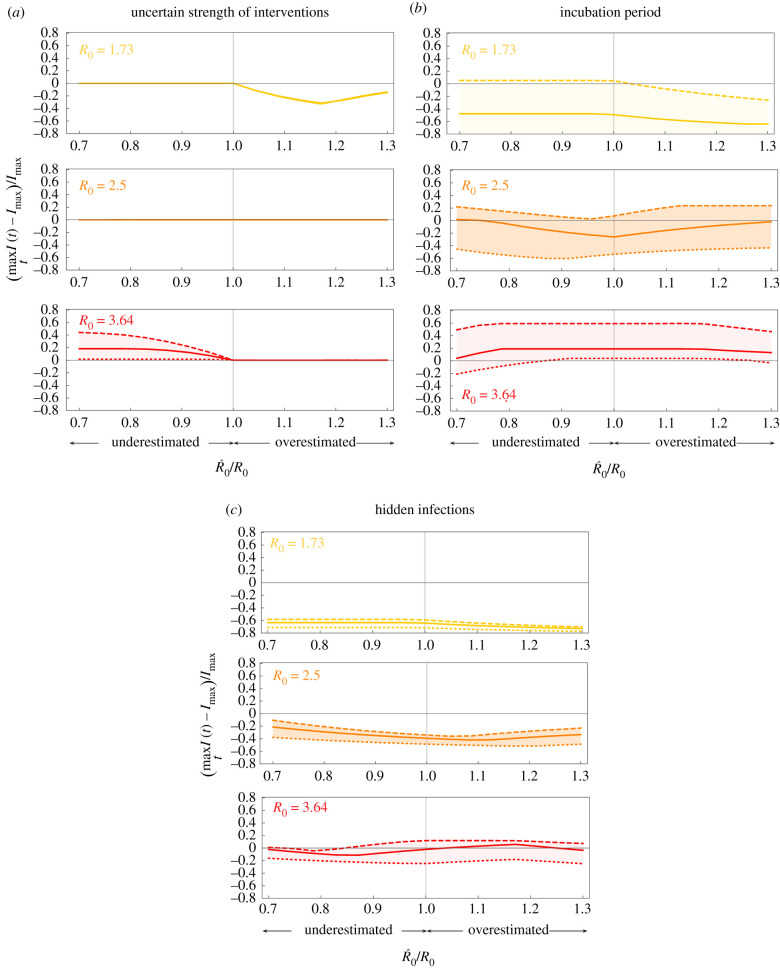
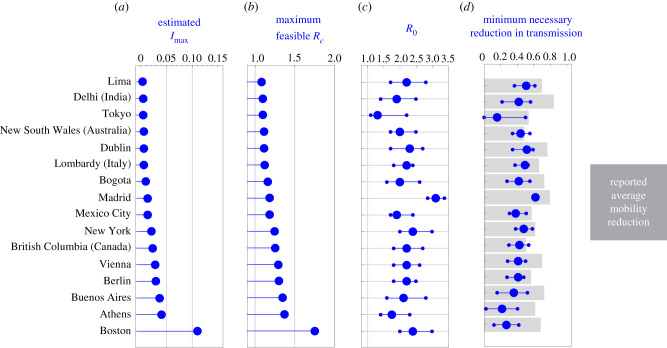
For mitigating the COVID-19 pandemic, much emphasis is made on implementing non-pharmaceutical interventions to keep the reproduction number below one. However, using that objective ignores that some of these interventions, like bans of public events or lockdowns, must be transitory and as short as possible because of their significant economic and societal costs. Here, we derive a simple and mathematically rigorous criterion for designing optimal transitory non-pharmaceutical interventions for mitigating epidemic outbreaks. We find that reducing the reproduction number below one is sufficient but not necessary. Instead, our criterion prescribes the required reduction in the reproduction number according to the desired maximum of disease prevalence and the maximum decrease of disease transmission that the interventions can achieve. We study the implications of our theoretical results for designing non-pharmaceutical interventions in 16 cities and regions during the COVID-19 pandemic. In particular, we estimate the minimal reduction of each region's contact rate necessary to control the epidemic optimally. Our results contribute to establishing a rigorous methodology to design optimal non-pharmaceutical intervention policies for mitigating epidemic outbreaks.

Keywords: COVID-19; epidemic outbreak; non-pharmaceutical interventions; optimal control.


Figures

Figure 1.
Figure 1.
Optimal non-pharmaceutical interventions. (a) Susceptible–Infected–Removed (SIR) model with non-pharmaceutical interventions (NPIs) reducing disease transmission. For the optimal NPI design problem, the objective is to design the intervention u*(t) with minimal effective duration such that u*(t) ∈ [0, umax] and I(t) ≤ Imax for all t ≥ 0. (b,c) The response of the SIR model for two interventions (parameters are β = 0.52, γ = 1/7, I0 = 8.855 × 10⁻⁷ and S0 = 1 − I0). Both interventions 1 and 2 satisfy u(t) ≤ umax and guarantee that I(t) ≤ Imax. Actually, intervention 2 is the optimal one derived using our analysis: it is the intervention with minimal effective duration satisfying I(t) ≤ Imax. (d) The effective duration of an intervention measures the interval between the start of the outbreak and the last time that a non-zero intervention is applied. In this example, the effective duration of intervention 1 is 120 days, while the effective duration of intervention 2 is 69 days.
Figure 2.
Figure 2.
Existence of non-pharmaceutical interventions in the Susceptible–Infected–Removed model. Parameters are γ = 1/7, β = 0.52 (i.e. R0 = 3.64) and Imax = 0.1. The safe zone (in blue) consists of all states that do not exceed Imax without interventions. This zone is characterized by the inequality IΦR0(S). The plane is further divided into feasible states that can reach the safe zone without exceeding Imax (white), and unfeasible states that cannot (grey). Feasible and unfeasible states are separated by the separating curve ΦRc(S) (black line). (a) For ‘strong’ interventions with umax = 0.8, the controlled reproduction number is Rc = (1 − umax)R0 = 0.728 < 1. Here, the separating curve is the straight line Imax, implying that all states below Imax are feasible. Note this case corresponds to eradication. (b) For ‘intermediate’ interventions with umax = 0.6, the controlled reproduction number is Rc = (1 − umax)R0 = 1.456 > 1. Here, the separating curve ΦRc(S) is nonlinear, and some states below Imax are unfeasible. (c) For ‘weak’ interventions with umax = 0.4 we obtain Rc = 2.184 > 1. In this case, states with S(0) ≈ 1 are unfeasible. (d) For S(0) → 1, our design criterion for NPIs prescribes the values of Rc that a given Imax can manage.
Figure 3.
Figure 3.
Optimal non-pharmaceutical interventions in the Susceptible–Infected–Removed model. For all panels, the parameters of the SIR model are γ = 1/7, β = 0.52 (i.e. R0 = 3.64) and Imax = 0.1. We consider a population of N = 8.855 × 10⁶ individuals (like in Mexico City) and I0 = 1/N. Panels shows trajectories for three initial proportions of the susceptible population: large S0 = 1 − I0 ≈ 1 (pink), medium S0 = 0.8 (green) and small S0 = 0.65 (purple). (a) For umax = 0.8, we have Rc = (1 − umax)R0 = 0.728 ≤ 1. In this case, the optimal intervention starts when the disease prevalence reaches Imax. Afterwards, the intervention decreases in a hyperbolic arc until reaching the point S = S*. At that time, the intervention becomes maximum in the ‘final push’ to reach the safe zone. (b) For umax = 0.58, the controlled reproduction number is Rc = (1 − umax)R0 = 1.52 > 1. Here, ΦRc(1)>0, implying that the epidemic still can be mitigated for initial states with S0 ≈ 1 and I0 ≈ 0 (pink trajectory). In this case, the optimal intervention starts when the initial condition hits the separating curve below Imax at t = 35. At that instant, the intervention starts with the maximum value umax, and continues in that form until the trajectory reaches Imax. (c) Choosing umax = 0.4 yields Rc = 2.184 > 1. In this case, the optimal intervention problem does not have a solution for all initial states S0 > 0.85. This is illustrated by pink trajectory: even when applying the maximum intervention from the start, I(t) will grow beyond Imax.
Figure 4.
Figure 4.
Optimal non-pharmaceutical interventions are robust. For all panels, the estimated parameters used for constructing the optimal NPIs are γ^=1/7, β^=0.52, Imax = 0.1, umax = 0.6. We consider a population of N = 8.855 × 10⁶ as in Mexico City, and the initial conditions I(0) = 1/N and S(0) = 1 − 1/N. If the models contain other state variables, they were initialized at zero. The optimal NPIs are constructed assuming R^0=β^/γ^, while the actual epidemic dynamics has a possibly different R0 = β/γ. Panels show results for outbreaks with three values of R0: low (yellow), medium (orange) and large (red). (a) SIR model where the reduction in the disease transmission by the NPIs is uncertain. We model this case replacing u by ku in the model equations. Panel shows the results for k = 1.1 (dotted), k = 1 (solid) and k = 0.9 (dashed). (b) SEIR model where exposed individuals do not transmit the infection, with λ > 0 the incubation period. Panel shows the results for λ = 1/5 (dotted), λ = 1/7 (solid) and λ = 1/11 (dashed). (c) SEIIR model with λ = 1/7 and two classes of infected individuals (symptomatic and asymptomatic). Here, p ∈ [0, 1] is the proportion of exposed individuals that become asymptomatic. The vertical axis denotes the disease prevalence for symptomatic individuals. The panel shows the results for p = 0.55 (dotted), p = 0.7 (solid) and p = 0.8 (dashed).
Figure 5.
Figure 5.
Minimum necessary reduction in disease transmission for NPIs in the COVID-19 pandemic. (a) Calculated Imax according to the proportion of available intensive care beds in each region or city and the estimated fraction of infected individuals requiring intensive care. (b) Maximum controlled reproduction number Rc that each region or city can handle according to its Imax. Larger Imax allows a larger Rc. (c) Basic reproduction number R0 per region or city before interventions started. Median (blue big dot), and 95% confidence interval (smaller dots) are shown. (d) Minimum umax necessary for feasibility for each region or city (blue) according to the R0 of (c). Grey bars denote the reported average mobility reduction in each region between 19 March and 30 April 2020.

References

    1. Anderson RM, May RM. 1985. Vaccination and herd immunity to infectious diseases. Nature 318, 323-329. (10.1038/318323a0) - DOI - PubMed
    1. Anderson RM, May RM. 1992. Infectious diseases of humans: dynamics and control. Oxford, UK: Oxford University Press.
    1. Fraser C, Riley S, Anderson RM, Ferguson NM. 2004. Factors that make an infectious disease outbreak controllable. Proc. Natl Acad. Sci. USA 101, 6146-6151. (10.1073/pnas.0307506101) - DOI - PMC - PubMed
    1. Kupferschmidt K. 2020. Ending coronavirus lockdowns will be a dangerous process of trial and error. Science—AAAS. (10.1126/science.abc2507) - DOI
    1. Ferguson NM, Cummings DA, Fraser C, Cajka JC, Cooley PC, Burke DS. 2006. Strategies for mitigating an influenza pandemic. Nature 442, 448-452. (10.1038/nature04795) - DOI - PMC - PubMed

Publication types

LinkOut - more resources