. 2021 May 11;19(1):99.
doi: 10.1186/s12915-021-01043-y.

MATISSE: a method for improved single cell segmentation in imaging mass cytometry

Affiliations

MATISSE: a method for improved single cell segmentation in imaging mass cytometry

Matthijs J D Baars et al. BMC Biol. .

Erratum in

Abstract

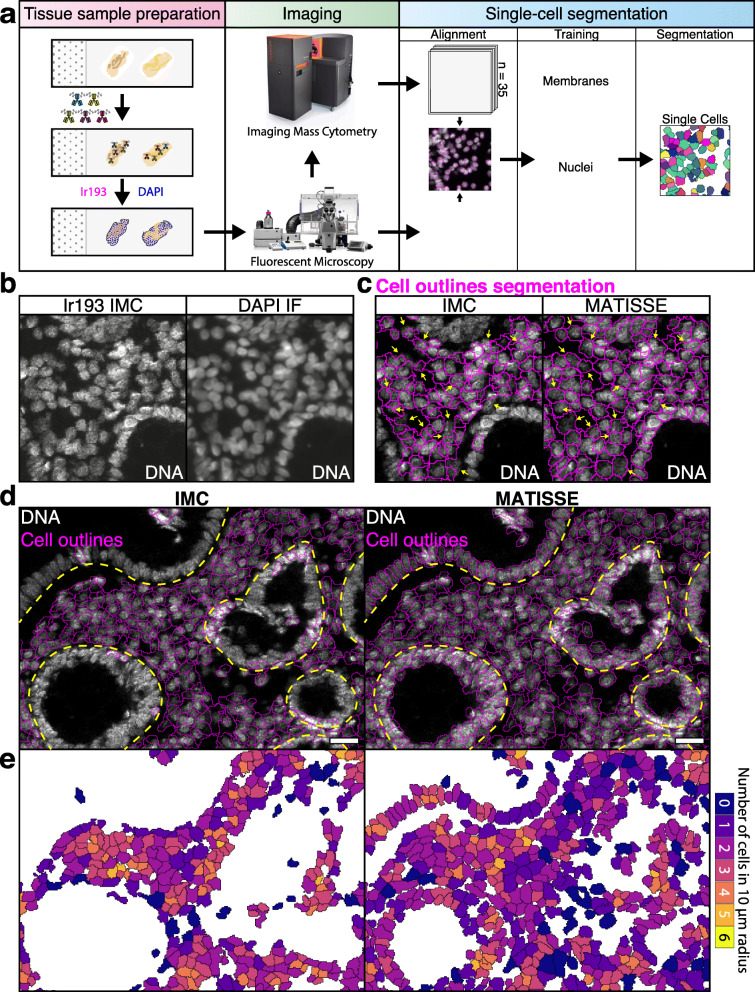
Background: Visualizing and quantifying cellular heterogeneity is of central importance to study tissue complexity, development, and physiology and has a vital role in understanding pathologies. Mass spectrometry-based methods including imaging mass cytometry (IMC) have in recent years emerged as powerful approaches for assessing cellular heterogeneity in tissues. IMC is an innovative multiplex imaging method that combines imaging using up to 40 metal conjugated antibodies and provides distributions of protein markers in tissues with a resolution of 1 μm2 area. However, resolving the output signals of individual cells within the tissue sample, i.e., single cell segmentation, remains challenging. To address this problem, we developed MATISSE (iMaging mAss cyTometry mIcroscopy Single cell SegmEntation), a method that combines high-resolution fluorescence microscopy with the multiplex capability of IMC into a single workflow to achieve improved segmentation over the current state-of-the-art.

Results: MATISSE results in improved quality and quantity of segmented cells when compared to IMC-only segmentation in sections of heterogeneous tissues. Additionally, MATISSE enables more complete and accurate identification of epithelial cells, fibroblasts, and infiltrating immune cells in densely packed cellular areas in tissue sections. MATISSE has been designed based on commonly used open-access tools and regular fluorescence microscopy, allowing easy implementation by labs using multiplex IMC into their analysis methods.

Conclusion: MATISSE allows segmentation of densely packed cellular areas and provides a qualitative and quantitative improvement when compared to IMC-based segmentation. We expect that implementing MATISSE into tissue section analysis pipelines will yield improved cell segmentation and enable more accurate analysis of the tissue microenvironment in epithelial tissue pathologies, such as autoimmunity and cancer.

Keywords: Colorectal tissue; Imaging mass cytometry; Immune histochemistry; Microscopy; Single cell segmentation.


Conflict of interest statement

The authors have no competing interests to declare

Figures

Fig. 1
Fig. 1
Combining fluorescence microscopy with multiplex IMC data of colorectal tissue advances quality of single cell segmentation. a Cartoon describing MATISSE, a novel pipeline adding microscopic imaging to multiplex IMC analysis and downstream segmentation. In short: tissue sections on slides were stained using isotope-conjugated primary antibodies, DNA intercalator, and DAPI. The tissue was first scanned using a fluorescent microscope and then processed with IMC. Data produced by both techniques is aligned using the nuclear staining. Nuclear and membranous pixel probability maps are produced based on the fluorescent images and IMC data respectively. These probability maps are used to generate a segmentation map, where all detected cells are included. b Representative images of DNA intercalator on a colorectal tissue section analyzed by Ir193 labeling and IMC (left) or DAPI labeling and fluorescent microscopy (IF, right). c IMC-only (IMC) and MATISSE cell segmentation (MATISSE) were performed, and shown are the different predicted outlines on a representative image of Ir193 labeling. Arrows indicate areas with cell fragmentation. d Display of a large region of interest (ROI) showing an overlay of the predicted cell outlines (pink) upon IMC or MATISSE segmentation on a representative IMC image of DNA-Ir193 labeling of colorectal tissue. Highlighted in yellow is the approximate position of the basement membrane surrounding the epithelial monolayer. Scale bar 25 μm. e Cell density was calculated as the number of cells within a radius of 10 μM from the center of each single cell [9, 10]. This number is displayed with a color code for each cell in the representative image
Fig. 2
Fig. 2
MATISSE segmentation promotes both cell identification quantity and quality. a Numbers of cells were quantified using IMC and MATISSE segmentation methods for all analyzed regions of interest (ROIs). Lines link the datapoints per ROI. Paired t test was performed to test for significance. ****p < 0.0001. N = 45 images. b, c Overlap between manual annotations and predictions was quantified by recall score and b compared for MATISSE and IMC at varying intersection-over-union (IOU) thresholds, c displayed per ROI at IOU 0.6 and higher, lines link datapoints per ROI. Paired t test was performed to test for significance. ****p < 0.0001. N = 30 images. d Representative image of IOU values indicated by a color-scale labeling of the annotated events (red lining) that overlap with predictions by IMC or MATISSE. Black lines indicate outlines of the predictions. Scale bar 25 μm. e Fraction of split annotated events were quantified using IMC and MATISSE segmentation methods for all ROIs, lines link the datapoints per ROI. Paired t test was performed to test for significance. ****p < 0.0001. N = 30 images. f Edge intersection score per ROI was determined by quantifying intersection of predicted cell outlines by both methods with manually annotated nuclei, where a lower score corresponds to less overlap. Lines link the datapoints per ROI. Paired t-test was performed to test for significance. ****p < 0.0001. N = 30 images
Fig. 3
Fig. 3
MATISSE improves identification of specific cell subsets in colorectal tissue. a Forty-five regions of interest (ROIs) in 10 different tissue sections were imaged and segmented using IMC or MATISSE pipelines, and 10% of all identified single cells were included in a t-SNE. Twenty-six phenoclusters [16] were identified and displayed with a color-code. N = 29242 cells for IMC, 38430 cells for MATISSE. b Numbers of cells contained per cluster were calculated and displayed for both IMC and MATISSE methods. N = 45 images. N = 291919 cells for IMC, 384804 cells for MATISSE. c Heatmap display of the mean signal intensity per cell in each cluster. The ratio of number of cells identified by both segmentation methods (IMC / MATISSE) per cluster is displayed on the right. N = 45 images. d, e Spatial location of single cells in the tissue was visualized and color-coded by phenocluster. Displayed are overview images of an entire ROI (left) and a zoom of a specific region (right), shown are all phenoclusters (d), top 6 differential phenoclusters with higher cell numbers in MATISSE (e). Scale bar 25 μm

References

    1. Binnewies M, Roberts EW, Kersten K, Chan V, Fearon DF, Merad M, et al. Understanding the tumor immune microenvironment (TIME) for effective therapy. Nat Med. 2018;24(5):541–550. doi: 10.1038/s41591-018-0014-x. - DOI - PMC - PubMed
    1. Tsujikawa T, Kumar S, Borkar RN, Azimi V, Thibault G, Chang YH, et al. Quantitative multiplex immunohistochemistry reveals myeloid-inflamed tumor-immune complexity associated with poor prognosis. Cell Rep. 2017;19(1):203–217. doi: 10.1016/j.celrep.2017.03.037. - DOI - PMC - PubMed
    1. Amaria RN, Reddy SM, Tawbi HA, Davies MA, Ross MI, Glitza IC, et al. Neoadjuvant immune checkpoint blockade in high-risk resectable melanoma. Nat Med. 2018;24(11):1649–1654. doi: 10.1038/s41591-018-0197-1. - DOI - PMC - PubMed
    1. Angelo M, Bendall SC, Finck R, Hale MB, Hitzman C, Borowsky AD, et al. Multiplexed ion beam imaging of human breast tumors. Nat Med. 2014;20(4):436–442. doi: 10.1038/nm.3488. - DOI - PMC - PubMed
    1. Giesen C, Wang HA, Schapiro D, Zivanovic N, Jacobs A, Hattendorf B, et al. Highly multiplexed imaging of tumor tissues with subcellular resolution by mass cytometry. Nat Methods. 2014;11(4):417–422. doi: 10.1038/nmeth.2869. - DOI - PubMed

Publication types