. 2021 Jul 1;81(13):3649-3663.
doi: 10.1158/0008-5472.CAN-20-1799. Epub 2021 May 11.

Phenotypic Heterogeneity and Metastasis of Breast Cancer Cells

Affiliations

Phenotypic Heterogeneity and Metastasis of Breast Cancer Cells

Lauren A Hapach et al. Cancer Res. .

Abstract

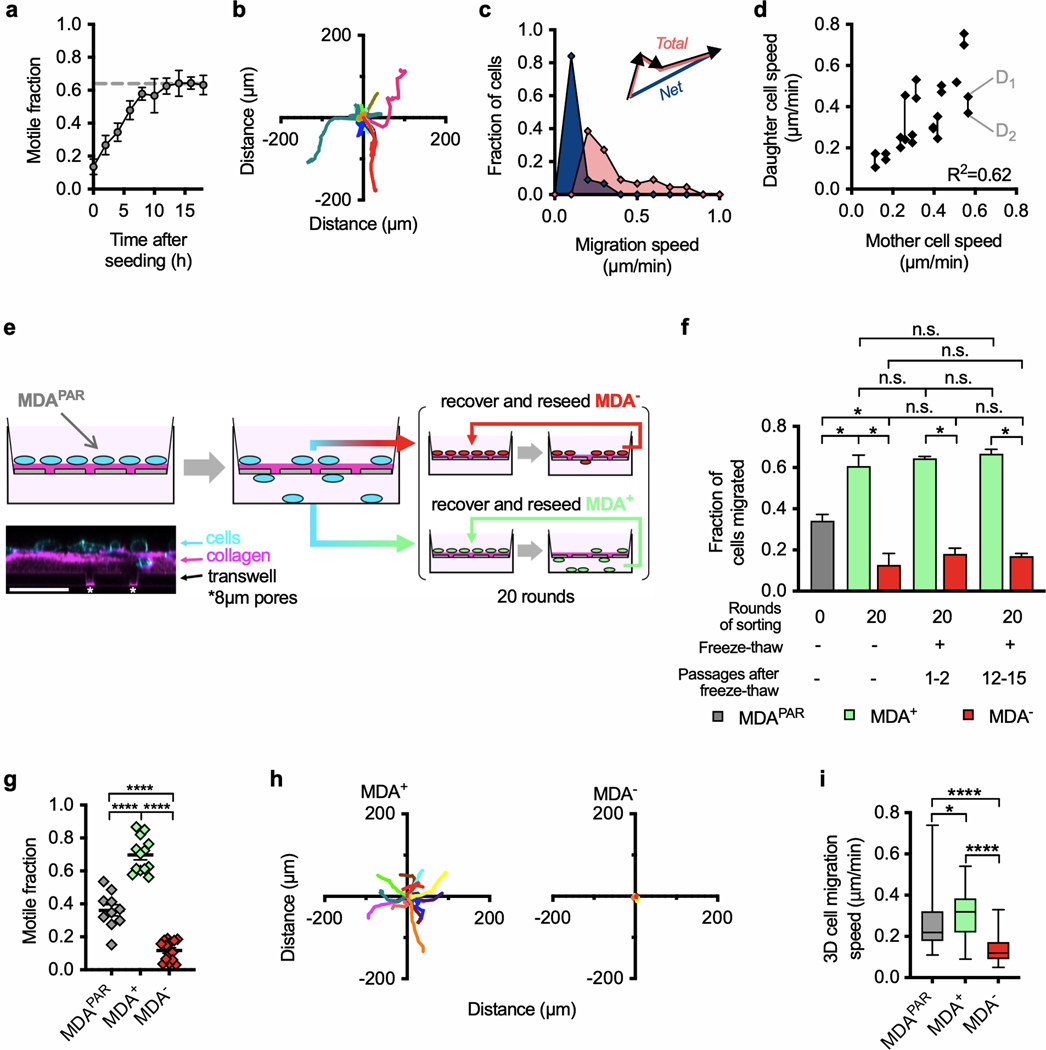
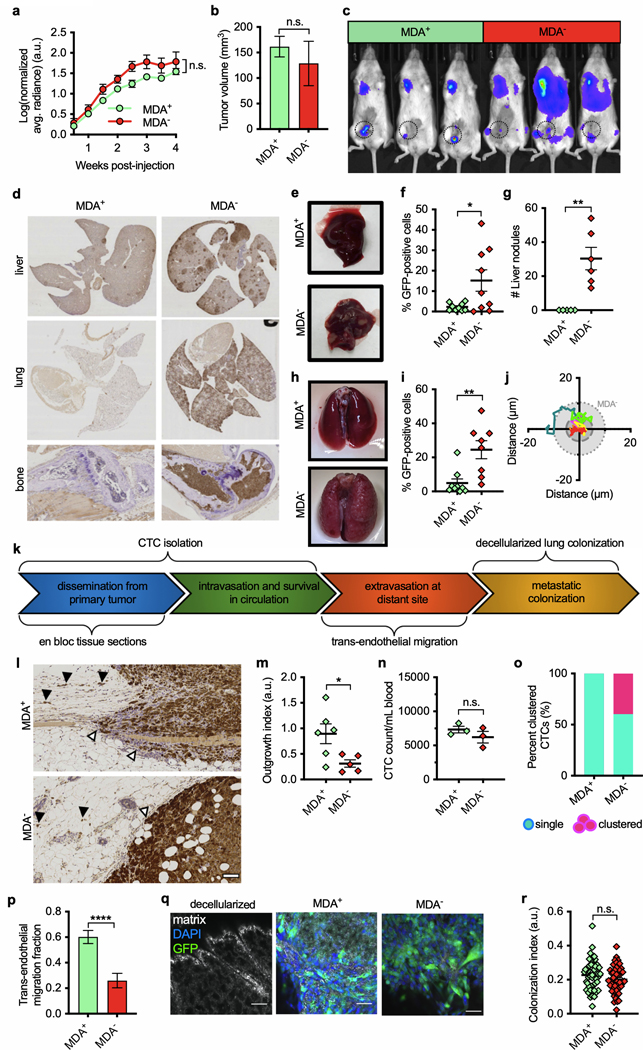
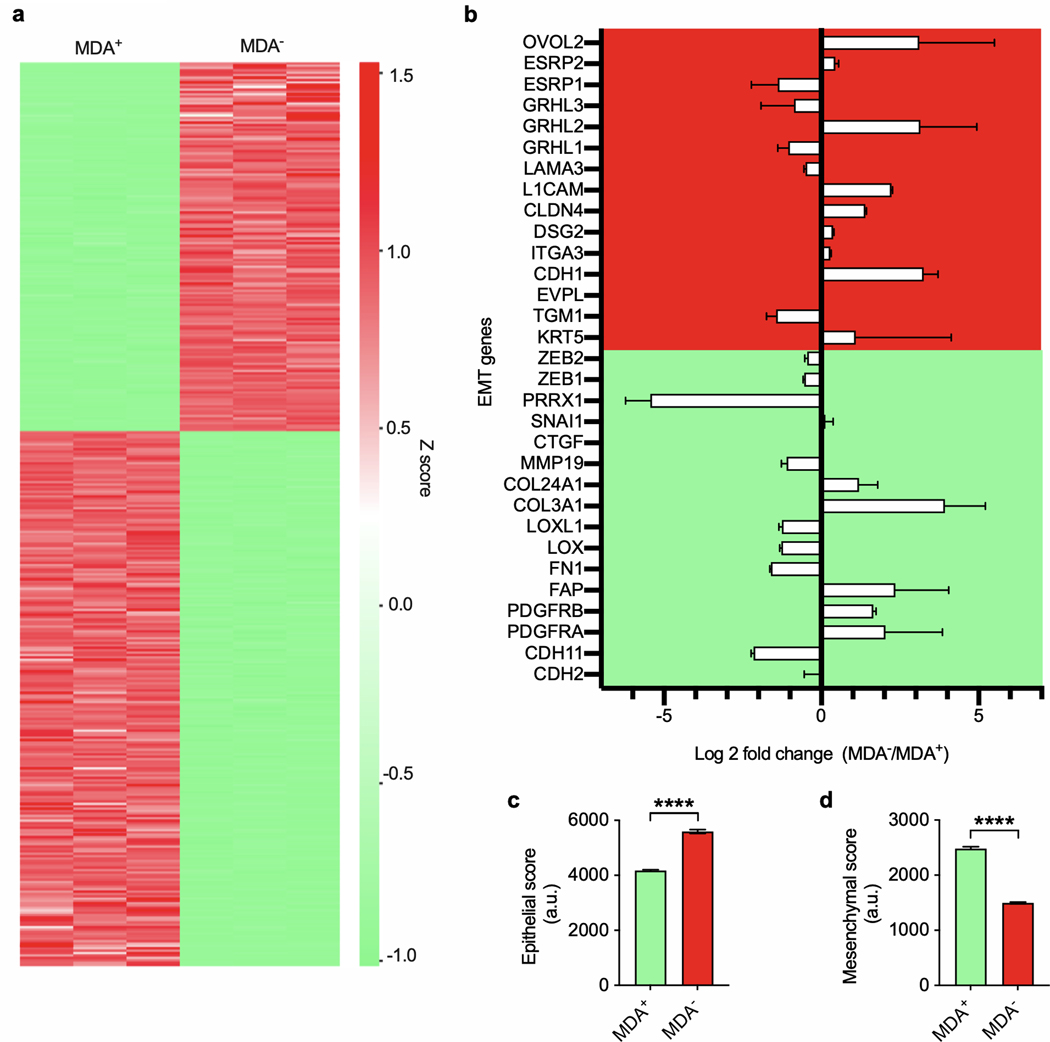
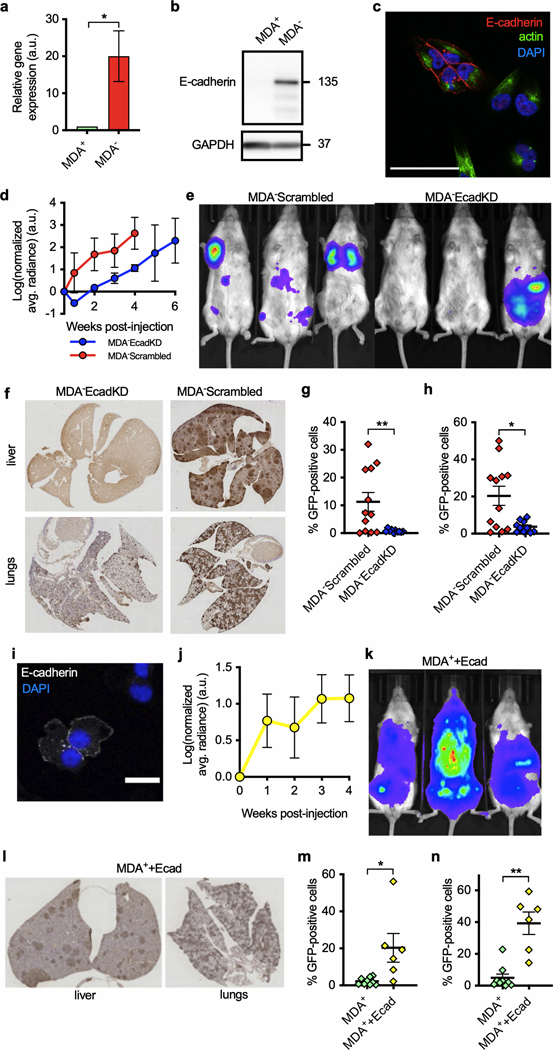
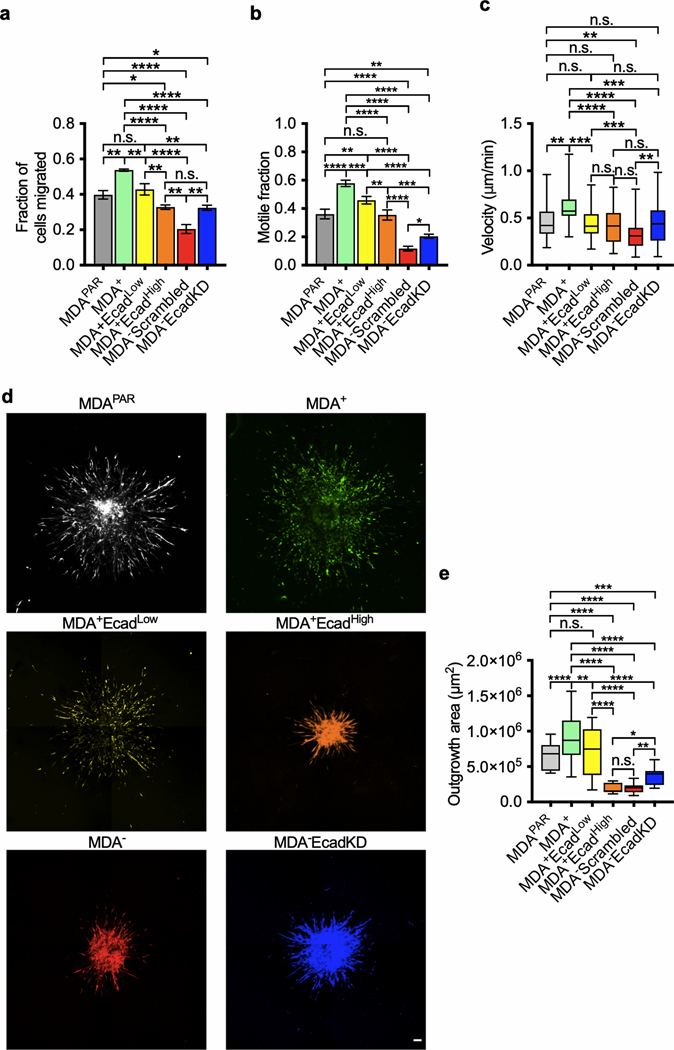
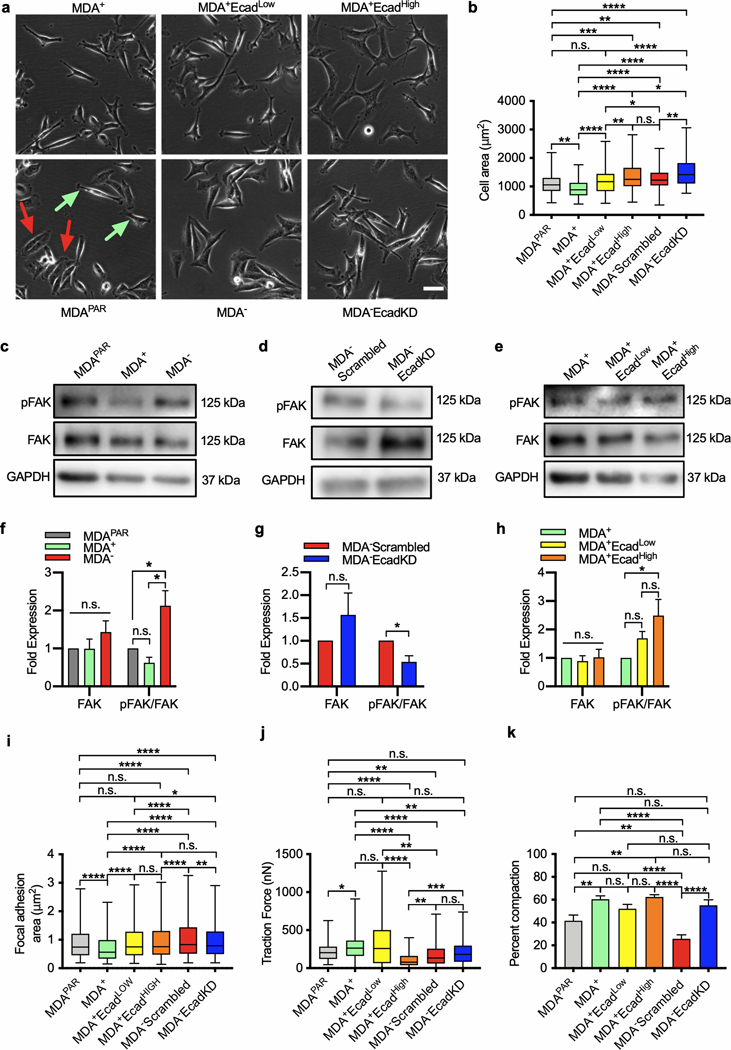
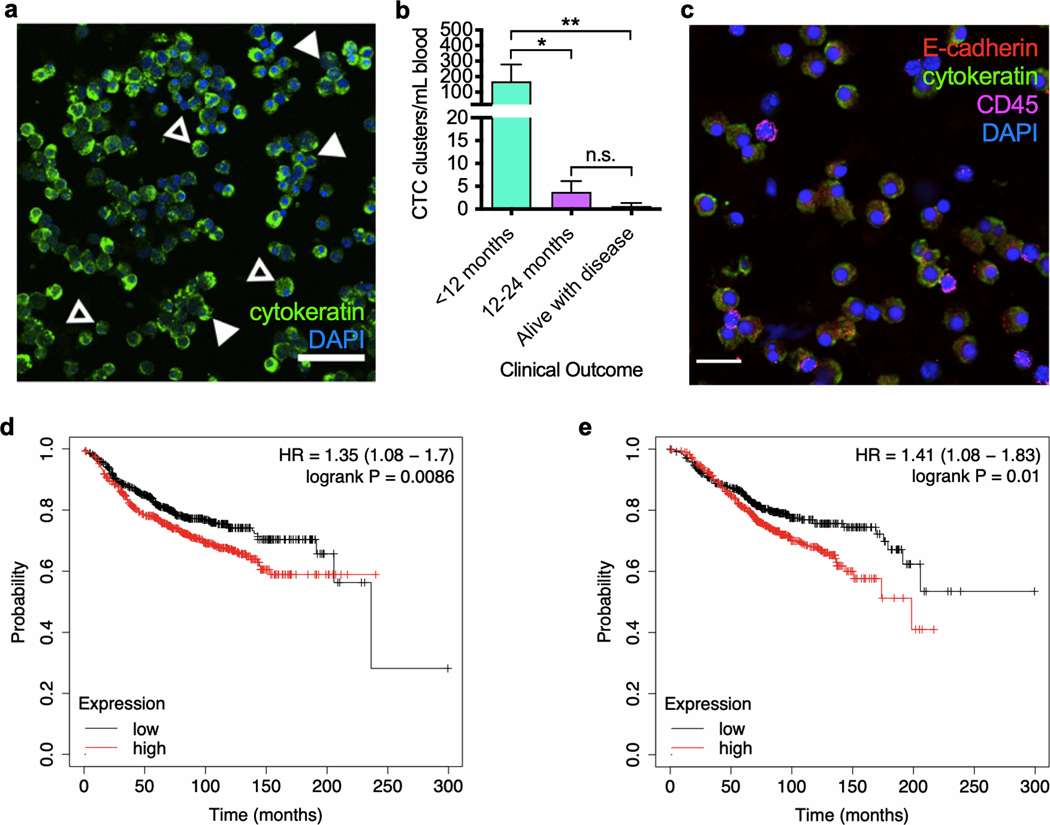
Although intratumoral genomic heterogeneity can impede cancer research and treatment, less is known about the effects of phenotypic heterogeneities. To investigate the role of cell migration heterogeneities in metastasis, we phenotypically sorted metastatic breast cancer cells into two subpopulations based on migration ability. Although migration is typically considered to be associated with metastasis, when injected orthotopically in vivo, the weakly migratory subpopulation metastasized significantly more than the highly migratory subpopulation. To investigate the mechanism behind this observation, both subpopulations were assessed at each stage of the metastatic cascade, including dissemination from the primary tumor, survival in the circulation, extravasation, and colonization. Although both subpopulations performed each step successfully, weakly migratory cells presented as circulating tumor cell (CTC) clusters in the circulation, suggesting clustering as one potential mechanism behind the increased metastasis of weakly migratory cells. RNA sequencing revealed weakly migratory subpopulations to be more epithelial and highly migratory subpopulations to be more mesenchymal. Depletion of E-cadherin expression from weakly migratory cells abrogated metastasis. Conversely, induction of E-cadherin expression in highly migratory cells increased metastasis. Clinical patient data and blood samples showed that CTC clustering and E-cadherin expression are both associated with worsened patient outcome. This study demonstrates that deconvolving phenotypic heterogeneities can reveal fundamental insights into metastatic progression. More specifically, these results indicate that migratory ability does not necessarily correlate with metastatic potential and that E-cadherin promotes metastasis in phenotypically sorted breast cancer cell subpopulations by enabling CTC clustering. SIGNIFICANCE: This study employs phenotypic cell sorting for migration to reveal a weakly migratory, highly metastatic breast cancer cell subpopulation regulated by E-cadherin, highlighting the dichotomy between cancer cell migration and metastasis.


Conflict of interest statement

Conflict of Interest: The authors declare no potential conflicts of interest.

Figures

Figure 1.
Figure 1.
Heterogeneity of MDA-MB-231 human cancer cell migratory capability is heritable and can be sorted based on migration behavior using an in vitro transwell migration assay. a) Fraction of motile MDA-MB-231 cells following seeding in 1.5 mg/mL collagen matrix. Dashed line indicates maximal motile fraction achieved by steady state. b) Single-cell migration paths and c) total and net cell migration speeds over 8 h. d) Correlation of total cell migration speed before and after mitosis. Each pair of daughter cells, D1 and D2, is connected by a vertical line, and the average daughter cell speed was used to determine correlation (R2 = 0.62). e) Schematic of migration cell sorting technique. f) Fraction of cells migrated through transwell assay for indicated populations after 4 days. g) Motile fraction of MDA-MB-231 subpopulations and parental cells. h) Single-cell migration paths of MDA-MB-231 subpopulations. i) Migration speeds of MDA-MB-231 subpopulations and MDA-MB-231 parental cells after seeding in 1.5 mg/mL collagen matrix. Data in (a), (f), and (g) display mean ± SEM. Statistical significance in (f) was calculated using one-way ANOVA (n = 3,4,4). Statistical significance in (g) was calculated using one-way ANOVA (n = 10,13,14). In (i), box and whisker plot show medians, 25th/75th, and minimum and maximum values. Statistical significance in (i) was calculated using a Kruskal-Wallis H test (n = 34,41,28). * p < 0.05, **** p < 0.0001, n.s., non-significant.
Figure 2.
Figure 2.
Phenotypically sorted subpopulations show differential metastatic potentials in vivo. a) Primary tumor growth quantified by bioluminescence imaging using log(normalized average radiance) (n = 4). b) Primary tumor volume as measured by calipers (n = 3). c) Endpoint image showing metastasis via bioluminescence imaging. d) Representative images of anti-GFP immunohistochemical (IHC) staining of lung, liver, and bone samples counterstained with hematoxylin. e) Representative images of livers collected at study endpoint and f) quantification of percentage of GFP-positive cells in liver anti-GFP IHC sections (n = 9). g) Quantification of metastatic liver nodules at study endpoint (n = 5,6). h) Representative images of lungs at study endpoint. i) Quantification of GFP-positive cells measured via IHC of lung histological sections (n = 8,9). j) Representative migration traces of MDA cells seeded in 1.5 mg/mL collagen after isolation from lungs of mice at 4 weeks post injection. Dark grey dashed line represents average distance migrated from MDA cells in vitro with light grey dotted line representing standard deviation. k) Schematic of stages of the metastatic cascade assessed by each experiment. l) Anti-GFP IHC staining of en bloc tumor sections; white arrow indicates local spread at the primary tumor periphery; black arrows indicate cell migration into the stroma. m) Quantification of outgrowth index to assess local dissemination in en bloc histology (n = 6,5). n) Quantification of circulating tumor cells (CTCs) per mL blood in orthotopically injected mice after 4 weeks (n = 3). o) Percentage of clustering of CTCs in mouse blood at 4 weeks (n = 3). p) Relative trans-endothelial migration fraction of MDA-MB-231 subpopulations (n = 3). q) Representative images of ex vivo lung decellularization colonization assay for MDA-MB-231 subpopulations imaged 9 d post-seeding using confocal reflectance and immunofluorescence; GFP-tagged cells: green, nuclei: blue, extracellular matrix: white; Scale bars: 50 μm. r) Quantification of colonization index in ex vivo lung tissue at 9 d post-seeding (n = 50). Data in (a), (b), (f), (g), (i), (m), (n), (p) and (r) display mean ± SEM. Statistical significance in (a) was calculated using multiple t-tests. Statistical significance in (b), (f), (g), (m), (n), (p) and (r) were calculated using unpaired, two-tailed Student t-tests. Statistical significance in (i) was calculated using a Mann-Whitney test. * p < 0.05, ** p < 0.01., **** p < 0.0001, n.s., non-significant.
Figure 3.
Figure 3.
RNA sequencing reveals differential EMT gene regulation in phenotypically sorted subpopulations. a) RNAseq Z score heatmap showing differential gene regulation of MDA+ and MDA subpopulations (n = 3). b) Log 2 fold change of MDA/MDA+ epithelial-to-mesenchymal transition genes (n = 3). c) Epithelial and d) mesenchymal scores for MDA+ and MDA subpopulations (n = 3). Data in (b), (c), and (d) display mean ± SEM. Statistical significance in (c) and (d) was calculated using unpaired, two-tailed Student t-tests. **** p < 0.0001.
Figure 4.
Figure 4.
E-cadherin expression is necessary for metastasis in phenotypically sorted subpopulations. a) qPCR of E-cadherin in MDA-MB-231 subpopulations normalized to MDA+ cells (n = 3). b) Western blot of E-cadherin and GAPDH in subpopulations. c) Immunofluorescence staining of E-cadherin expression in MDA cells. Scale bar: 25 μm. d) Primary tumor growth of MDA E-cadherin knockdown and scrambled control tumors monitored via bioluminescence imaging (BLI) (n = 3). e) End point BLI of scrambled and E-cadherin knockdown mice at 4 weeks post tumor removal. f) Representative images of lung and liver histological sections stained with anti-GFP IHC. Quantification of percentage of GFP-positive cells in g) liver (n = 10,12) and h) lung (n = 10,12) histological sections. i) Immunofluorescence staining of E-cadherin expression in MDA+ + E-cadherin cells. Scale bar: 20 μm. j) Primary tumor growth of MDA+ + E-cadherin tumors monitored via BLI (n = 6). k) End point BLI of MDA+ + E-cadherin mice at 4 weeks post tumor removal l) Representative image of lungs and livers histological sections stained with anti-GFP IHC. Quantification of percentage of GFP-positive cells in m) liver (n = 6,9) and n) lung (n = 6,9) IHC-stained tissue sections. Data in (a), (d), (g), (h), (j), (m), and (n) display mean ± SEM. Statistical significance for (a), (g), and (h) was calculated using an unpaired, two-tailed Student’s t-test. Statistical significance for (m) and (n) was calculated using a Mann-Whitney test. *p < 0.05, **p < 0.01.
Figure 5.
Figure 5.
E-cadherin expression tunes migration ability and mode in phenotypically sorted subpopulations. a) Fraction of cells migrated for MDA subpopulations with and without E-cadherin in transwell assays (n = 3). b) Motile fraction of MDA subpopulations with and without E-cadherin in 1.5mg/mL 3D collagen (n = 10–35). c) Microtrack migration speeds for MDA-MB-231 subpopulations with and without E-cadherin (n = 30–36). d) Representative images of tumor spheroid outgrowth at 48 h post-embedding. Scale bar: 100 μm e) Outgrowth area to quantify cell migration from in vitro tumor spheroids made from MDA-MB-23 subpopulations with and without E-cadherin embedded in 1.5 mg/mL 3D collagen matrix at 48 h. Data from (a) and (b) display mean ± SEM. The box and whisker plot in (c) and (e) shows medians, 25th/75th percentiles, and minimum and maximum values. Statistical significance for (a) and (b) was calculated using an ordinary, one-way ANOVA. Statistical significance for (c) and (e) was calculated using a Kruskal Wallis H test. Statistical significance for (f) was calculated using an unpaired, two-tail Student’s t-test. * p < 0.05, ** p < 0.01, *** p < 0.001, **** p < 0.0001, n.s., non-significant.
Figure 6.
Figure 6.
Subpopulations exhibit differential morphologies, cell-ECM signaling, and contractility. a) Representative two-dimensional morphologies with red arrows pointing to parental cells with weakly motile-like morphologies and the green arrows pointing to parental cells with strongly motile-like morphologies; Scale bar: 50 μm. b) Quantification of cell area for subpopulations with and without E-cadherin. c) Western blot of pFAK, FAK, and GAPDH for MDAPAR, MDA+, and MDA. d) Western blot of pFAK, FAK, and GAPDH for MDA control and MDAEcadKD. e) Western blot of pFAK, FAK, and GAPDH for MDA+, MDA+EcadLow, and MDA+EcadHigh. f) Quantification of FAK expression and activation from Western blot in (c) (n = 3). g) Quantification of FAK expression and activation from Western blot in (d) (n = 3). h) Quantification of FAK expression and activation from Western blot in (e) (n = 3). i) Quantification of focal adhesion area for subpopulations with and without E-cadherin. j) Total traction force magnitude, |F|, of MDA-MB-231 subpopulations with and without E-cadherin (n = 51–129). k) Percentage of bulk collagen matrix contraction for collagen gels seeded with MDA-MB-231 subpopulations with and without E-cadherin after 4 days (n = 4–14). Data from (f), (g), (h) and (k) display mean ± SEM. The box and whisker plots in (b), (i), and (j) shows medians, 25th/75th and minimum and maximum values. Statistical significance for (b), (i), and (j) were calculated using a Kruskal-Wallis H test. Statistical significance for (f), (h), and (k) were calculated using an ordinary, one-way ANOVA. Statistical significance for (g) was calculated using an unpaired, two-tailed Student’s t-test. * p < 0.05, ** p < 0.01, *** p < 0.001, **** p < 0.0001, n.s. non-significant.
Figure 7.
Figure 7.
Circulating tumor cell clusters and E-cadherin expression trend with worsened patient outcome. a) Representative image of circulating tumor cells (CTCs) from human cancer patient blood stained for cytokeratin (green) and DAPI (blue); filled arrows denote CTC clusters while empty arrows denote single CTCs. Scale bar: 50 μm. b) Quantification of CTC cluster concentration from blood isolated from 11 metastatic cancer patients binned by patient survival time. c) Representative image of CTCs isolated from metastatic breast cancer patient blood with E-cadherin (red), cytokeratin (green), CD45 (magenta), and DAPI (blue) staining. Scale bar: 20 μm. Kaplan-Meier curve depicting d) distal metastasis free survival (DMFS) and e) overall survival (OS) of upper and lower terciles of breast cancer patients divided by E-cadherin mRNA expression in the primary tumor. n = 1803 for (d) and n = 1402 for (e). Data in (b) display mean ± SEM. Significance was determined by a Kruskall-Wallis H test for (b). * p < 0.05, ** p < 0.01, n.s. non-significant.

References

    1. Zardavas D, Irrthum A, Swanton C, Piccart M. Clinical management of breast cancer heterogeneity. Nat Rev Clin Oncol. 2015;12:381–94. - PubMed
    1. Yang F, Wang Y, Li Q, Cao L, Sun Z, Jin J, et al. Intratumor heterogeneity predicts metastasis of triplenegative breast cancer. Carcinogenesis. 2017;38:900–9. - PubMed
    1. Turajlic S, Swanton C. Metastasis as an evolutionary process. Science. 2016;352:169–75. - PubMed
    1. Lin JMG, Kang CC, Zhou Y, Huang H, Herr AE, Kumar S. Linking invasive motility to protein expression in single tumor cells. Lab Chip. 2018;18:371–84. - PMC - PubMed
    1. Hapach LA, Mosier JA, Wang W, Reinhart-King CA. Engineered models to parse apart the metastatic cascade. npj Precis Oncol 2019;3:20. - PMC - PubMed

Publication types

MeSH terms