. 2021 Aug;70(8):1738-1753.
doi: 10.2337/db20-1268. Epub 2021 May 11.

Tribbles Homolog 3 Mediates the Development and Progression of Diabetic Retinopathy

Affiliations

Tribbles Homolog 3 Mediates the Development and Progression of Diabetic Retinopathy

Priyamvada M Pitale et al. Diabetes. 2021 Aug.

Abstract

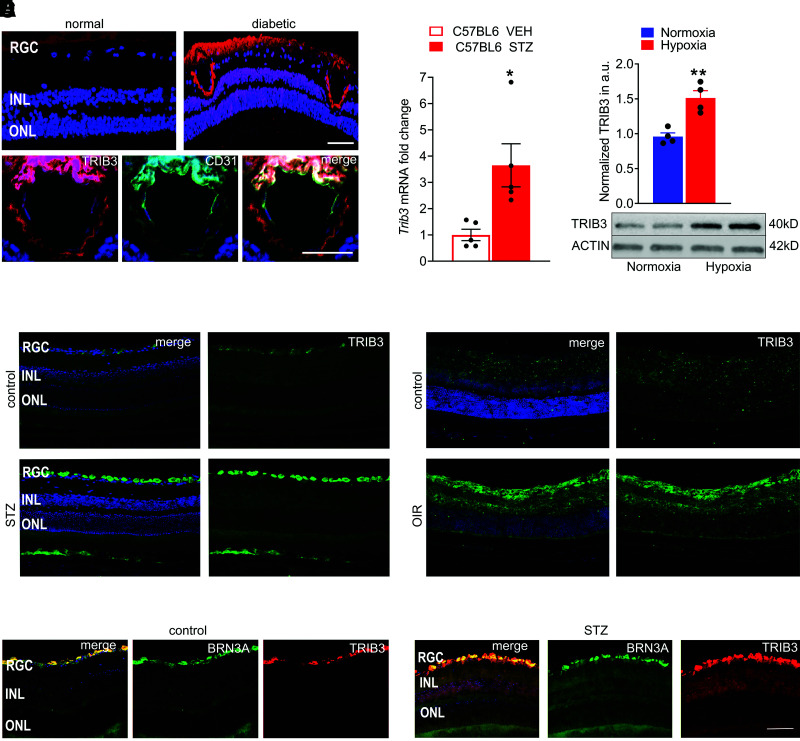
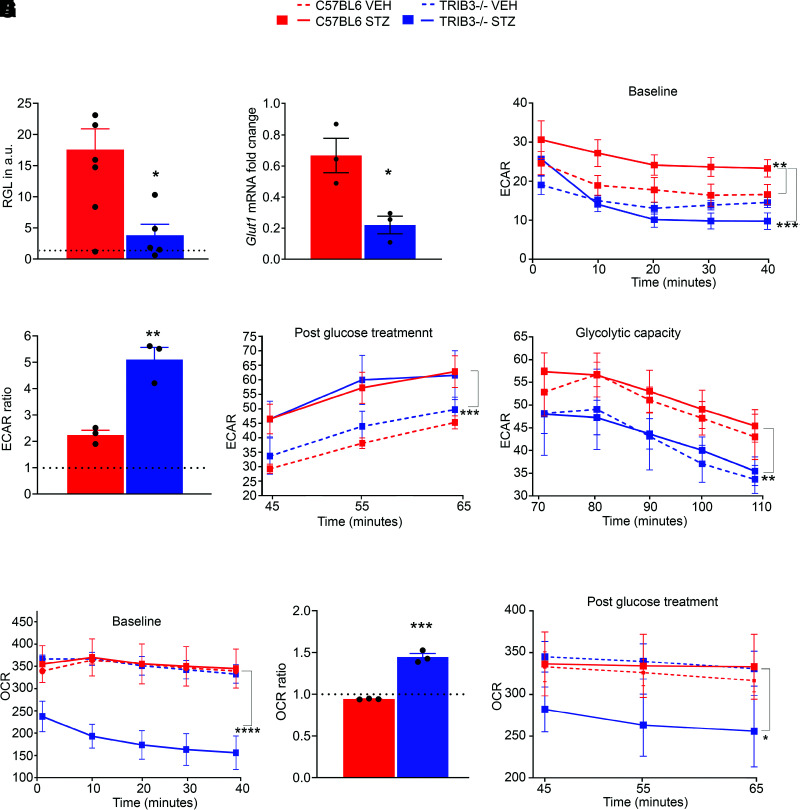
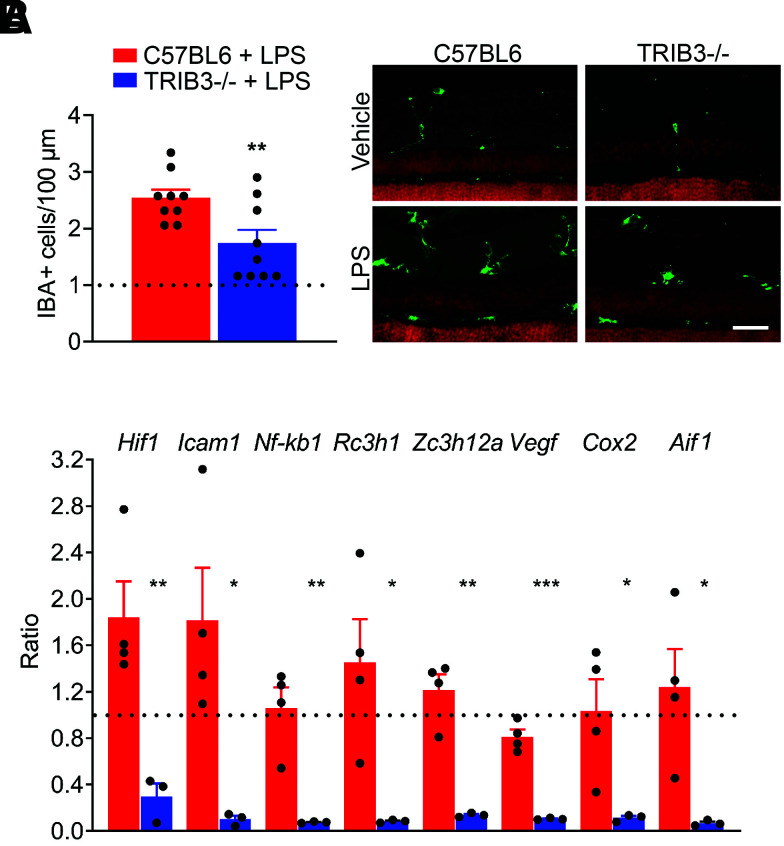
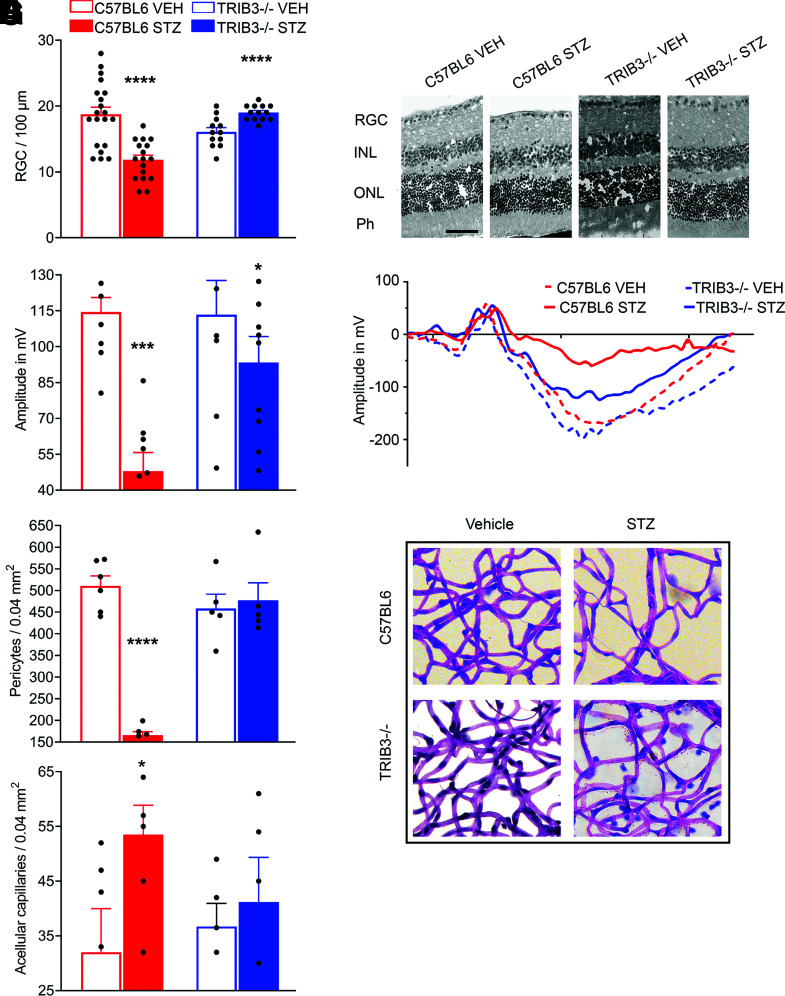
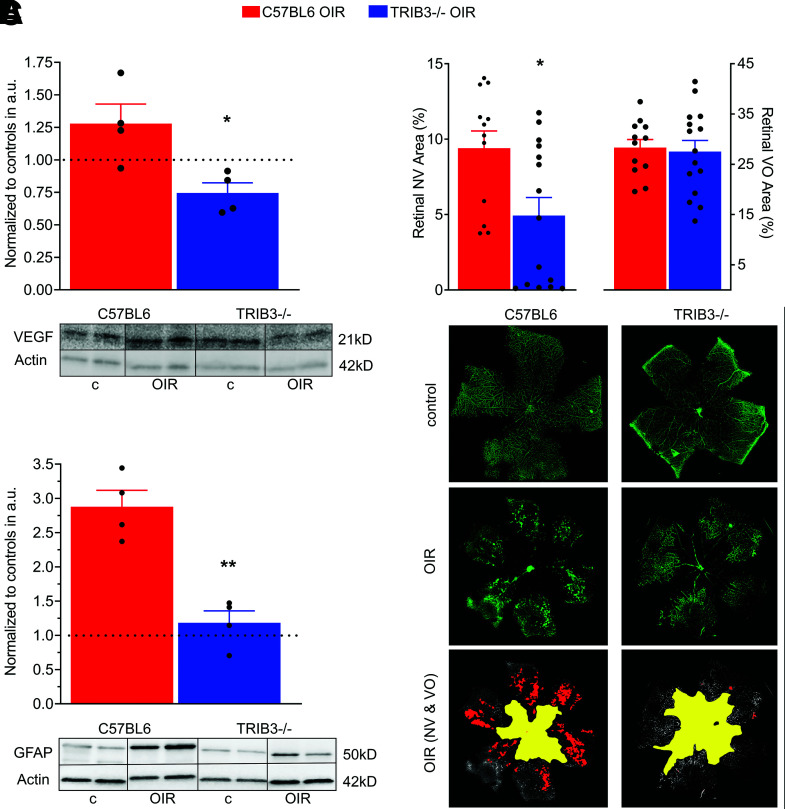
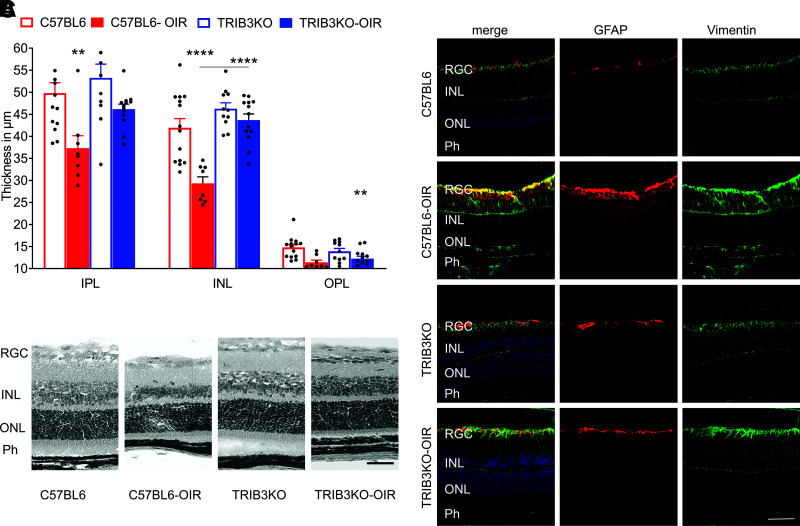
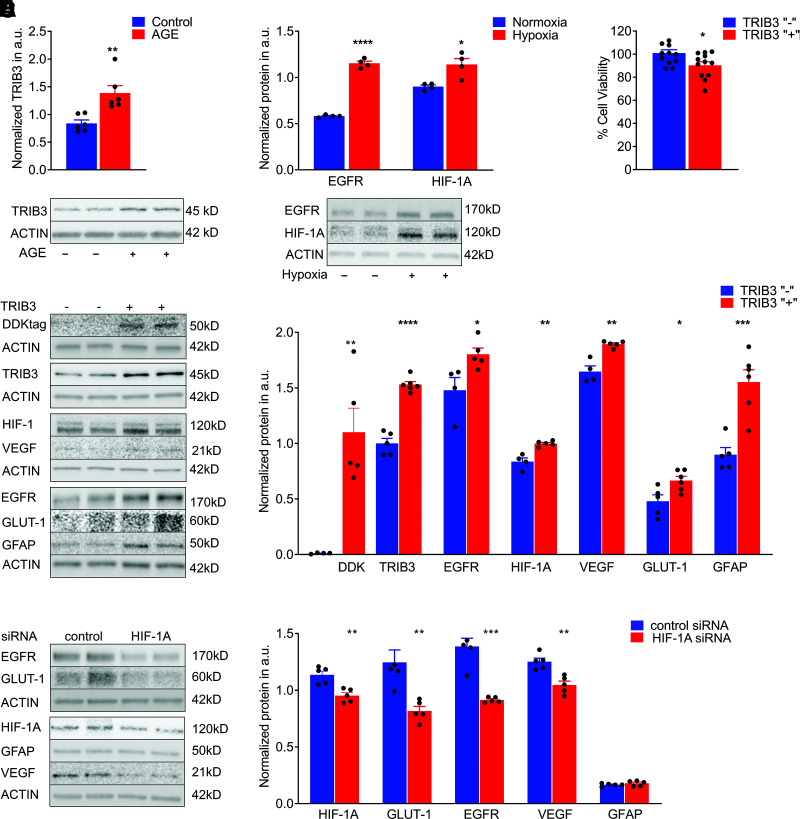
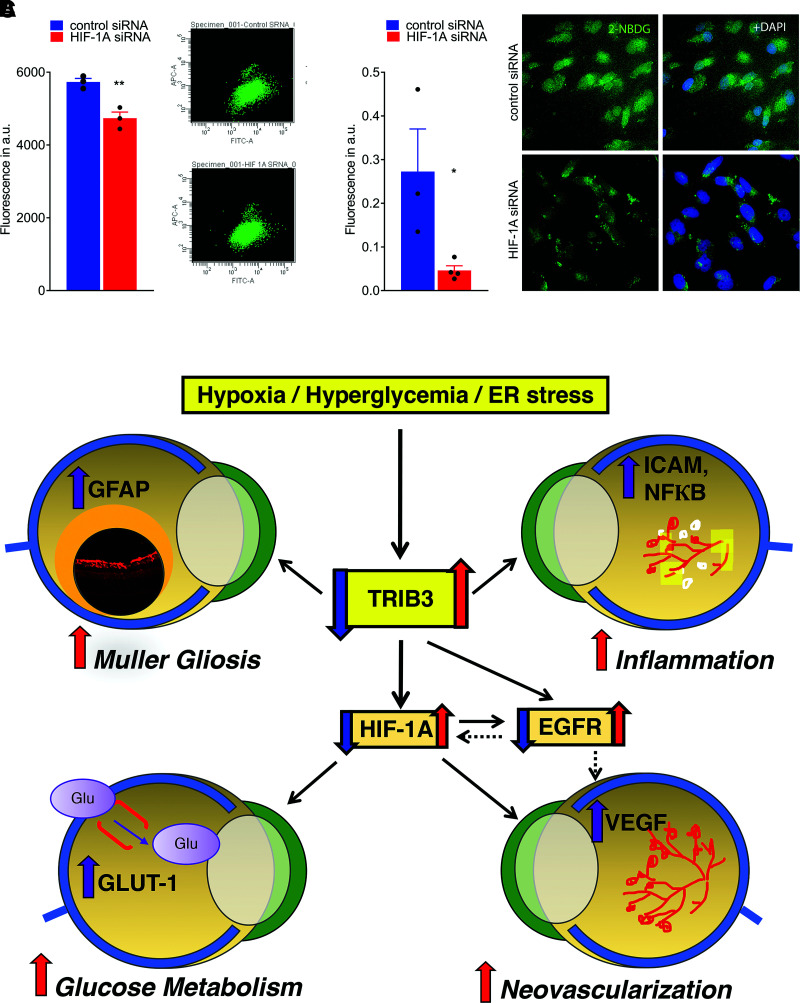
The current understanding of the molecular pathogenesis of diabetic retinopathy does not provide a mechanistic link between early molecular changes and the subsequent progression of the disease. In this study, we found that human diabetic retinas overexpressed TRIB3 and investigated the role of TRIB3 in diabetic retinal pathobiology in mice. We discovered that TRIB3 controlled major molecular events in early diabetic retinas via HIF1α-mediated regulation of retinal glucose flux, reprogramming cellular metabolism, and governing of inflammatory gene expression. These early molecular events further defined the development of neurovascular deficit observed in mice with diabetic retinopathy. TRIB3 ablation in the streptozotocin-induced mouse model led to significant retinal ganglion cell survival and functional restoration accompanied by a dramatic reduction in pericyte loss and acellular capillary formation. Under hypoxic conditions, TRIB3 contributed to advanced proliferative stages by significant upregulation of GFAP and VEGF expression, thus controlling gliosis and aberrant vascularization in oxygen-induced retinopathy mouse retinas. Overall, our data reveal that TRIB3 is a master regulator of diabetic retinal pathophysiology that may accelerate the onset and progression of diabetic retinopathy to proliferative stages in humans and present TRIB3 as a potentially novel therapeutic target for diabetic retinopathy.


Figures

Figure 1
Figure 1
Human and mouse diabetic retinas overexpress TRIB3 protein. A: TRIB3 expression in the human diabetic retinas detected using IHC with anti-TRIB3 primary antibody is shown in red. Strong TRIB3 immunoreactivity is detected in the ONL, INL, RGC, and endothelial cells in the human diabetic retina. The TRIB3 immunoreactivity also colocalizes (in yellow) with CD31+ cells (in green), suggesting that CD31+ endothelial cells of the fibrovascular membrane also express TRIB3. Scale bar = 50 µm. B: Detection of TRIB3 expression in mouse diabetic retinas at 4 weeks of hyperglycemia by quantitative real-time PCR. Data are mean ± SEM (n = 5). C: TRIB3 overexpression detected in hypoxic Müller MIO-M1 cells at 48 h. D: Detection of TRIB3 in the mouse normal and diabetic retinas at 32 weeks after STZ-induced hyperglycemia (in green). DAPI-stained nuclei are shown in blue. Merged images are on the left. Robust TRIB3 expression is detected in the RGC layer. E: Detection of TRIB3 in normoxic and hypoxic mouse retina at P17. Robust TRIB3 expression is detected in the RGC, IPL, INL, and ONL (in green). DAPI-stained nuclei are shown in blue. Merged images are on the left. F: Expression of TRIB3 is colocalized with the RGC marker BRN3A in control and diabetic retinas at 32 weeks of hyperglycemia. TRIB3 is shown in red, BRN3A is shown in green, and colocalization is shown in yellow. DAPI-stained nuclei are shown in blue. Robust TRIB3 expression is detected in the RGC layer. Scale bar = 100 µm. *P < 0.05, **P < 0.01. a.u., arbitrary units; VEH, vehicle.
Figure 2
Figure 2
TRIB3 reprograms glucose metabolism in diabetic retinas. A: RGLs measured in diabetic retinas (mg/dL) were normalized to their appropriate controls (dotted line) at 4 weeks of hyperglycemia. Significant reduction of RGL is observed in TRIB3 KO diabetic retinas (C57BL/6 diabetic and control, n = 8–9; TRIB3 KO diabetic and control, n = 5–11). Also see Supplementary Table 2. B: TRIB3 controls expression of Glut1 gene at 4 weeks of hyperglycemia (n = 3). Fold changes for each diabetic group were normalized to own controls. Significant reduction in Glut1 expression is observed in TRIB3 KO diabetic retinas. CF, H, and I: Results of the metabolic stress experiments (n = 4–6). C: The ECAR baseline of diabetic and control C57BL/6 and TRIB3 KO groups at 4 weeks postinjection (mpH/min). Significant increase in the ECAR baseline in C57BL/6 diabetic retinas is shown during the first 40 min. D: Addition of glucose results in dramatic jumps in the ECAR. Thence, the TRIB3 KO diabetic retinas manifest more sensitivity than C57BL/6 hyperglycemic tissue. The presented ECARs are expressed as the ratios of the normalized ECARs at 45 min over the normalized ECARs measured at 40 min (dotted line). E: Rates of glycolysis in the four experimental groups measured after glucose treatment in a real-time experiment. Both diabetic retinas demonstrate comparable levels of glycolysis. F: Measurement of glycolytic capacity in diabetic retinas after suppression of the mitochondrial respiration rate by using oligomycin. Reduced glycolytic capacity of TRIB3 KO diabetic retinas (∼18%) vs. C57BL/6 hyperglycemic retinas (mpH/min). G: The OCR baseline measurements in normal and diabetic mouse groups. Significant reduction in the OCR is detected in TRIB3 KO hyperglycemic retinas. H: Addition of glucose at 40 min results in a high sensitivity of the OCR in TRIB3 diabetic retinas registered at 45 min (dotted line). I: However, this jump does not cause an increase in the OCR compared with C57BL/6 diabetic retinas in a timely manner. The OCR continues to decline in TRIB3 diabetic retinas as measured in pmol/min. Data are mean ± SEM. *P < 0.05, **P < 0.01, ***P < 0.001, ****P < 0.0001. a.u., arbitrary units; VEH, vehicle.
Figure 3
Figure 3
TRIB3 controls immunoresponse in stressed and diabetic retinas. A: Mice were intraperitoneally injected with 10 µL/g LPS and sacrificed 24 h later (n = 5). The cryostat retinal sections were subjected by IHC analysis with anti-IBA1 antibody, and IBA-positive cells per 100 µm were counted (in green). The results are presented as ratios of cells detected in LPS-injected retinas normalized to own controls (dotted lines). Scale bar = 100 μm. B: TRIB3 controls expression of proinflammatory genes at 4 weeks of hyperglycemia (n = 3–4). Fold changes for each diabetic group were normalized to own controls. Thus, we observe a dramatic decline in Hif1α, Icam1, Nf-kb1, Rc3h1, Zc3h12a, Vegf, Cox2, and Aif1 expression in TRIB3 KO diabetic retinas. Data are mean ± SEM. *P < 0.05, **P < 0.01, ***P < 0.001.
Figure 4
Figure 4
TRIB3 controls neuronal and endothelial health in diabetic retinas at 32 weeks after STZ administration. A: The number of ganglion cells/100 µm is dramatically increased in the diabetic TRIB3 KO mouse retinas compared with the diabetic C57BL/6 group. No changes were observed between control C57BL/6 and control TRIB3 KO retinas and control TRIB3 KO and diabetic TRIB3 KO retinas, while a significant difference was detected between control and diabetic C57BL/6 groups (n = 6). B: Representative images of the hematoxylin-eosin–stained control and diabetic retinas. Scale bar = 100 µm. C: The PhNR amplitudes characterizing the RGC function as recorded by the photopic electroretinography procedure in the C57BL/6 control and diabetic (n = 9 for both) and TRIB3 KO control and diabetic (n = 8–12) mouse groups. Significant diminishing of the RGC function is detected in the C57BL/6 diabetic mice, whereas dramatic elevation of PhNR is observed in TRIB3-ablated diabetic retinas. D: Representative images of PhNR registered in all four groups. E: The number of pericytes detected in a 0.04-mm2 area of the retina is markedly reduced in the diabetic C57BL/6 retinas compared with other mouse groups (n = 6 for C57BL/6 control and diabetic mice, n = 5 for TRIB3 KO control and diabetic mice). TRIB3 ablation slows down the pericyte loss in diabetic retinas. F: TRIB3 ablation in diabetic retina prevents formation of acellular capillaries detected in a 0.04-mm2 area of the retina. G: Representative images for periodic acid Schiff–stained retinal pericytes and acellular capillaries in the retinas of the four mouse groups. Data are mean ± SEM. *P < 0.05, ***P < 0.001, ****P < 0.0001. Ph, photoreceptor; VEH, vehicle.
Figure 5
Figure 5
TRIB3 promotes retinal vascularization during hypoxia. A: Expression of VEGF normalized to own controls (dotted line) in two hypoxic groups at P13 (n = 4). Significant reduction of VEGF in TRIB3 KO hypoxic retinas is observed. Representative images of the Western blots probed with anti-VEGF antibody are shown at the bottom. B: Ratios of the NV (left) and VO (right) areas in the hypoxic C57BL/6 and TRIB3 KO retinas (n = 6–8) to the whole retinal areas at P17. The flat mount images were used to run a computer program developed by Xiao et al. (17) to analyze areas of NV and VO. Significant reduction in NV area is observed in hypoxic TRIB3 KO retinas of pups, while no changes in VO between OIR C57BL/6 and TRIB3 are detected. Representative images for NV and avascular area in the flat mount retinas of pups were stained with isolectin (in green). C: Expression of GFAP in two diabetic C57BL/6 and TRIB3 KO groups normalized to own controls (dotted line) at P13 (n = 4). A dramatic reduction in the GFAP level in diabetic retinas with TRIB3 ablation was detected. Representative images of the Western blots probed with anti-GFAP antibody are shown at the bottom. Data are mean ± SEM. *P < 0.05, **P < 0.01. a.u., arbitrary units; c, control.
Figure 6
Figure 6
TRIB3 promotes retinal integrity loss and activates gliosis during hypoxia. A: TRIB3 KO significantly preserves the retinal integrity in hyperglycemic mice (n = 5). The IPL, INL, and OPL thicknesses are diminished in C57BL/6 diabetic retinas, whereas protection is observed in TRIB3 KO diabetic retinas, demonstrating no difference compared with control retinas in both genetic groups. B: Representative images of the hematoxylin-eosin–stained retinas in the four mouse groups. C: Representative images of the retinal sections probed with anti-GFAP (red) and anti-vimentin (green) antibodies and DAPI (blue) in the four mouse groups taken with fluorescent microscopy. Merged images are shown on the left. Scale bars = 100 µm. Data are mean ± SEM. **P < 0.01, ****P < 0.0001. Ph, photoreceptor.
Figure 7
Figure 7
TRIB3 overexpression activates downstream signaling in Müller MIO-M1 cells. A: AGE treatment results in TRIB3 overexpression in 72 h (n = 6). B: Hypoxia induces HIF1 and EGFR protein in addition to TRIB3 (Fig. 1) (n = 4). C: Müller cells overexpressing TRIB3 demonstrate compromised cell viability (n = 4). D: Overexpression of TRIB3 in hypoxic Müller cells results in overexpression of EGFR1, HIF1α, VEGF, GFAP, and GLUT1 (n = 4–5). E: Knockdown of Hif1a mRNA in hypoxic Müller cells results in downregulation of GLUT1, EGFR1, and VEGF1, whereas GFAP expression does not respond to the treatment with siRNA (n = 5). Data are mean ± SEM. *P < 0.05, **P < 0.01, ***P < 0.001, ****P < 0.0001. a.u., arbitrary units.
Figure 8
Figure 8
Treatment of hypoxic Müller cells with siRNA targeting HIF1α results in reduction of GLUT1 and fluorescent signal from 2-NBDG cellular uptake. A: Reduction of fluorescent signal from 2-NBDG uptake measured by flow cytometry (n = 3). B: Reduction of fluorescent signal from 2-NBDG cellular uptake registered in fixed cultured MIO-M1 cells using microscopy (n = 3–4). The calculation of fluorescent signal was performed using ImageJ. C: Schematic presentation of the proposed molecular mechanism of DR controlled by TRIB3. Under hyperglycemic and hypoxic conditions, TRIB3 overexpression leads to upregulation of HIF1α, EGFR, and GFAP. HIF1α overexpression results in GLUT1 activation followed by an increase in retinal glucose flux, overall affecting retinal metabolism. Additionally, HIF1α mediates VEGF expression, which compromises vascular cell integrity and triggers angiogenesis. EGFR is upregulated as a result of TRIB3 upregulation as well. This protein reportedly induces VEGF and cytokines, leading to vascular dysfunction. TRIB3 promotes expression of GFAP and reactivation of gliosis in hypoxic retinas. Red and purple arrows indicate upregulation, and blue arrows indicate downregulation signaling validated in our study. Solid lines represent data of the current study. Dashed lines denote the regulation proposed in the literature. Data are mean ± SEM. *P < 0.05, **P < 0.01. a.u., arbitrary units; ER, endoplasmic reticulum.

References

    1. Stitt AW, Curtis TM, Chen M, et al. . The progress in understanding and treatment of diabetic retinopathy. Prog Retin Eye Res 2016;51:156–186 - PubMed
    1. Ord T, Ord T. Mammalian pseudokinase TRIB3 in normal physiology and disease: charting the progress in old and new avenues. Curr Protein Pept Sci 2017;18:819–842 - PubMed
    1. Oskolkova OV, Afonyushkin T, Leitner A, et al. . ATF4-dependent transcription is a key mechanism in VEGF up-regulation by oxidized phospholipids: critical role of oxidized sn-2 residues in activation of unfolded protein response. Blood 2008;112:330–339 - PMC - PubMed
    1. Fang N, Zhang W, Xu S, et al. . TRIB3 alters endoplasmic reticulum stress-induced β-cell apoptosis via the NF-κB pathway. Metabolism 2014;63:822–830 - PubMed
    1. Cheng W, Mi L, Tang J, Yu W. Expression of TRB3 promotes epithelial-mesenchymal transition of MLE-12 murine alveolar type II epithelial cells through the TGF-β1/Smad3 signaling pathway. Mol Med Rep 2019;19:2869–2875 - PubMed

Publication types

MeSH terms