. 2021 May 12;6(1):176.
doi: 10.1038/s41392-021-00563-x.

Activation of transmembrane receptor tyrosine kinase DDR1-STAT3 cascade by extracellular matrix remodeling promotes liver metastatic colonization in uveal melanoma

Affiliations

Activation of transmembrane receptor tyrosine kinase DDR1-STAT3 cascade by extracellular matrix remodeling promotes liver metastatic colonization in uveal melanoma

Wei Dai et al. Signal Transduct Target Ther. .

Abstract

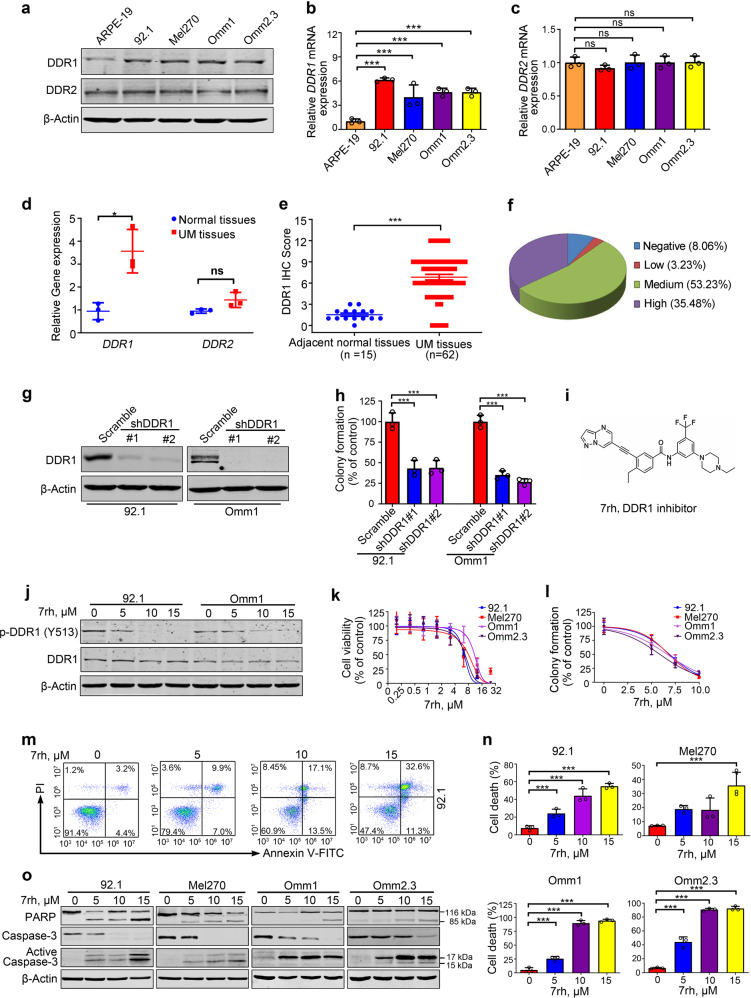
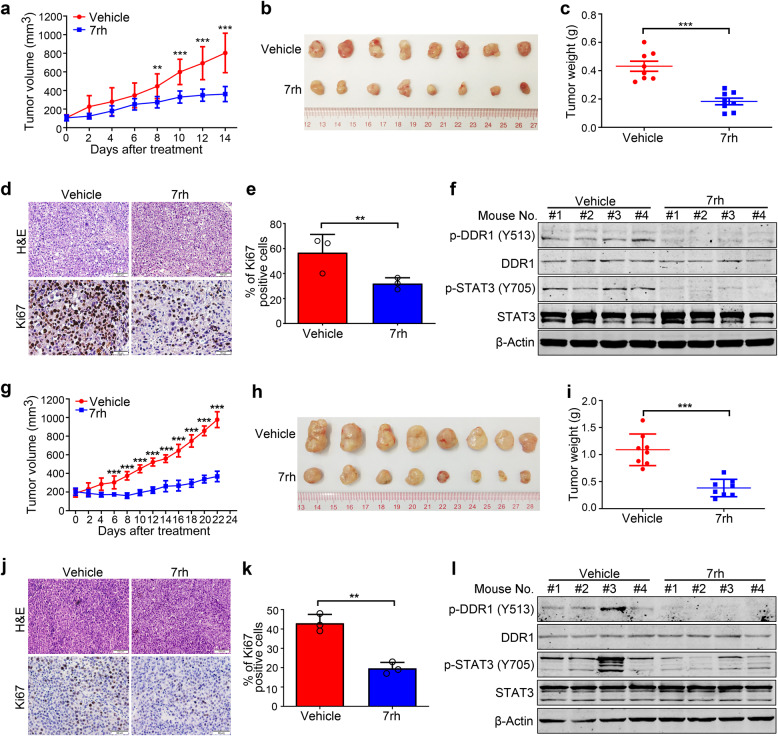
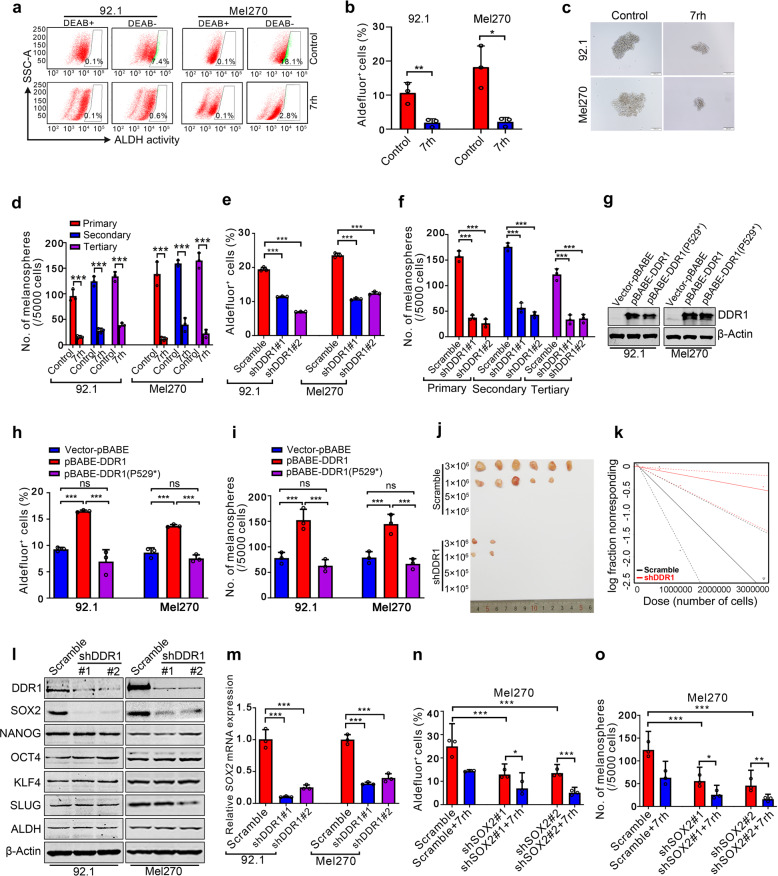
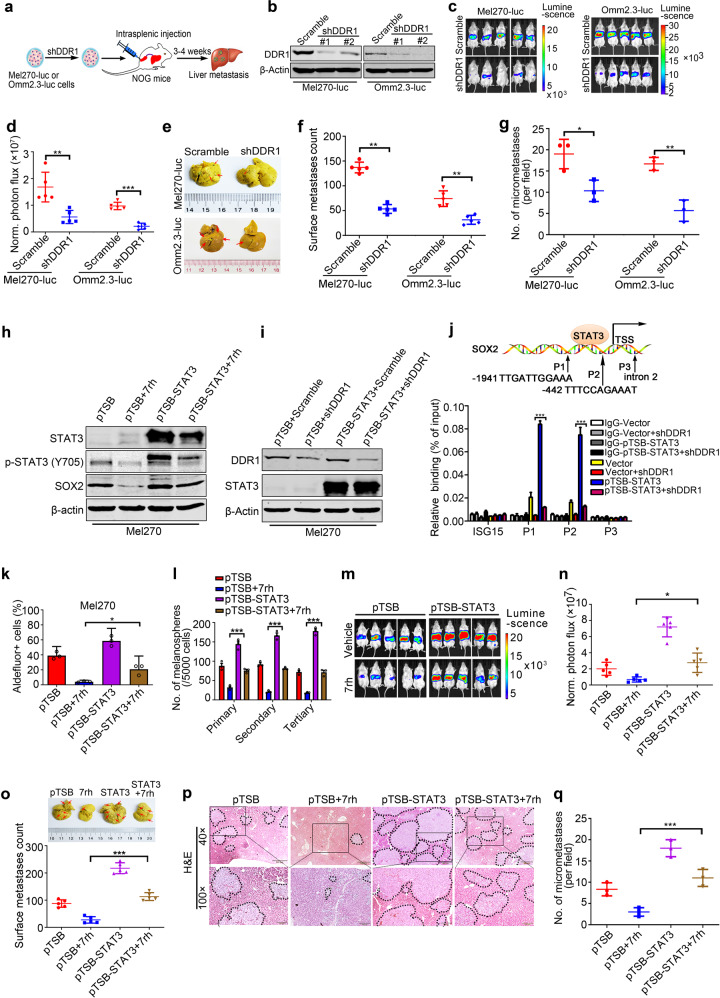
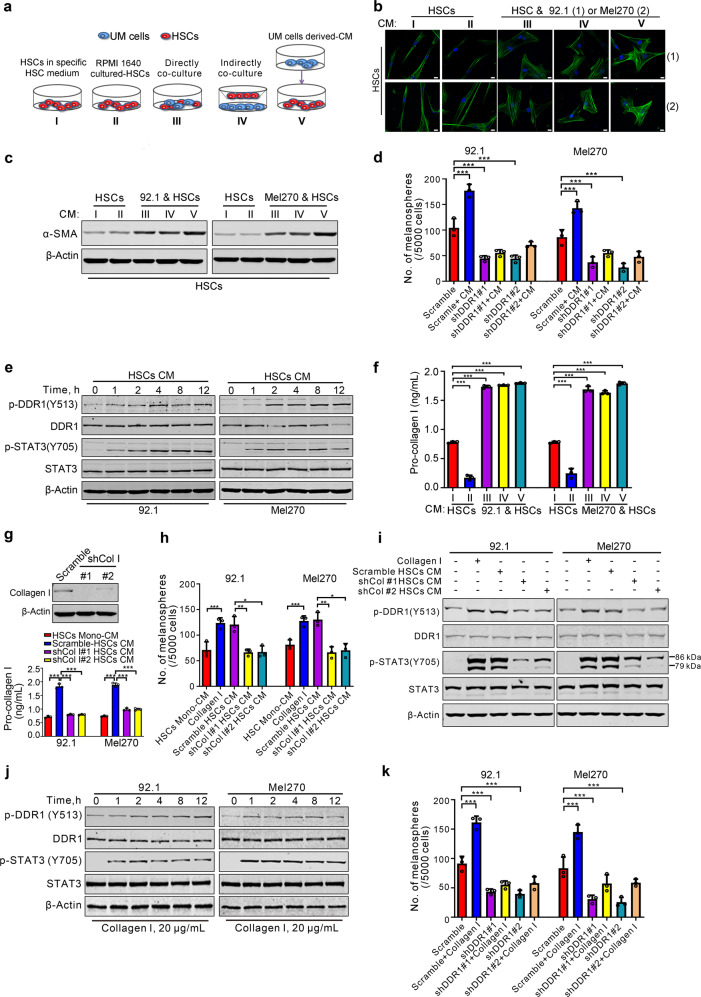
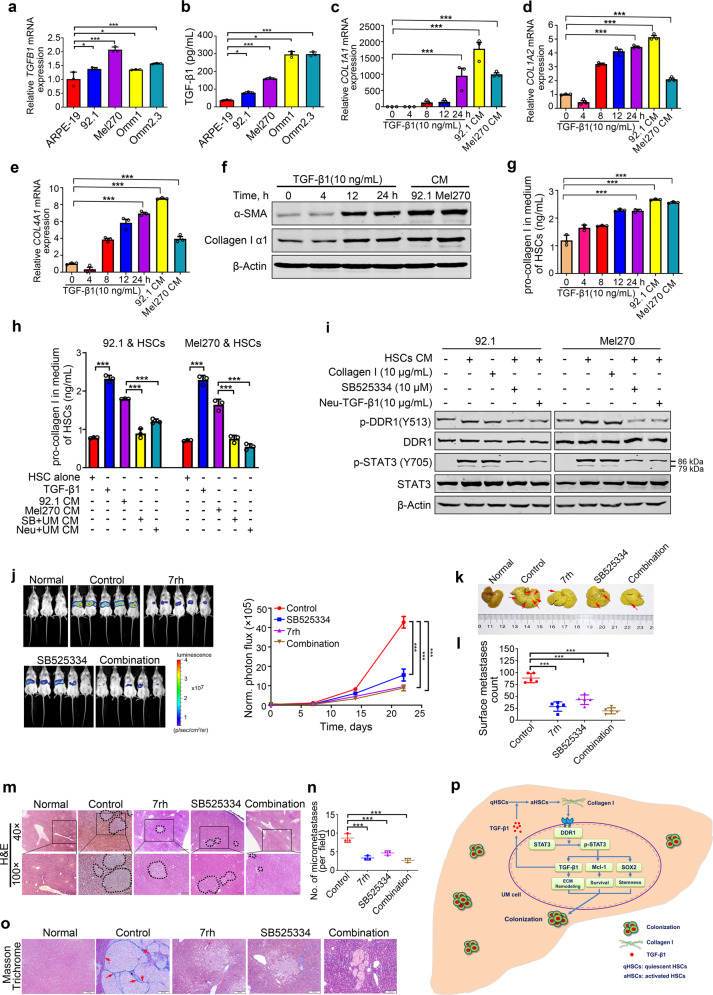
Colonization is believed a rate-limiting step of metastasis cascade. However, its underlying mechanism is not well understood. Uveal melanoma (UM), which is featured with single organ liver metastasis, may provide a simplified model for realizing the complicated colonization process. Because DDR1 was identified to be overexpressed in UM cell lines and specimens, and abundant pathological deposition of extracellular matrix collagen, a type of DDR1 ligand, was noted in the microenvironment of liver in metastatic patients with UM, we postulated the hypothesis that DDR1 and its ligand might ignite the interaction between UM cells and their surrounding niche of liver thereby conferring strengthened survival, proliferation, stemness and eventually promoting metastatic colonization in liver. We tested this hypothesis and found that DDR1 promoted these malignant cellular phenotypes and facilitated metastatic colonization of UM in liver. Mechanistically, UM cells secreted TGF-β1 which induced quiescent hepatic stellate cells (qHSCs) into activated HSCs (aHSCs) which secreted collagen type I. Such a remodeling of extracellular matrix, in turn, activated DDR1, strengthening survival through upregulating STAT3-dependent Mcl-1 expression, enhancing stemness via upregulating STAT3-dependent SOX2, and promoting clonogenicity in cancer cells. Targeting DDR1 by using 7rh, a specific inhibitor, repressed proliferation and survival in vitro and in vivo outgrowth. More importantly, targeting cancer cells by pharmacological inactivation of DDR1 or targeting microenvironmental TGF-β1-collagen I loop exhibited a prominent anti-metastasis effect in mice. In conclusion, targeting DDR1 signaling and TGF-β signaling may be a novel approach to diminish hepatic metastasis in UM.


Conflict of interest statement

The authors declare no competing interests.

Figures

Fig. 1
Fig. 1
DDR1 is overexpressed in uveal melanoma and inhibition of DDR1 reduces colony formation capacity and induces apoptosis in human UM cells. ac Protein and mRNA levels of DDR1 and DDR2 in human uveal melanoma (UM) cells (Mel270, 92.1, Omm1, and Omm2.3) and retinal pigment epithelial (ARPE-19) cells were determined by western blotting and qRT-PCR analysis, respectively. ns, no significant. Data are shown as the mean ± SD (n = 3). d The mRNA levels of DDR1 and DDR2 genes in normal choroid tissues and UM tissues were assessed by qRT-PCR. Data are shown as the mean ± SD (n = 3). e, f Statistical analysis of DDR1 expression in paraffin-embedded tissues from the patients with UM (n = 62) is shown. The staining intensity was scored on four levels (negative, low, medium, and high). Data are shown as the mean ± SD. g 92.1 and Omm1 cells stably transduced with control shRNA (Scramble) or two DDR1 shRNAs lentivirus underwent western blotting analysis or h colony-formation assay in soft agar-containing culture, Data are shown as the mean ± SD (n = 3). i The chemical structure of DDR1 inhibitor 7rh is shown. j The effect of 7rh on the phosphorylation of DDR1 was ascertained by western blotting analysis after 92.1 and Omm1 cells exposure to 7rh for 24 h. k UM cells were treated with escalating concentrations of 7rh for 72 h, cell viability was determined by MTS assay. Data are shown as the mean ± SD (n = 3). l After treatment with 7rh at the indicated concentrations for 48 h, the UM cells were harvested and seeded in drug-free soft agar-containing culture for 14 days, colonies were counted and analyzed. Data are shown as the mean ± SD (n = 3). m, n UM cells were exposed to increasing concentrations of 7rh for 48 h, or 15 μM 7rh for the different durations, flow cytometry was employed to detect the apoptosis after dual-staining with Annexin V-FITC and PI. Representative flow cytometry dot plots for 92.1 cells (m) and quantitative analysis of results from three independent experiments (n) are shown. The Y-axis is the sum of the top left, top right, and bottom right quadrants. Data are shown as the mean ± SD (n = 3). o Cleavage of PARP and activation of caspase-3 were determined by western blotting after UM cells were treated with escalating concentrations of 7rh. *P < 0.05; ***P < 0.001, one-way ANOVA, post hoc comparisons, Tukey’s test for result in b, c, h and n; *P < 0.05; ***P < 0.001, Student’s t test for results in (d, e)
Fig. 2
Fig. 2
7rh impedes outgrowth of xenografted Omm1 cells and MP41 cells patient-derived xenograft model in NOD-SCID mice. ac Male NOD-SCID mice (4–6 weeks) bearing palpable Omm1 xenografted tumors were randomly administered with either vehicle (ddH2O:DMSO:EtOH:Cremophor EL = 90:2:4:4) or 7rh (25 mg/kg in vehicle, orally) every day for 14 days (n = 8 per group). a The tumor volumes estimated every other day measurement by caliper versus time were plotted. Data are shown as the mean ± SD (n = 8). b Representative tumors resected from mice treatment with vehicle or 7rh for 14 days are shown. c Weights of tumor from mice of each group are shown. Data are shown as the mean ± SD (n = 8). d The xenograft tissues from the vehicle- or 7rh-treated mice were subject to H&E staining and IHC analysis with anti-Ki67. Scale bar: 100 µm (H&E staining), 50 µm (IHC staining). e The total number of Ki67-positive cells (brown-stained nuclei, regardless of staining intensity were counted as positive) in three random microscopic fields was counted by Image-Pro Plus 6.0. Data are shown as the mean ± SD (n = 3). f Western blotting detection of DDR1, phospho-DDR1 and its downstream signal phospho-STAT3 in tumor tissues from each group of mice is shown. gl The effect of 7rh on UM PDX model. Male NOD-SCID mice (4–6 weeks) bearing palpable MP41 cells xenografted tumors were randomly administered with either vehicle (ddH2O:DMSO:EtOH:Cremophor EL = 90:2:4:4) or 7rh (25 mg/kg in vehicle, orally) every day for 22 days. g The tumor volumes estimated every other day measurement by caliper versus time were plotted. Data are shown as the mean ± SD (n = 8). h, i The mice were sacrificed and tumors were collected, then tumors were photographed and weights were measured and analyzed. Data are shown as the mean ± SD (n = 8). j, k Tumor sections from two groups were subject to H&E staining and IHC analysis with anti-Ki67. The total number of Ki67-positive cells was counted. Data are shown as the mean ± SD (n = 3). Scale bar: 100 µm (H&E staining), 50 µm (IHC staining). l Western blotting analysis of cell lysates of tumors was performed to detect DDR1, phospho-DDR1 and its downstream signal phospho-STAT3 after vehicle or 7rh treatment. **P < 0.01; ***P < 0.001, Student’s t test for results in (a, c, e, g, i and k)
Fig. 3
Fig. 3
DDR1 inhibition suppresses the properties of cancer stem-like cells through lowering SOX2 in UM cells. a, b 92.1 and Mel270 cells were treated with 10 μM 7rh for 48 h, the ALDH activity was detected by flow cytometry. Representative flow cytometry (a) and quantitative analysis of ALDH+ cells (b) from three independent experiments are shown. Data are shown as the mean ± SD (n = 3). c, d 92.1 and Mel270 cells were treated with 10 μM 7rh for 48 h, and then drug-freely cultured for three rounds of melanosphere assay for 14 days. Data are shown as the mean ± SD (n = 3). Scale bar: 200 µm. e 92.1 and Mel270 cells stably transduced with lentiviral Scramble or shDDR1 were assayed by flow cytometry for the proportion of ALDH+ cells. Quantitative analysis of ALDH+ cells from three independent experiments is shown. Data are shown as the mean ± SD (n = 3). f 92.1 cells stably transduced with lentiviral Scramble or shDDR1 were plated in the stem cell culture medium. Melanospheres were counted on day 14. The cells were harvested and replated for the secondary and tertiary rounds of evaluation, respectively. Data are shown as the mean ± SD (n = 3). ***P < 0.001, one-way ANOVA, post hoc comparisons, Tukey’s test. g Ectopic expression of wild-type DDR1 or mutant DDR1 (DDR1 P529*) in 92.1 and Mel270 cells were determined by western blotting analysis. h Overexpression of wild-type DDR1 but not mutant DDR1 (DDR1 P529*) increased the percentage of ALDH+ cells as detected by flow cytometry in 92.1 and Mel270 cells. ns no significant. Data are shown as the mean ± SD (n = 3). i Ectopic expression of wild-type DDR1 rather than mutant DDR1 (DDR1 P529*) potentiated self-renewal capacity as evaluated by melanosphere growth and serially-replating assay in 92.1 and Mel270 cells. ns no significant. Data are shown as the mean ± SD (n = 3). j, k Silencing DDR1 decreased in vivo frequency of CSCs in UM cells. Omm1 cells stably transduced with lentiviral Scramble or shDDR1 were subjected to limiting dilution assay in NOD-SCID mice. Representative image of tumors removed from the mice of each group (n = 6) are shown. The frequency of CSCs was calculated by L-Cal software. l DDR1 deletion decreased the expression of SOX2. The protein levels of stemness-related proteins were detected by western blotting in 92.1 and Mel270 cells stably transduced with Scramble or shDDR1 lentivirus. m DDR1 deletion downregulated the mRNA levels of SOX2. The mRNA levels of SOX2 in 92.1 and Mel270 cells stably transduced with Scramble or shDDR lentivirus were determined by qRT-PCR. Data are shown as the mean ± SD (n = 3). n, o The percentage of ALDH+ cells and melanosphere assay were performed in Mel270 cells stably transduced with Scramble or shSOX2 lentivirus with or without 7rh. Data are shown as the mean ± SD (n = 3). *P < 0.05; **P < 0.01; ***P < 0.001, Student’s t test for results in (b, d). *P < 0.05; **P < 0.01; ***P < 0.001, one-way ANOVA, post hoc comparisons, Tukey’s test for results in (e, f, h, i and m–o)
Fig. 4
Fig. 4. Silencing DDR1 suppresses the metastatic colonization of UM cells in liver.
a Experimental schematic of liver metastasis model. b DDR1 knockdown in Mel270-luc and Omm2.3-luc cells stably transduced with Scramble or shDDR1 lentivirus was confirmed by Western blotting. c, d Mel270-luc and Omm2.3-luc cells stably transduced with Scramble or shDDR1 were intrasplenically inoculated in NOG mice for 3–4 weeks (n = 5 per group). Liver metastasis was analyzed by luciferase-based bioluminescence imaging system. Representative images (c) and quantitative analysis (d) of photon flux on day 21 are shown. Data are shown as the mean ± SD (n = 5). e, f The mice were sacrificed to count metastatic nodules on liver surface. Representative images (e) and quantitative analysis of liver surface nodules (f) are shown. Data are shown as the mean ± SD (n = 5). g Quantitative analysis of micrometastases in H&E staining liver sections from Scramble and shDDR1 mice. Data are shown as the mean ± SD (n = 3). **P < 0.01, Student’s t test for results in (d, f, g). h Mel270 cells transduced with lentiviral vector (pTSB) or construct encoding human STAT3 cDNA (pTSB-STAT3) were exposed to 10 μM 7rh for 24 h, and subjected to western blotting analysis with the indicated antibodies. i DDR1 knockdown and STAT3 overexpression was confirmed by western blotting in Mel270 cells stably expressed shDDR1 with or without STAT3 overexpression. j Experimental schematic diagram showing the location of STAT3-binding sites of SOX2 regulatory region. P1, P2 represent STAT3-binding sites at the SOX2 gene promoter. P3 was used as negative control and located in intronic region. ISG15 as a known non-target gene of STAT3 served as a negative control (top). ChIP-PCR analysis for STAT3 occupancy at the SOX2 gene promoter in Mel270 cells stably expressed shDDR1 with or without STAT3 overexpression (bottom). Data are shown as the mean ± SD (n = 3). k Enforced expression of STAT3 attenuated the 7rh-mediated decrease in percentage of ALDH+ cells in UM cells. Mel270 cells stably expressed with STAT3 were treated with or without 10 μM 7rh for 24 h, and then subjected to ALDH+ cells analysis by flow cytometry. Quantitive analysis of ALDH+ cells from three independent experiments is shown. Data are shown as the mean ± SD (n = 3). l Overexpression of STAT3 reversed the 7rh-mediated decrease in melanosphere growth and serially-replating capacity in UM. Mel270 cells stably expressed with STAT3 were treated with or without 10 μM 7rh for 24 h, and then subjected to melanosphere-formation assay. Data are shown as the mean ± SD (n = 3). mq Mel270-luc cells stably transduced with lentiviral vector (pTSB) or constructs encoding human STAT3 cDNA (pTSB-STAT3) underwent intrasplenic injection in NOG mice, the mice were then administrated with vehicle (ddH2O:DMSO:EtOH:Cremophor EL = 90:2:4:4) or 7rh (25 mg/kg in vehicle, orally) every day for 21 days (n = 5 per group). Liver metastasis was analyzed by luciferase-based bioluminescence imaging and liver surface nodules were counted. Representative images were taken on day 21 post injection of cells (m) and quantitative analysis of bioluminescence intensity (n) are shown. Data are shown as the mean ± SD (n = 5). o Representative bright field images of liver surface and quantitative analysis of surface metastatic nodules on liver are shown. Data are shown as the mean ± SD (n = 5). p, q Microscopic observation of H&E staining in liver paraffin section from each group verified metastastic nodules. Data are shown as the mean ± SD (n = 3). Scale bar: 500 µm (40×), 200 µm (100×). *P < 0.05; ***P < 0.001, one-way ANOVA, post hoc comparisons, Tukey’s test for results in (j, k, l, n, o and q)
Fig. 5
Fig. 5
UM cells educate hepatic stellate cells (HSCs) to secret collagen I. a Schema of mono-cultured HSCs or co-cultured HSCs with UM cells. I, mono-cultured HSCs with HSC-specific culture medium; II, mono-cultured HSCs with RPMI 1640 culture medium; III, directly co-culture HSCs mixed 1:1 with UM cells for 24 h; IV, HSCs were co-cultured with UM cells in Transwell systems for 24 h; V, UM cells-derived conditioned medium (CM) were added to culture starved HSCs for 6 h and replaced with HSCs specific medium for another 24 h. b, c CM were isolated from HSCs grown in mono-culture or co-cultured with 92.1 or Mel270 cells as indicated approaches (a), and then added into the culture of HSCs for 24 h, the marker of activated-HSCs α-SMA was determined by immunofluorescence assay (b) and western blotting (c). Scale bar: 10 µm. d DDR1 is required for melanosphere-formation in UM cells stimulated by HSCs-derived CM. 92.1 and Mel270 cells stably expressing Scramble or shDDR1 were cultured with HSCs-derived CM and then subjected to melanosphere assay. The medium of UM cells was added to culture starved HSCs for 6 h and replaced with HSCs specific medium for another 24 h, which collected as HSCs-derived CM. Data are shown as the mean ± SD (n = 3). e The CM from HSCs that were educated by UM cells activated DDR1 kinase in UM cells. The HSCs-derived CM was added into the culture of 92.1 and Mel270 cells for different times, and then phosphorylation of DDR1 and its downstream signal phosphorylation of STAT3 were analyzed by western blotting. f ELISA evaluation of the collagen type Iα was performed in various CM collected from different culture systems as illustrated in (a). Data are shown as the mean ± SD (n = 3). g HSCs were infected with lentiviral Scramble or specific shRNA targeting collagen type I, and verified by western blotting (top). The level of collagen type Iα in the CM harvested from HSCs that were stably transduced with lentiviral Scramble or shCol I were measured by ELISA assay (bottom). Data are shown as the mean ± SD (n = 3). h The medium of 92.1 or Mel270 cells was added to culture starved HSCs expressing Scramble or two shRNAs against Collagen I for 6 h and replaced with HSCs specific medium for another 24 h, which collected as Scramble HSC CM, shCol I #1 HSC CM, and shCol I #2 HSC CM, respectively. The indicated HSC-derived CM and recombinant collagen type I (10 μg/mL) were used for melanosphere assay in 92.1 or Mel270 cells. Data are shown as the mean ± SD (n = 3). i Western blotting was conducted after 92.1 or Mel270 cells incubation with recombinant collagen type I (20 μg/mL) or Scramble HSC CM, shCol I #1 HSC CM, and shCol I #2 HSC CM as illustrated in (h) for 24 h. j After UM cells treated with 20 μg/mL collagen I for different durations, the phosphorylation of DDR1 and STAT3 were examined by western blotting. k 92.1 and Mel270 cells stably transduced lentiviral Scramble or shDDR1 were cultured in the absence or presence of recombinant human collagen type I (10 μg/mL) to evaluate melanospheres formation. Data are shown as the mean ± SD (n = 3). *P < 0.05; **P < 0.01; ***P < 0.001, one-way ANOVA, post hoc comparisons, Tukey’s test for results in (d, f, g, h and k)
Fig. 6
Fig. 6
TGF-β1 secreted by UM cells activates microenvironmental HSCs to release collagen type Iα which in turn ligates cell surface DDR1 on UM cells. a Expression of TGF-β1 was analyzed by qRT-PCR assay in UM cells and ARPE-19 cells. Data are shown as the mean ± SD (n = 3). b ELISA analysis of TGF-β1 in the CM of UM cells and ARPE-19 cells is shown. Data are shown as the mean ± SD (n = 3). ce qRT-PCR analysis of collagen Iα1 (c), collagen Iα2 (d) and collagen IV (e) in HSCs after treated with recombinant TGF-β1 (10 ng/mL) for indicated time periods or CM isolated from 92.1 and Mel270 cells for 6 h, then replaced with fresh HSC medium for 24 h. Data are shown as the mean ± SD (n = 3). f, g HSCs were cultured in the presence of 10 ng/mL recombinant TGF-β1 at different time points or the CM derived from 92.1 and Mel270 cells for 6 h, then replaced with fresh HSC medium for 24 h, The cells were pelleted by centrifugation to extract whole-cell lysates for western blotting analysis (f) and the corresponding supernatants were analyzed levels of pro-collagen I using ELISA assay (g). Data are shown as the mean ± SD (n = 3). h, i HSCs were treated with recombinant human TGF-β1 (10 ng/mL), or UM-derived CM in the presence or absence of neutralizing anti-TGF-β1 antibody or SB525334 (TGFβRI inhibitor) for 6 h, then replaced with fresh HSC medium for another 24 h. The collagen type Iα in the resultant medium was determined by ELISA assay (h). The resultant medium or HSC-derived CM was added into the culture of 92.1 and Mel270 cells for 12 h, and then subjected to western blotting analysis of DDR1 and its signaling molecules (i). Data are shown as the mean ± SD (n = 3). jn After 5 × 105 Mel270-luc cells were intrasplenically inoculated, the NOG mice were administered with vehicle (ddH2O:DMSO:EtOH:Cremophor EL = 90:2:4:4), 7rh (25 mg/kg, orally), SB525334 (30 mg/kg/day, i.p.) alone or combination 7rh (25 mg/kg, orally) with SB525334 (30 mg/kg/day, i.p.) every day for 21 days (n = 5 per group). j Representative images of luciferase signals on day 21 after treatment with vehicle, 7rh, SB525334 alone or combination 7rh with SB525334 (left). Quantitative analysis of photon flux for hepatic metastases in NOG mice was performed every week (right). Data are shown as the mean ± SD (n = 5). The mice were sacrificed to count metastatic nodules on liver surface. Representative images (k) and quantitative analysis (l) of liver nodules are shown. Data are shown as the mean ± SD (n = 5). m, n Metastasis nodules in paraffin sections of liver tissue from each group were identified by H&E staining. Scale bar: 500 µm (40×), 200 µm (100×). Data are shown as the mean ± SD (n = 3). o Collagens were detected by Masson trichrome staining in paraffin sections of liver tissue. Scale bar: 200 µm (100×). p A proposed working model is shown. UM cells secrete TGF-β1 which induces quiescent hepatic stellate cells (qHSCs) into activated HSCs (aHSCs) which secretes collagen type I in turn activates DDR1, strengthening survival through upregulating STAT3-dependent Mcl-1, strengthening stemness via upregulating STAT3-dependent SOX2, and clonogenicity in cancer cells and ultimately promotes liver colonization and metastasis in UM. *P < 0.05; **P < 0.01; ***P < 0.001, one-way ANOVA, post hoc comparisons, Tukey’s test for results in (ae, g, h, j, l and n)

Similar articles

Cited by

References

    1. Yousefi M, et al. Organ-specific metastasis of breast cancer: molecular and cellular mechanisms underlying lung metastasis. Cell. Oncol. (Dordr.) 2018;41:123–140. doi: 10.1007/s13402-018-0376-6. - DOI - PubMed
    1. Coupland SE, Lake SL, Zeschnigk M, Damato BE. Molecular pathology of uveal melanoma. Eye (Lond.) 2013;27:230–242. doi: 10.1038/eye.2012.255. - DOI - PMC - PubMed
    1. Luzzi KJ, et al. Multistep nature of metastatic inefficiency: dormancy of solitary cells after successful extravasation and limited survival of early micrometastases. Am. J. Pathol. 1998;153:865–873. doi: 10.1016/S0002-9440(10)65628-3. - DOI - PMC - PubMed
    1. Eble JA, Niland S. The extracellular matrix in tumor progression and metastasis. Clin. Exp. Metastasis. 2019;36:171–198. doi: 10.1007/s10585-019-09966-1. - DOI - PubMed
    1. Gattazzo F, Urciuolo A, Bonaldo P. Extracellular matrix: a dynamic microenvironment for stem cell niche. Biochim. Biophys. Acta. 2014;1840:2506–2519. doi: 10.1016/j.bbagen.2014.01.010. - DOI - PMC - PubMed

Publication types

MeSH terms