. 2021 May 11;12(1):2639.
doi: 10.1038/s41467-021-22695-y.

The RNA landscape of the human placenta in health and disease

Affiliations

The RNA landscape of the human placenta in health and disease

Sungsam Gong et al. Nat Commun. .

Abstract

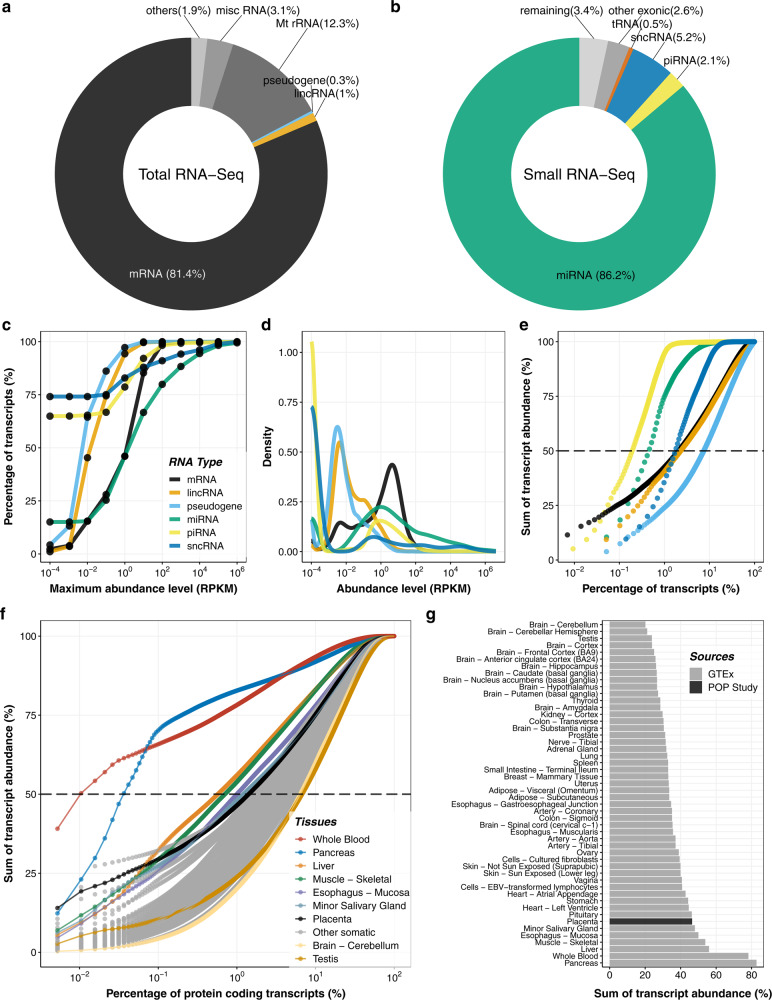
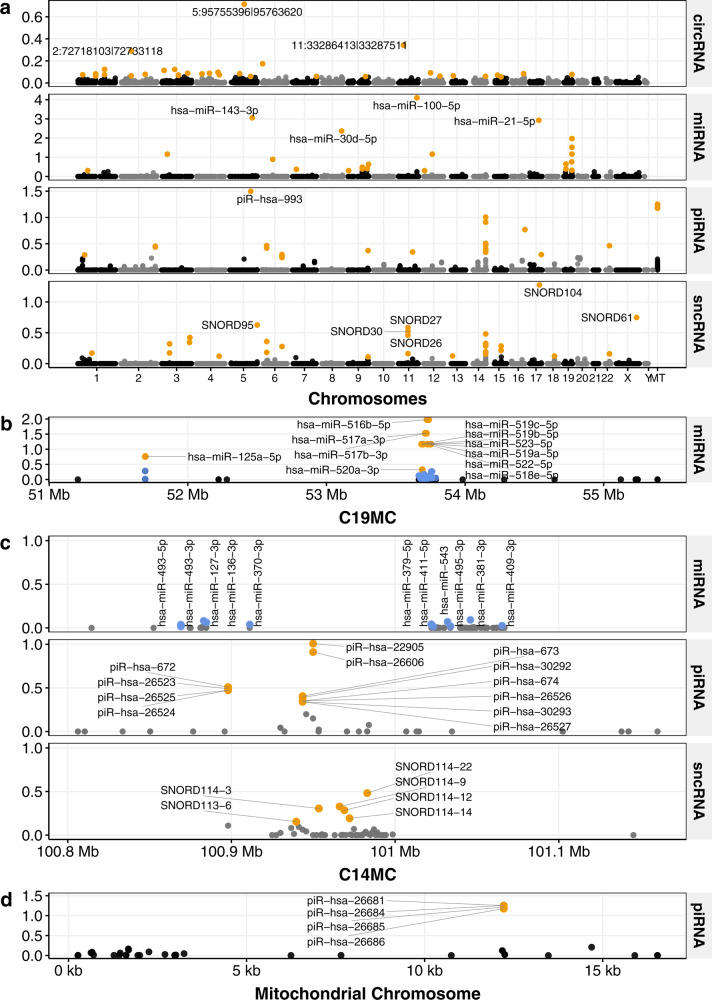
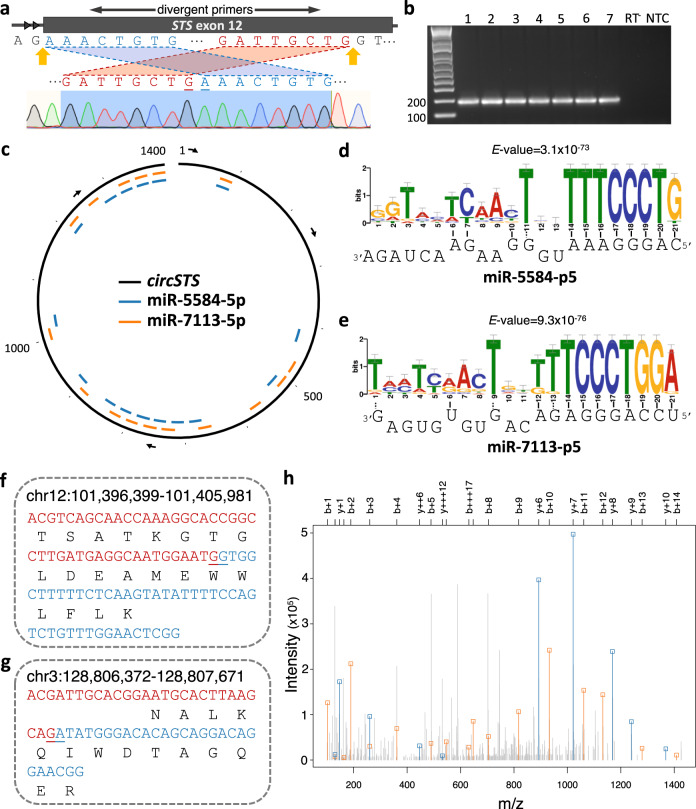
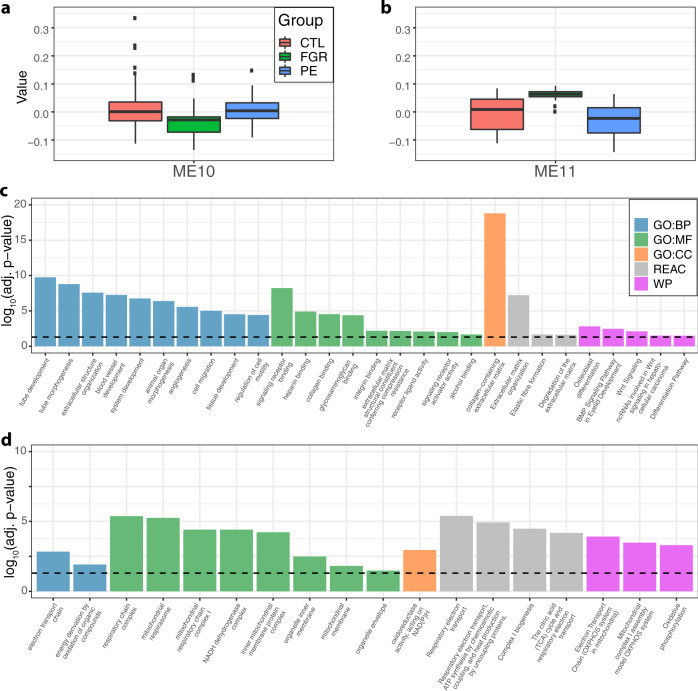
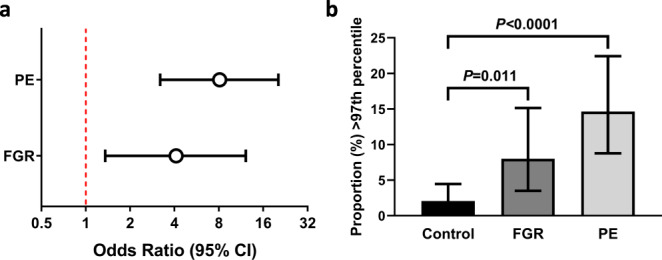
The placenta is the interface between mother and fetus and inadequate function contributes to short and long-term ill-health. The placenta is absent from most large-scale RNA-Seq datasets. We therefore analyze long and small RNAs (~101 and 20 million reads per sample respectively) from 302 human placentas, including 94 cases of preeclampsia (PE) and 56 cases of fetal growth restriction (FGR). The placental transcriptome has the seventh lowest complexity of 50 human tissues: 271 genes account for 50% of all reads. We identify multiple circular RNAs and validate 6 of these by Sanger sequencing across the back-splice junction. Using large-scale mass spectrometry datasets, we find strong evidence of peptides produced by translation of two circular RNAs. We also identify novel piRNAs which are clustered on Chr1 and Chr14. PE and FGR are associated with multiple and overlapping differences in mRNA, lincRNA and circRNA but fewer consistent differences in small RNAs. Of the three protein coding genes differentially expressed in both PE and FGR, one encodes a secreted protein FSTL3 (follistatin-like 3). Elevated serum levels of FSTL3 in pregnant women are predictive of subsequent PE and FGR. To aid visualization of our placenta transcriptome data, we develop a web application ( https://www.obgyn.cam.ac.uk/placentome/ ).


Conflict of interest statement

D.S.C-J. reports grants from GlaxoSmithKline Research and Development Limited, outside the submitted work and non-financial support from Roche Diagnostics Ltd, outside the submitted work; G.C.S.S. reports grants and personal fees from GlaxoSmithKline Research and Development Limited, personal fees and non-financial support from Roche Diagnostics Ltd, outside the submitted work; D.S.C-J. and G.C.S.S. report grants from Sera Prognostics Inc, non-financial support from Illumina Inc, outside the submitted work. J.D. reports being an employee of GlaxoSmithKline Research and Development Limited, outside the submitted work. S.G., F.G., U.S., E.C., P-J.V., L.M., P.D.W.K., and S.R. have nothing to disclose.

Figures

Fig. 1
Fig. 1. Complexity of RNA transcripts in the placenta.
After sequencing and alignment to the human reference genome various RNA biotypes were identified in the placenta. The proportions mapped reads to various types of long (a) and small (b) RNAs are shown. In (a), definitions of RNA types were from the biotypes of Ensembl as follows: mRNA (protein-coding messenger RNA), lincRNA, pseudogenes (processed pseudogene, unprocessed pseudogene, transcribed unprocessed pseudogene, transcribed processed pseudogenes, or pseudogenes), Mt rRNA (mitochondrial ribosomal RNA), misc RNA (non-coding RNA that cannot be classified), others (other remaining biotypes such as antisense, snRNA, snoRNA, processed transcripts). In (b), ‘other exonic’ refers to reads mapped to any exonic regions except miRNA, piRNA, tRNA, and sncRNA and ‘remaining’ refers to mapped reads except miRNA, piRNA, tRNA, scRNA, and ‘other exonic’. sncRNAs include the following three types of RNAs: snoRNA (small nucleolar RNA), snRNA (small nuclear RNA), and sRNA (small RNA). RNAs are plotted as the percentage of quantified transcripts against the expression level (c) and the frequency of transcripts (density) against expression level (d). In (cd), the RPKM values have a pseudo-count (0.0001) added to allow plotting on a logarithmic scale. For the density plot (d), the probability density functions were estimated using kernel density estimation, where the area under the curve equals one. e The placental transcriptome is represented as the cumulative percentage of various RNA biotypes in the current study. f The total mRNAs pool is represented as the cumulative percentage of protein-coding transcripts in 50 tissues, including the placenta. In (ef), each point represents a transcript (with RPKM > 0.1) and the dashed line represents the TA50, i.e., the percentage of transcripts required to reach half of the total transcript abundance. To reach TA50 in (f), the following numbers of protein-coding RNAs are needed: 2 (blood), 7 (pancreas), 110 (liver), 135 (muscle – skeletal), 191 (esophagus – mucosa), 232 (minor salivary gland), and 271 (placenta). g For each tissue, the bar chart shows the contribution of the most abundant 1% of mRNAs to the total pool of protein-coding transcripts.
Fig. 2
Fig. 2. Manhattan plots showing relative abundance of small RNAs.
The relative abundance of individual transcripts, represented by dots, are shown for: a circRNAs, miRNAs, and piRNAs across all chromosomes; b clusters of miRNA on chromosome 19 (C19MC); c a cluster of miRNA, piRNA, and sncRNA on chromosome 14 (C14MC); d a mitochondrial cluster of piRNA. Transcripts within the most abundant 1% of circRNAs and miRNA, and within the most abundant 0.1% of piRNAs are colored orange. The relative abundance of piRNAs and miRNAs are calculated from the mean RPKM values divided by 106. In the C19MC (b) and C14MC (c), miRNAs are colored blue if they are between the most abundant 1 and 5% range. The circRNAs are based on 3,279 circular RNAs predicted to be present in at least 30% of the cohort (POPS30) and their relative abundances are calculated from the normalized back-spliced read counts divided by 104. See Supplementary Data 8, 11, 13, and 14 for abundance details of circRNAs, mature miRNAs, piRNAs, and sncRNAs, respectively.
Fig. 3
Fig. 3. circSTS as a putative miRNA sponge and evidence of peptides translated from circRNAs.
a The back-spliced positions (indicated in yellow arrows) are within the 12th exon (thick rectangle) of a lincRNA (ENST00000658154) encoded by STS. Back-splicing was assayed with divergent primers (top) and confirmed by Sanger sequencing (bottom). The first and last 8-bases, colored in blue (5’) and red (3’) respectively, are flanked by AG/GT (intronic acceptor/donor sites). b The expected size of the back-spliced PCR product from circSTS (170 bp) was validated by qPCR from seven placental samples. RT-: no reverse transcriptase; NTC: no template control. Source data are provided as a Source Data file. c circSTS (chrX:7,514,882-7,516,290) is represented as a black open circle with its putative binding sites for miR-5584-5p (blue) and miR-7113-5p (orange). Its relative base positions are marked for every 100th-base position and 1st, 500th, 1000th, and 1400th positions are numbered. The arrows indicate 5′-to-3′ direction. Sequence motif analyses of miR-5584-5p and miR-7113-p5 are shown in (d) and (e) respectively, with the corresponding sequence miRNAs shown at the bottom. The size of the sequence logo represents how well the binding base is conserved across the 16 predicted binding regions represented in (c). fg Peptidomic evidence for translation of two circRNAs. The putative peptides are in black and the bases on either side of the BSJ are colored in red (5′) and blue (3′). The peptides were translated across the BSJ (indicated by underlines) of circRNAs. h Mass spectrum corresponding to the peptide sequence of (f). On the x-axis, the mass/charge ratio of the peptide fragments is shown, with the intensity on the y-axis. Peaks that can be attributed to b and y-ions (i.e., including the N- and C- termini respectively) of the peptide are indicated with a square and colored in red and blue respectively.
Fig. 4
Fig. 4. Characterization of miRNA-enriched WGCNA network modules 10 and 11.
The eigengene summarizing the transcripts in (a) module 10 was associated with FGR (q-value = 5.8 × 10−5); and (b) module 11 was associated with both FGR (q-value = 1.8 × 10−7; 52 cases and 148 controls) and PE (q-value = 1.1 × 10−3; 88 cases and 148 controls). The q-values were calculated using the ‘qvalue’ Bioconductor package to control the local false discovery rate at the 0.05 level. Significantly overrepresented Gene Ontology (GO, biological process BP; molecular function MF; and cellular component CC), Reactome (REAC), and WikiPathways (WP) terms are shown for (c) module 10; and (d) module 11. For clarity, only GO terms with a shortest root-to-node path of length 4 are shown, and at most, the top 10 hits within each sub-ontology are shown. The enrichment analyses were performed using the R interface to g:Profiler, and adopting the g:SCS correction to control for multiple testing with threshold P = 0.05. All statistical tests were two-sided. Full results are provided in Supplementary Data 28–74. In (a and b), the boxes show the median and the lower and upper quartiles. The whiskers extend from the lowest observed point still within 1.5 times IQR (the interquartile range) of the lower quartile, to the highest observed point still within 1.5 times IQR of the upper quartile. All points beyond the whiskers are plotted as outliers.
Fig. 5
Fig. 5. Circulating maternal levels of FSTL3 at 36 weeks of gestation and adverse pregnancy outcome.
a The association between elevated serum FSTL3 (>97th percentile) and PE or FGR (see “Methods” for definitions), expressed as odds ratios and 95% confidence intervals (95% CI); and b the proportion of samples above 97th percentile (95% CI). This analysis is based on 495 samples (289 controls and 206 cases of which 106 had PE only, 90 had FGR only and 10 had both PE and FGR). The P values were calculated using Fisher’s exact test (two-sided) based on the dichotomized percentile matrix. The exact P value between Control and PE is 4.6 × 10−6 (b).

References

    1. GTEx Consortium. The GTEx Consortium atlas of genetic regulatory effects across human tissues. Science. 2020;369:1318–1330. doi: 10.1126/science.aaz1776. - DOI - PMC - PubMed
    1. Mathers, C., Fat, D. M., Boerma, J. T. & Organization, W. H. The Global Burden of Disease: 2004 Update (World Health Organization, 2008).
    1. Yao RW, Wang Y, Chen LL. Cellular functions of long noncoding RNAs. Nat. Cell Biol. 2019;21:542–551. doi: 10.1038/s41556-019-0311-8. - DOI - PubMed
    1. Fanucchi S, et al. Immune genes are primed for robust transcription by proximal long noncoding RNAs located in nuclear compartments. Nat. Genet. 2019;51:138–150. doi: 10.1038/s41588-018-0298-2. - DOI - PubMed
    1. Sitras V, et al. Differential placental gene expression in severe preeclampsia. Placenta. 2009;30:424–433. doi: 10.1016/j.placenta.2009.01.012. - DOI - PubMed

Publication types

MeSH terms

LinkOut - more resources