. 2021 May 11;12(1):2672.
doi: 10.1038/s41467-021-22618-x.

FUT8-mediated aberrant N-glycosylation of B7H3 suppresses the immune response in triple-negative breast cancer

Affiliations

FUT8-mediated aberrant N-glycosylation of B7H3 suppresses the immune response in triple-negative breast cancer

Yun Huang et al. Nat Commun. .

Abstract

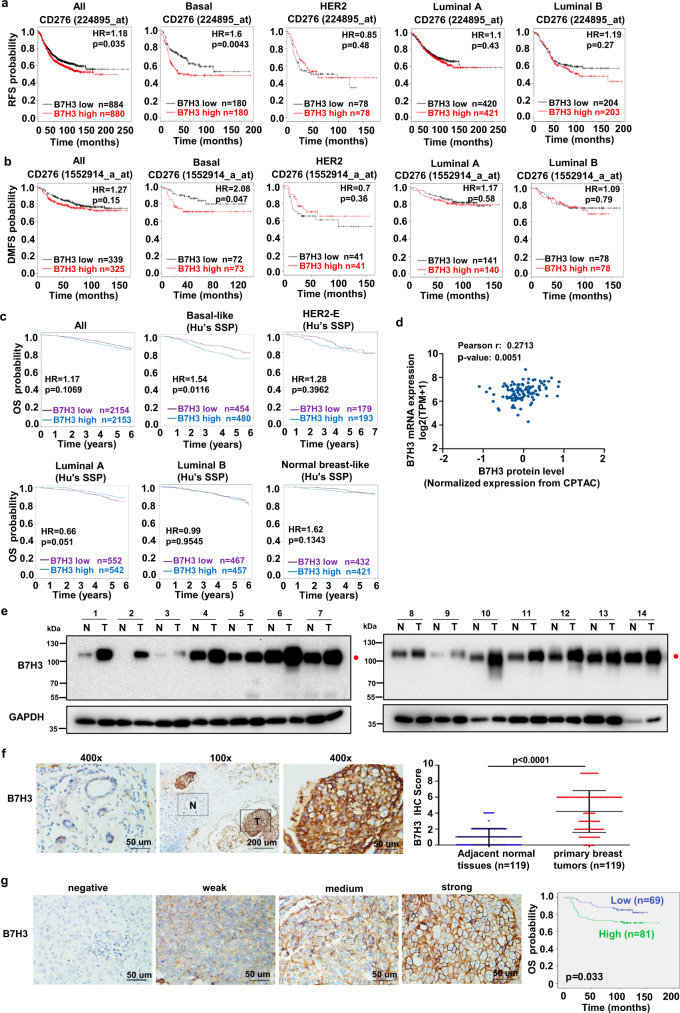
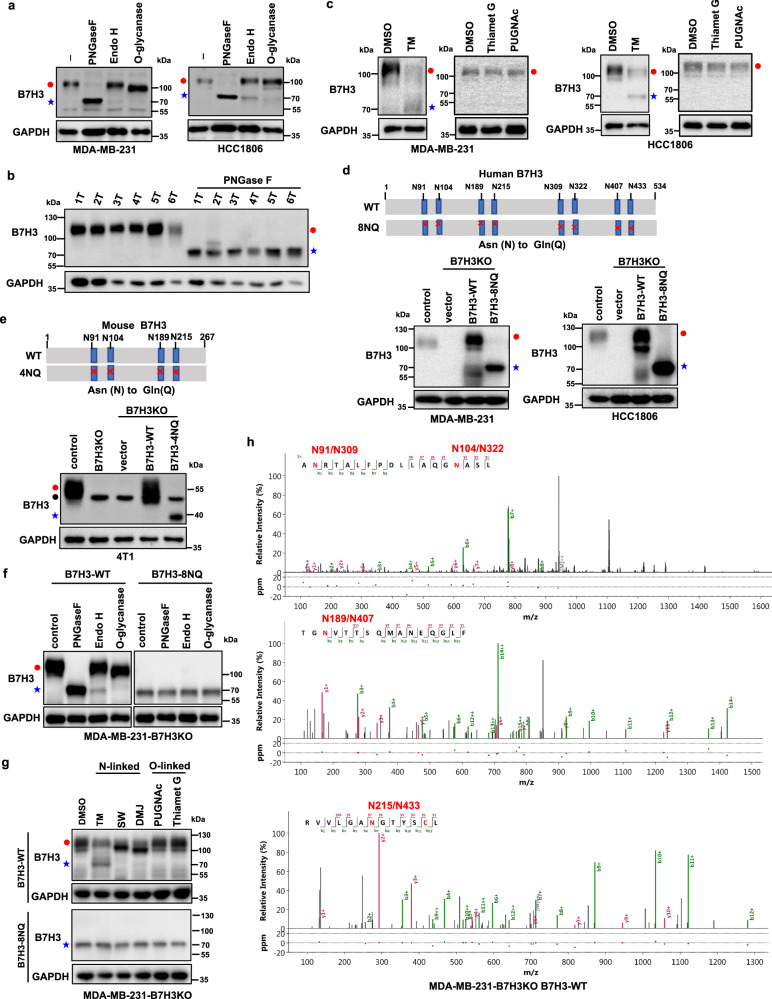
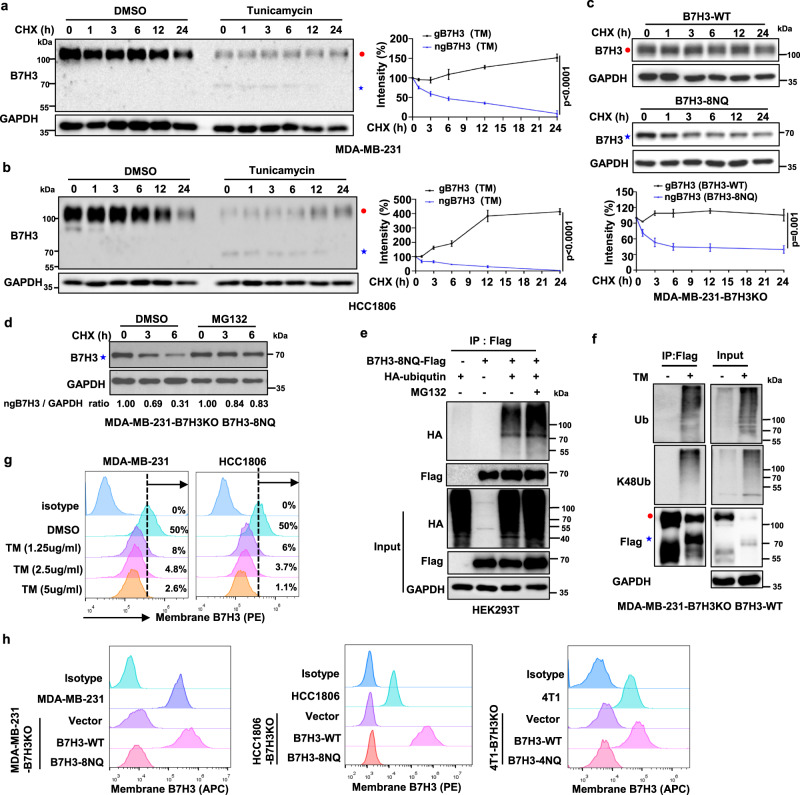
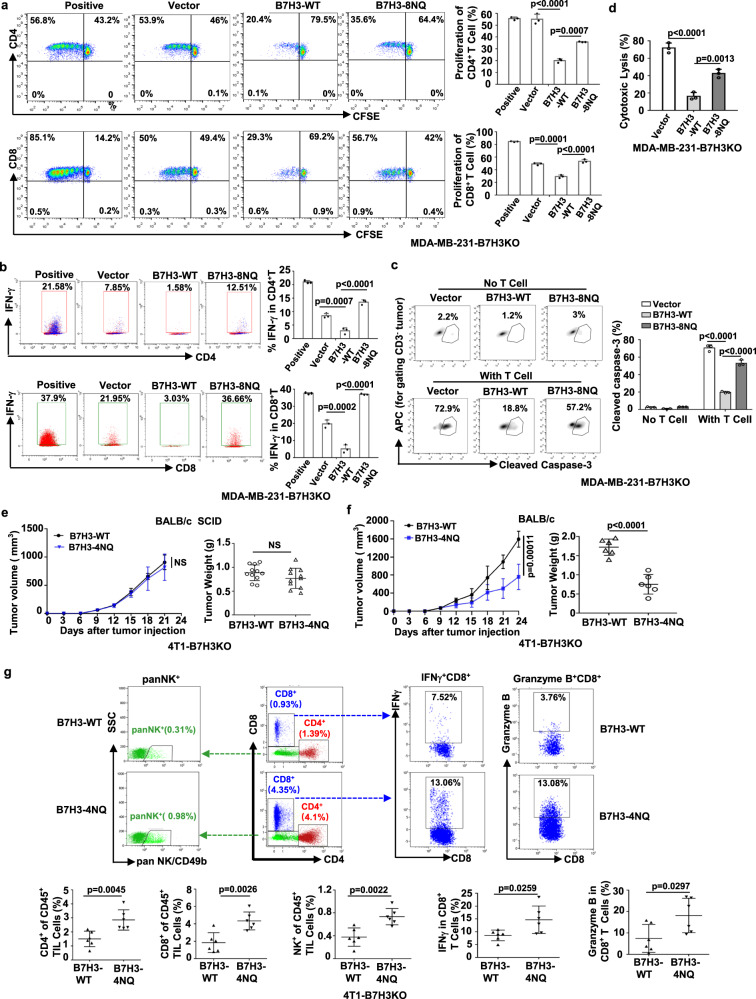
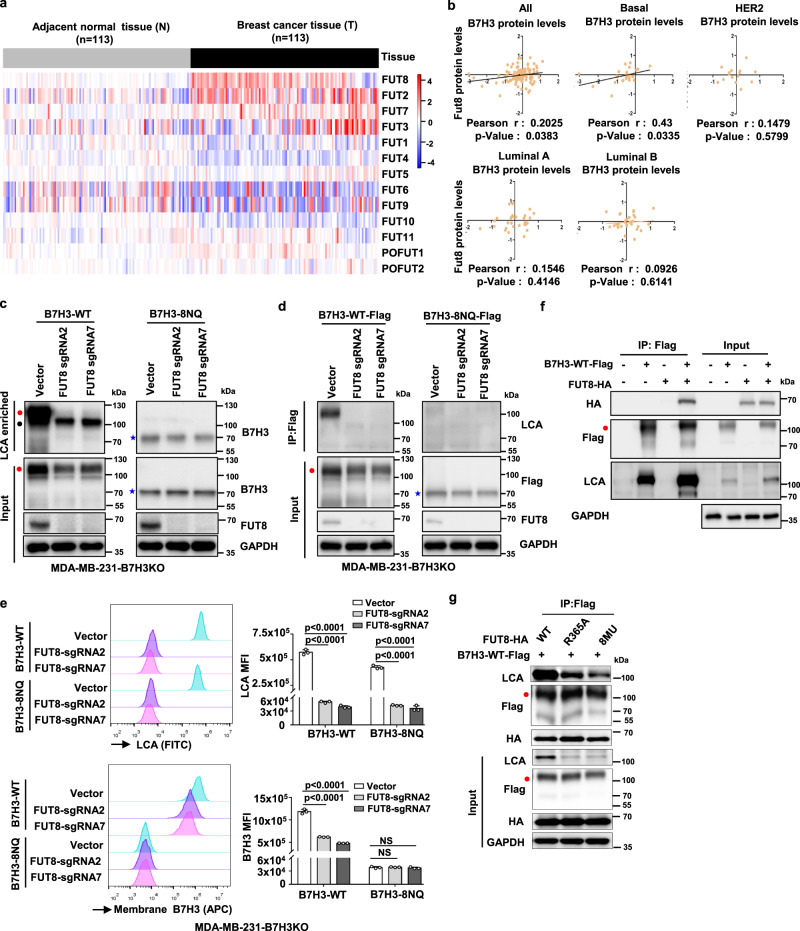
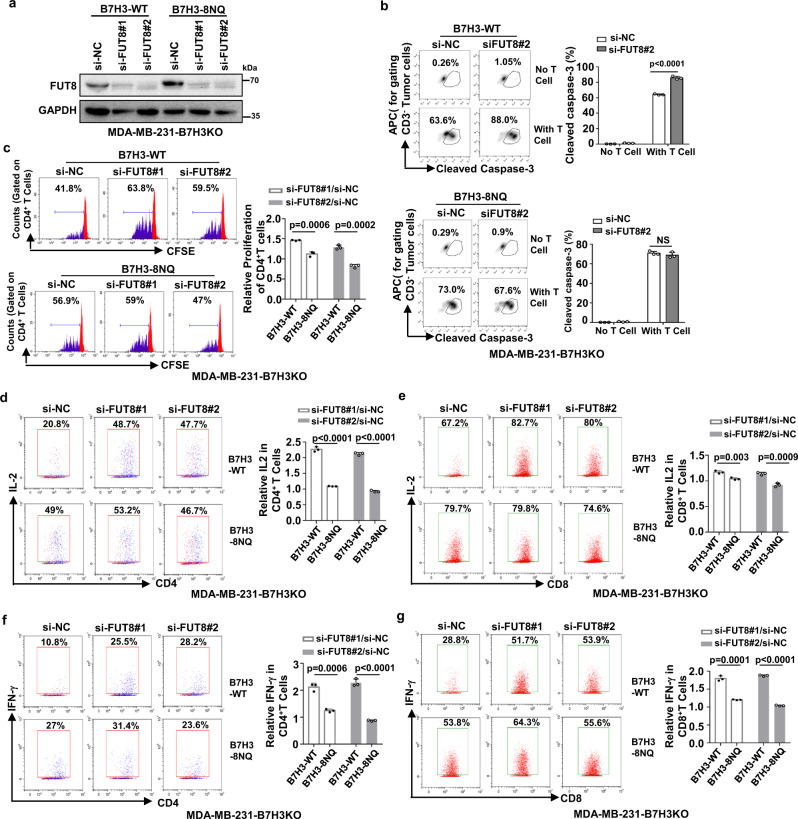
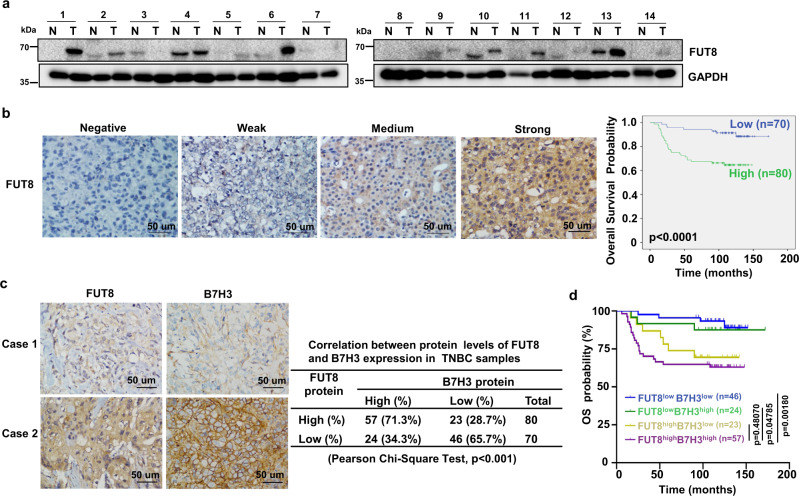
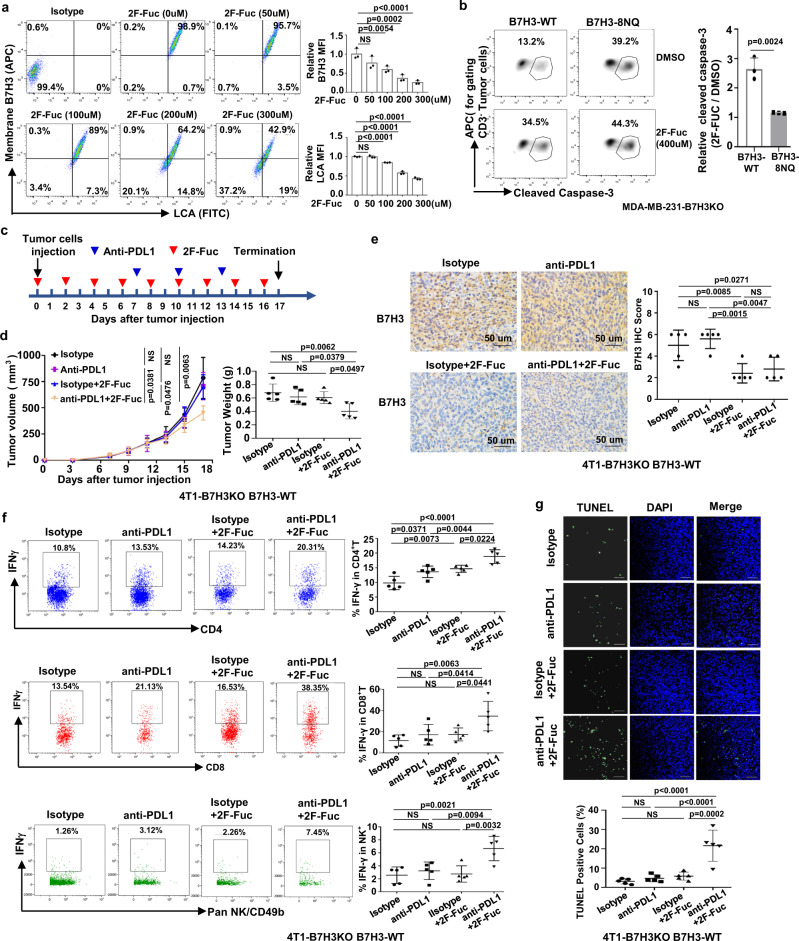
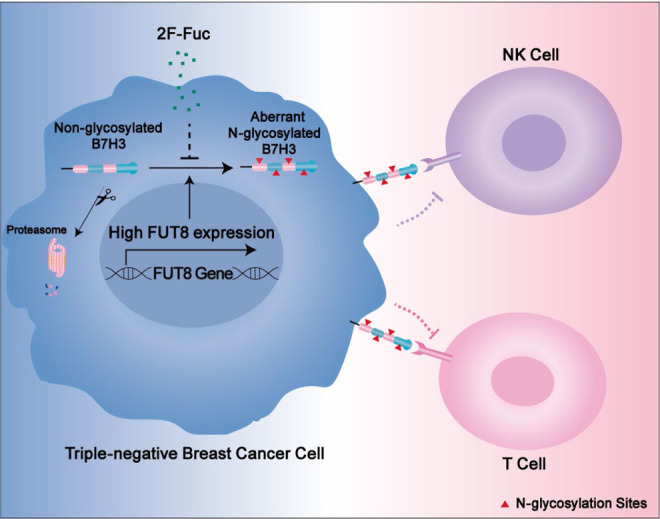
Most patients with triple negative breast cancer (TNBC) do not respond to anti-PD1/PDL1 immunotherapy, indicating the necessity to explore immune checkpoint targets. B7H3 is a highly glycosylated protein. However, the mechanisms of B7H3 glycosylation regulation and whether the sugar moiety contributes to immunosuppression are unclear. Here, we identify aberrant B7H3 glycosylation and show that N-glycosylation of B7H3 at NXT motif sites is responsible for its protein stability and immunosuppression in TNBC tumors. The fucosyltransferase FUT8 catalyzes B7H3 core fucosylation at N-glycans to maintain its high expression. Knockdown of FUT8 rescues glycosylated B7H3-mediated immunosuppressive function in TNBC cells. Abnormal B7H3 glycosylation mediated by FUT8 overexpression can be physiologically important and clinically relevant in patients with TNBC. Notably, the combination of core fucosylation inhibitor 2F-Fuc and anti-PDL1 results in enhanced therapeutic efficacy in B7H3-positive TNBC tumors. These findings suggest that targeting the FUT8-B7H3 axis might be a promising strategy for improving anti-tumor immune responses in patients with TNBC.


Conflict of interest statement

The authors declare no competing interests.

Figures

Fig. 1
Fig. 1. Upregulation of glycosylated B7H3 and its prognostic significance in patients with TNBC.
a, b Kaplan–Meier analyses (two-sided) of RFS (a) and DMFS (b) based on B7H3 mRNA levels, using the KM-plotter breast cancer database (http://kmplot.com/analysis/). All patients were stratified according to intrinsic breast cancer molecular subtypes. Median cutoff was chosen in the analysis. c Kaplan–Meier analyses (two-sided) of OS based on B7H3 mRNA levels. The data were retrieved from Breast cancer Gene-Expression Miner v4.4 (http://bcgenex.centregauducheau.fr/BC-GEM). All patients were stratified according to intrinsic breast cancer molecular subtypes based on Hu’s SSP as indicated. Median cutoff was chosen in the analysis. d The correlation of B7H3 protein level and its mRNA level using breast cancer samples in TCGA. The TCGA mRNA expression data were retrieved from Gene Expression Omnibus (GSE62944). TCGA protein expression data were measured by The Clinical Proteomic Tumor Analysis Consortium (CPTAC), and were downloaded from CPTAC data portal (https://proteomics.cancer.gov/data-portal). The correlation was assessed using Pearson’s correlation test (two-sided). e Expression of B7H3 protein in 14 representative human TNBC fresh samples by immunoblot. N, matched normal tissue; T, tumor tissue. Red closed circle, glycosylated B7H3. f The representative images of strong B7H3 staining in primary TNBC tissues and weak staining in the matched adjacent noncancer tissues (left). Quantitative IHC analysis of B7H3 (right, two-sided). g The representative intensity images for each IHC score of B7H3 staining in TNBC tumor tissues were shown (left). Kaplan–Meier plots of the overall survival of patients, stratified by expression of B7H3 (right, two-sided). Error bars represent mean ± SD. The p value in ac, g was assessed using the log-rank test. The p value in (f) was determined by two-tailed Wilcoxon matched-pairs signed-rank test. The data in (e) are representative of three independent experiments.
Fig. 2
Fig. 2. B7H3 is N-glycosylated at NXT motif sites in TNBC cells.
a Cell lysates from MDA-MB-231 and HCC1806 cells were treated with PNGase F, Endo H, and O-glycanase for 1 h at 37 °C in vitro. b Cell lysates from six TNBC tumors were treated with PNGase F for 1 h at 37 °C in vitro. c MDA-MB-231 and HCC1806 cells were treated with TM (2.5 μg/ml), Thiamet G (50 μM), and PUGNAc (100 μM) for 24 h. d Schematic diagram of human B7H3-8NQ mutants used in this study (upper). Effect of human B7H3 knockout in MDA-MB-231 and HCC1806 cells using CRISPR–Cas9 technology. Then the B7H3KO cells were stably rescued with B7H3-WT-Flag and B7H3-8NQ-Flag cDNA (bottom). e Schematic diagram of mouse B7H3-4NQ mutants used in this study(upper). Effect of mouse B7H3 knockout in 4T1 cells using CRISPR–Cas9 technology. 4T1-B7H3KO cells were stably rescued with B7H3-WT-Flag and B7H3-4NQ-Flag cDNA (bottom). Black closed circle, non-specific band. f Cell lysates from the indicated cell lines were treated with PNGase F, Endo H, and O-glycanase for 1 h at 37 °C in vitro. g The indicated cell lines were treated with N-linked glycosylation inhibitors TM (2.5 μg/ml), SW (5 μg/ml), and DMJ (10 μg/ml), or O-linked glycosylation inhibitors Thiamet G (50 μM) and PUGNAc (100 μM) for 24 h. SW, swainsonine; DMJ, deoxymannojirimycin. h Nano LC-MS/MS of the N-glycans on positions N91, N309, N104, N322, N189, N407, and N215 and N433 of purified human B7H3 protein from wild-type B7H3 re-expressed MDA-MB-231-B7H3KO cells. All data are representative of three independent experiments. Red closed circle, glycosylated B7H3; blue star, non-glycosylated B7H3.
Fig. 3
Fig. 3. N-Glycosylation of B7H3 stabilizes B7H3 protein in TNBC cells.
a, b MDA-MB-231 and HCC1806 cells were treated with 20 μM CHX at indicated intervals in the presence of TM (2.5 μg/ml) or not. The intensity of B7H3 protein was quantified using ImageJ software. c The indicated cell lines were treated with 20 μM CHX at indicated intervals. The intensity of B7H3 protein was quantified using ImageJ software. d B7H3-8NQ mutant re-expressing in MDA-MB-231-B7H3KO cells were treated with MG132 (20 μM) in the presence of CHX (20 μM) at indicated intervals. The intensity of B7H3 protein was quantified using ImageJ software. e HEK293T cells were transiently transfected with the indicated plasmids with or without MG132 treatment for 6 h. Immunoprecipitation analysis of exogenous B7H3-8NQ ubiquitination with the indicated antibodies. f B7H3-WT re-expressing in MDA-MB-231-B7H3KO cells were treated with TM for 24 h. Immunoprecipitation analysis of exogenous B7H3 ubiquitination with the indicated antibodies. g Flow cytometry measuring B7H3 protein on the cell membrane with tunicamycin at different concentrations for 24 h. h Flow cytometry measuring B7H3 protein on the cell membrane in the indicated cell lines. The p value in (ac) was determined by a two-tailed unpaired Student’s t test. Error bars represent mean ± SD. All data are representative of three independent experiments. Red closed circle, glycosylated B7H3; blue star, non-glycosylated B7H3.
Fig. 4
Fig. 4. N-glycosylation of B7H3 inhibits immune responses in TNBC cells.
a, b Left, representative dot plots of in vitro proliferation of T (a) and activation of T (b) measured by fluorescence-activated cell sorting (FACS) as CFSE dilution after 5 days, respectively, of stimulation with anti-CD3 activated T cells alone (positive control) or in the presence of irradiated vector, B7H3-WT or B7H3-8NQ re-expressing in MDA-MB-231-B7H3KO cells. Right, percentage of proliferating CD4+ T, proliferating CD8+ T, IFNγ+CD4+ T and IFNγ+CD8+ T (n = 3 biological independent samples). c The indicated MDA-MB-231-B7H3KO cells were cocultured with CD3/CD28-activated human T-lymphocyte cells. Left, representative dot plots of the cleavage of caspase-3 in tumor cells measured by flow cytometry. Right, percentage of cleaved caspase-3+ tumor cells (n = 3 biological independent samples). d Percent cytotoxicity was assayed by measuring the release of LDH. The indicated MDA-MB-231-B7H3KO cells were cocultured with CD3/CD28-activated human T-lymphocyte cells (n = 3 biological independent samples). e Tumor growth of the indicated mouse 4T1-B7H3KO cells in BALB/c SCID mice. Tumor volumes were calculated (n = 11 mice per group) (left), and tumor weights from experiment on autopsy on day 21 (right). f Tumor growth of indicated mouse 4T1- B7H3KO cells in BALB/c mice. Tumor volumes were calculated (n = 6 mice per group) (left), and tumor weights from experiment on autopsy on day 24 (right). g FACS analysis of CD4+T, CD8+T, panNK+, IFNγ+, and Granzyme B+ in CD8+ T-cell populations from the isolated TILs in (f). Upper, representative dot plots from a representative mouse for each group. Bottom, the percentage of TILs for each group (n = 6 mice per group). Error bars represent mean ± SD. The p value in (ad) was determined by one-way ANOVA with Dunnett’s multiple comparisons test, no adjustments were made for multiple comparisons. The p value in (eg) was determined by a two-tailed unpaired Student’s t test. NS, not significance. Data are representative of three independent experiments.
Fig. 5
Fig. 5. FUT8 is involved in the core fucosylation process of B7H3.
a The heatmap of 13 fucosyltransferases (FUTs) mRNA expression in breast cancer. The RNA-Seq gene count data of 113 pairs of breast cancer samples and matched adjacent normal samples were retrieved from Gene Expression Omnibus (GSE62944), and further normalized using DESeq2 variance-stabilizing transformation. The heatmap was plotted with relative expression values, which were calculated as fold change to the average expression level in adjacent normal breast tissues. b The correlation between B7H3 and FUT8 at protein levels. Mass spectrometry-based proteomics data for TCGA samples were measured by The Clinical Proteomic Tumor Analysis Consortium (CPTAC), and were downloaded from CPTAC data portal (https://proteomics.cancer.gov/data-portal). All patients were stratified according to PAM50 subtypes as indicated. The relationship was assessed using Pearson’s chi-square test. c LCA affinity of whole-cell lysate of the indicated MDA-MB-231-B7H3KO cell lines by western blot with anti-B7H3. Black closed circle, non-specific band. d Lectin blotting of B7H3 for detecting fucosylation status. Fucosylation of B7H3 in the indicated MDA-MB-231-B7H3KO cell lines expressing sgRNAs targeting FUT8 was probed with LCA after exogenous B7H3 was immunoprecipitated. e Left: Representative images of LCA binding (core fucose) and membrane B7H3 in the indicated MDA-MB-231-B7H3KO cell lines measured by FACS. Right: LCA Median Fluorescence Intensity (MFI) and B7H3 MFI were plotted (n = 3 biological independent samples). Error bars represent mean ± SD. The p value was determined by one-way ANOVA with Dunnett’s multiple comparisons test, no adjustments were made for multiple comparisons. NS, not significance. f HEK293T cells were transiently transfected with Flag-tagged B7H3-WT and HA-tagged FUT8, followed by immunoprecipitation with anti-Flag beads and immunoblot analysis with anti-HA and LCA. g HEK293T cells were transiently transfected with Flag-tagged B7H3-WT and HA-tagged FUT8 or its mutants, followed by immunoprecipitation with anti-Flag beads and immunoblot analysis with anti-HA and LCA. Data are representative of three independent experiments. Red closed circle, glycosylated B7H3; blue star, non-glycosylated B7H3.
Fig. 6
Fig. 6. Knockdown of FUT8 in TNBC cells enhances T-cell proliferation and activation.
a The indicated MDA-MB-231-B7H3KO cells were transiently transfected with FUT8 siRNA for 48 h. The knockdown efficiency was analyzed by immunoblotting. b The indicated MDA-MB-231-B7H3KO cells were transiently transfected with FUT8 siRNA for 48 h, then cocultured with CD3/CD28-activated human T-lymphocyte cells for another 6 h. Left: representative dot plots of the cleavage of caspase-3 in tumor cells measured by flow cytometry. Right: percentage of cleaved caspase-3+ tumor cells (n = 3 biological independent samples). cg Left: representative dot plots of in vitro activation of T measured by FACS as CFSE dilution after 5 days, respectively in the presence of irradiated B7H3-WT or B7H3-8NQ re-expressing in MDA-MB-231-B7H3KO cells. Right: percentage of proliferating CD4+ T (c), activation of IL2+CD4+ T (d), IL2+CD8+ T (e), IFNγ+CD4+ T (f), and IFNγ+CD8+ T (g) (n = 3 biological independent samples). Error bars represent mean ± SD. The p value in bg was determined by a two-tailed unpaired Student’s t test. NS, not significance. Data are representative of three independent experiments.
Fig. 7
Fig. 7. Correlations among FUT8 and B7H3 expression in TNBC tissues.
a Expression of FUT8 protein in 14 representative human TNBC fresh samples by immunoblot. N, matched normal tissue; T, tumor tissue. b The representative intensity images for each IHC score of FUT8 staining in TNBC tumor tissues were shown (left). Kaplan–Meier plots of the overall survival of patients, stratified by protein expression of FUT8 (right). The p value was assessed using the log-rank test (two-sided). c The representative images for B7H3 staining in two patients with FUT8 expression (left). Case 1 showed low expression of FUT8 with low expression of B7H3. Case 2 showed high expression of FUT8 with high expression of B7H3. The correlation of B7H3 with FUT8 expression status in TNBC patient tumors (right). The relationship was assessed using Pearson’s chi-square test. d Kaplan–Meier plots of the overall survival of patients, stratified by protein expression of both B7H3 and FUT8. The p value was assessed using the log-rank test and further corrected with the Benjamini–Hochberg method (two-sided).
Fig. 8
Fig. 8. 2F-Fuc sensitizes anti-tumor immune responses in glycosylated B7H3-positive TNBC tumors.
a Left: representative dot plots of flow cytometry measuring the LCA core fucose binding and B7H3 on the membrane of MDA-MB-231 cells treated with different concentrations of 2F-Fuc for 4 days. Right: the relative B7H3 and LCA MFI in cells (n = 3 biological independent samples). b The indicated MDA-MB-231-B7H3KO cells were cocultured with CD3/CD28-activated human T-lymphocyte cells. Left, representative dot plots of the cleavage of caspase-3 in tumor cells measured by flow cytometry. Right, percentage of cleaved caspase-3+ tumor cells (n = 3 biological independent samples). c, d Tumor growth of B7H3-WT re-expressed 4T1-B7H3KO cells in BALB/c mice following treatment with 2F-Fuc treatment and anti-PDL1 antibody (n = 5 mice per group). The treatment protocol is summarized by the arrows (c). Tumor volumes were calculated (d, left), and tumor weights from experiment on autopsy (d, right). e Representative images of IHC staining of B7H3 expression in B7H3-WT re-expressed 4T1-B7H3KO xenograft tumor sections after treatment (left, n = 5 mice per group). HPF, ×400 magnification. Quantitative IHC analysis of B7H3 (right). f FACS analysis of IFNγ+ in CD4+T, CD8+ T, and NK cell populations from the isolated TILs in (d) (right, n = 5 mice per group). Representative dot plots from a representative mouse for each group (left). g Representative images of TUNEL staining (green) of formalin-fixed paraffin-embedded tumor sections after treatment in (d) (upper, n = 5 mice per group). Quantification of positive TUNEL cells (bottom). The apoptotic cells with DNA fragmentation were stained positively as green nuclei. Scar bar, 50 μm. Error bars represent mean ± SD. The p value in (a) was determined by one-way ANOVA with Dunnett’s multiple comparisons test, the p value in (dg) was determined by one-way ANOVA with Tukey’s multiple comparisons test, no adjustments were made for multiple comparisons. The p value in b was determined by a two-tailed unpaired Student’s t test. NS, not significance. Data are representative of two independent experiments.
Fig. 9
Fig. 9. Proposed model of resistance to immune response through FUT8-mediated aberrant N-glycosylation of B7H3 in TNBC cells.
In TNBC cells, FUT8 catalyzes aberrant B7H3 core fucosylation at N-linked oligosaccharides, which is essential for B7H3 stability and expression on the cell surface, resulting in the resistance of tumor cells to immune attack. Inhibition of B7H3 core fucosylation by 2F-Fuc reduces cell-surface expression of B7H3 and enhances T-cell activation, leading to more efficient tumor eradication.

Similar articles

Cited by

References

    1. Marra A, Viale G, Curigliano G. Recent advances in triple negative breast cancer: the immunotherapy era. BMC Med. 2019;17:90. doi: 10.1186/s12916-019-1326-5. - DOI - PMC - PubMed
    1. Oner G, et al. Triple-negative breast cancer—role of immunology: a systemic review. Breast J. 2020;26:995–999. doi: 10.1111/tbj.13696. - DOI - PubMed
    1. Wang H, et al. Biomaterial-based scaffold for in situ chemo-immunotherapy to treat poorly immunogenic tumors. Nat. Commun. 2020;11:5696. doi: 10.1038/s41467-020-19540-z. - DOI - PMC - PubMed
    1. Aktas BY, Taban H, Aksoy S. Atezolizumab and nab-paclitaxel in advanced triple-negative breast cancer. N. Engl. J. Med. 2019;380:985–986. doi: 10.1056/NEJMc1900150. - DOI - PubMed
    1. Keenan TE, Tolaney SM. Role of immunotherapy in triple-negative breast cancer. J. Natl Compr. Canc Netw. 2020;18:479–489. doi: 10.6004/jnccn.2020.7554. - DOI - PubMed

Publication types

MeSH terms