. 2021 May 11;12(1):2582.
doi: 10.1038/s41467-021-22885-8.

Targeting Treg cells with GITR activation alleviates resistance to immunotherapy in murine glioblastomas

Affiliations

Targeting Treg cells with GITR activation alleviates resistance to immunotherapy in murine glioblastomas

Zohreh Amoozgar et al. Nat Commun. .

Abstract

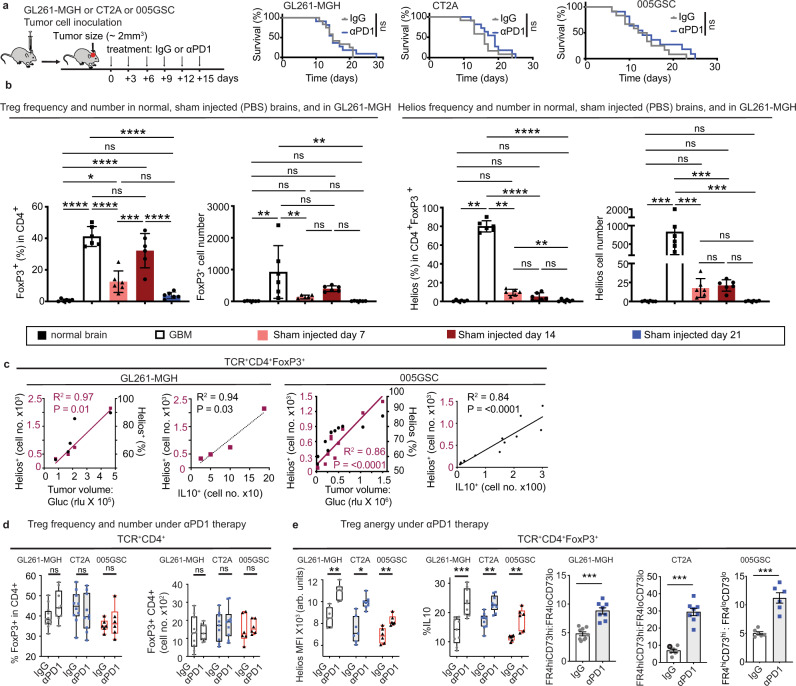
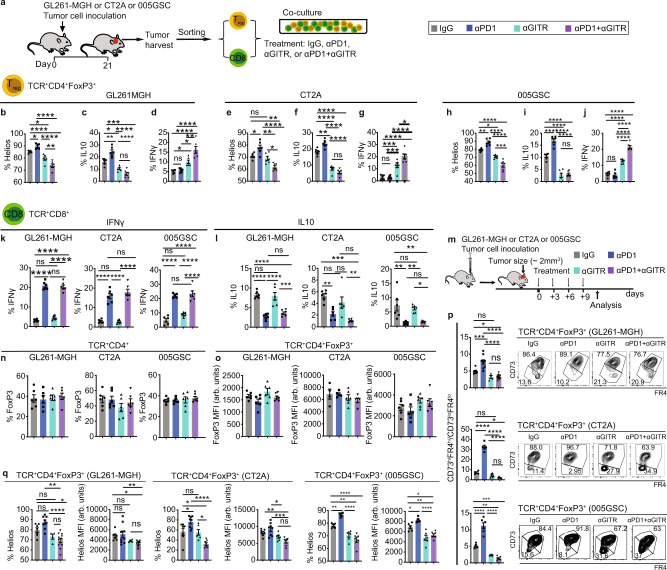
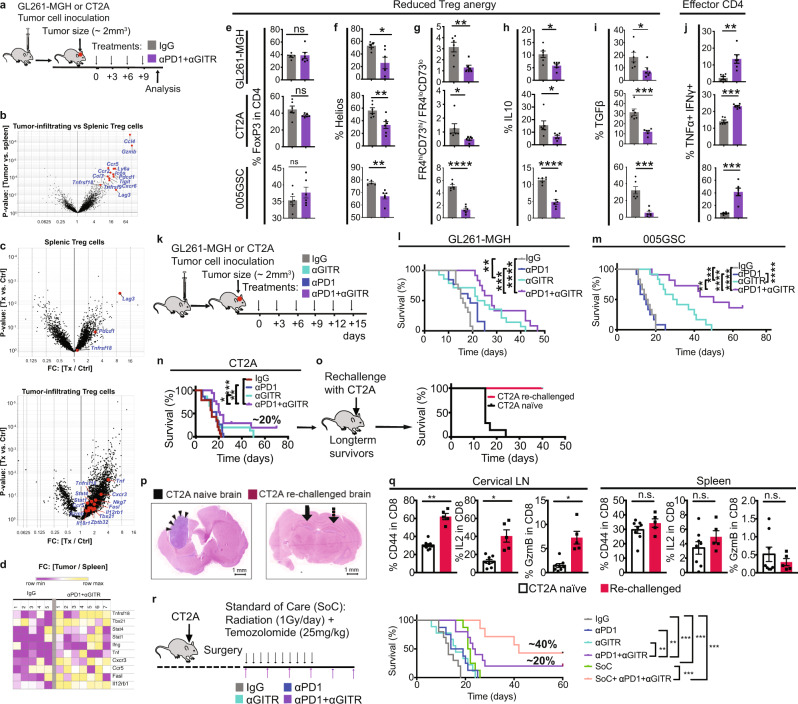
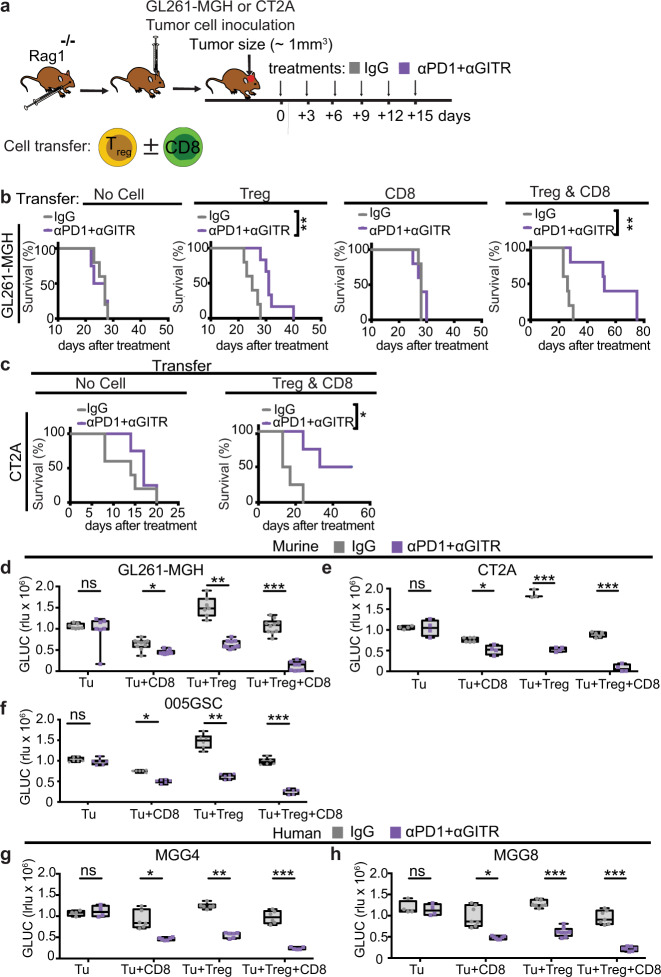
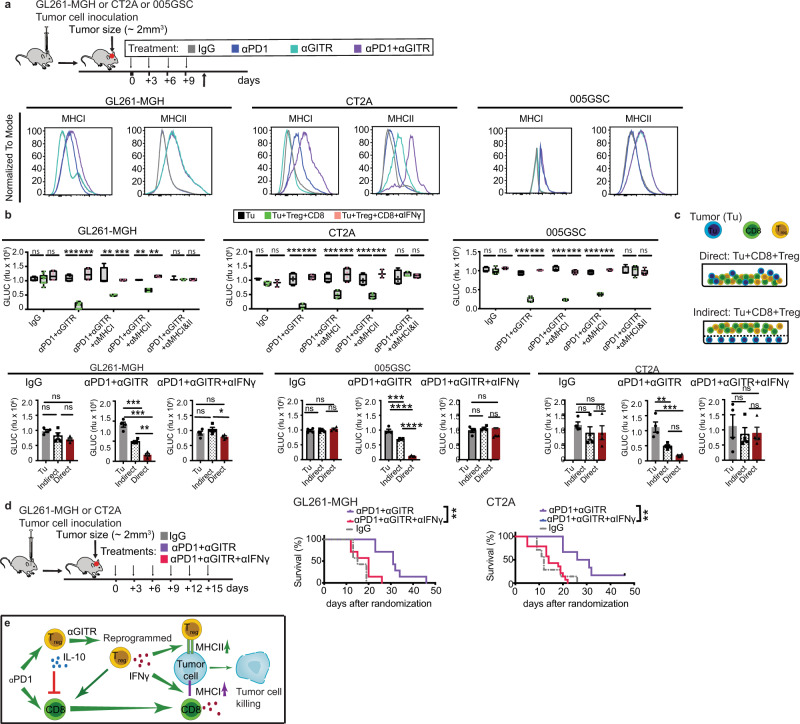
Immune checkpoint blockers (ICBs) have failed in all phase III glioblastoma (GBM) trials. Here, we show that regulatory T (Treg) cells play a key role in GBM resistance to ICBs in experimental gliomas. Targeting glucocorticoid-induced TNFR-related receptor (GITR) in Treg cells using an agonistic antibody (αGITR) promotes CD4 Treg cell differentiation into CD4 effector T cells, alleviates Treg cell-mediated suppression of anti-tumor immune response, and induces potent anti-tumor effector cells in GBM. The reprogrammed GBM-infiltrating Treg cells express genes associated with a Th1 response signature, produce IFNγ, and acquire cytotoxic activity against GBM tumor cells while losing their suppressive function. αGITR and αPD1 antibodies increase survival benefit in three experimental GBM models, with a fraction of cohorts exhibiting complete tumor eradication and immune memory upon tumor re-challenge. Moreover, αGITR and αPD1 synergize with the standard of care treatment for newly-diagnosed GBM, enhancing the cure rates in these GBM models.


Conflict of interest statement

R.K.J. received an honorarium from Amgen; consultant fees from Chugai, Merck, Ophthotech, Pfizer, SPARC, SynDevRx, XTuit; owns equity in Accurius, Elpis, Enlight, and SynDevRx; and serves on the Boards of Trustees of Tekla Healthcare Investors, Tekla Life Sciences Investors, Tekla Healthcare Opportunities Fund, Tekla World Healthcare Fund, and a grant from Boehringer Ingelheim. A.K.S. received compensation for consulting and/or SAB membership from Merck, Honeycomb Biotechnologies, Cellarity, Cogen Therapeutics and Dahlia Biosciences. No reagents or funding from these organizations was used in this study. The other authors have no competing interests to declare.

Figures

Fig. 1
Fig. 1. αPD1 monotherapy does not prolong GBM survival but increases Treg cell anergy in GBM tumors.
a Schematic representation of experimental setup to evaluate the effect of IgG2a (isotype control) or αPD1 therapy on the survival of GL261-MGH (n = 12), CT2A (n = 12), and 005GSC (n = 13) GBM-bearing mice (two independent repeats of survival assessment). Median survival for GL261-MGH [IgG2a (15 days), αPD1 (15 days), p = 0.760], CT2A [IgG2a (16 days), αPD1(19 days), p = 0.1730], 005GSC [IgG2a (13 days), αPD1 (13 days), p = 0.3479]. b Treg cells’ frequency (% of FoxP3+ cells in CD4 T cells) (left) and number (second panel) in the normal brain compared to tumor tissue (GL261-MGH), and PBS injection at days 7, 14 and 21 post injection. Correlation of Helios+ GBM Treg cells (cell number (third panel from right) and frequency (right panel) in the normal brain, GL261-MGH tumors, and sham injected brain at days 7,14 and 21 quantified by FACS (n = 6 biological replicate). Data presented are mean ± SEM. P < 0.0001 by ordinary one-way ANOVA test and were corrected for multiple comparisons using the Tukey adjustment. For between group analysis post-Tukey, Statistical significance is shown as *p < 0.05, **p < 0.01, ***p < 0.001, ****p < 0.0001. c Correlation of Helios+ GBM Treg cells (cell number and frequency) with tumor volume (purple left Y-axis; black right Y-axis, respectively) (left for both GL261-MGH and 005GSC) and correlation of Helios expressing Treg cells with IL10 expressing Treg cells (right for both GL261-MGH and 005GSC) cell numbers in GBM) (GL261-MGH n = 5, 005GSC n = 11), using linear regression analysis. d Treg cell frequency(left) [GL261-MGH (IgG n = 12, αPD1 n = 9); CT2A (IgG n = 10, αPD1 n = 10); 005GSC (IgG n = 6, αPD1 n = 6)]. and cell numbers (right) [GL261-MGH (IgG n = 10, αPD1 n = 10); CT2A (IgG n = 10, αPD1 n = 10); 005GSC (IgG n = 6, αPD1 n = 6)], quantified by FACS. Data presented are mean ± SEM. P = 0.0011 by ordinary one-way ANOVA test and were corrected for multiple comparisons using the Tukey adjustment. For between group analysis post-Tukey, stars were assigned as *p < 0.05, **p < 0.01, ***p < 0.001. The line in the middle of the box and whisker graph represents the median (50th percentile). The box extends from the 25th to 75th percentile. The whiskers extend from the lowest to the highest value. e Helios expression and mean fluorescence intensity (MFI) of Helios (left) [GL261-MGH (IgG n = 7, αPD1 n = 7); CT2A (IgG n = 7, αPD1 n = 8); 005GSC (IgG n = 6, αPD1 n = 6)], percentage of IL10 positive cells (middle) [GL261-MGH (IgG n = 9, αPD1 n = 9); CT2A (IgG n = 9, αPD1 n = 9); 005GSC (IgG n = 6, αPD1 n = 6)], and the ratio of FR4hiCF73hi to FR4loCF73lo in tumor infiltrating Treg cells (right) [GL261-MGH (IgG n = 9, αPD1 n = 8); CT2A (IgG n = 7, αPD1 n = 8); 005GSC (IgG n = 6, αPD1 n = 6)] quantified by FACS. Data presented are mean ± SEM. P < 0.0001 by ordinary one-way ANOVA test and were corrected for multiple comparisons using the Tukey adjustment. The line in the middle of the box and whisker graph represents the median (50th percentile). The box extends from the 25th to 75th percentile. The whiskers extend from the lowest to the highest value. For between group analysis of Helios MFI and IL 10 post-Tukey, stars were assigned as *p < 0.05, **p < 0.01, ***p < 0.001. Two-tailed unpaired t-test for the ratio of FR4hiCF73hi to FR4loCF73lo, ***p < 0.001 [(GL261-MGH, 95% confidence interval 2.667–5.346, t = 6.376, df = 15), (CT2A, 95% confidence interval 17.34–27.68, t = 9.412, df = 13), (005GSC, 95% confidence interval 4.092–8.259, t = 6.472, df = 10)]. Source data are provided as a Source Data file.
Fig. 2
Fig. 2. Engagement of GITR with an agonistic antibody (αGITR) converts Treg cells to CD4 T effector cells.
a Schematic representation of the ex vivo treatment experiments of Treg cells and CD8 T cells derived from tumor-bearing mice. Tumors [GL261-MGH (n = 24), CT2A (n = 25), 005GSC (n = 20)] were inoculated and harvested 21 days post-inoculation. Treg cells and CD8 T cells were sorted using FACS. CD8 T cells (2 × 103) were co-cultured with Treg cells (2 × 103), accompanied by treatment with (i) IgG2a (isotype control), (ii) αPD1, (iii) αGITR, or (iv) αGITR + αPD1 (n = 6 per treatment, 1 treatment, 20 µg/mL for each antibody). bj Treg cells (day 4) were analyzed for expression of Helios (b, e, h), and cytokines IL10 (c, f, i) and IFNγ (d, g, j). (n = 6 biological replicates for each treatment), Data presented are mean ± SEM. P < 0.0001 by ordinary one-way ANOVA test and were corrected for multiple comparisons using the Tukey adjustment for (bj). Stars were assigned as *p < 0.05, **p < 0.01, ***p < 0.001, ****p < 0.0001. k, l CD8 T cells were analyzed for the production of cytokines IFNγ (K) and IL10 (L) (n = 6 biological replicates for each treatment). Data presented are mean ± SEM. P < 0.0001 by ordinary one-way ANOVA test and were corrected for multiple comparisons using the Tukey adjustment (k & l). Stars were assigned as *p < 0.05, **p < 0.01, ***p < 0.001, ****p < 0.0001. m Schematic representation of experimental protocol. Mice bearing orthotopic GBM tumors (GL261-MGH, CT2A or 005GSC, size ~2 mm3) were treated with 4 doses of: (i) IgG2a, (ii) αPD1, (iii) αGITR, or (iv) αGITR + αPD1 (250 µg/mice). no Intratumoral T cells were analyzed for Treg cell frequency (n) and FoxP3 MFI (o). Data presented are mean ± SEM. P > 0.05 by ordinary one-way ANOVA test. Treg frequency data (n), was a collection of 6 biological replicates per treatment arm. MFI of FoxP3 (o) n = 6 biological replicates across the tumor models and treatment arms excluding IgG treatment in CT2A (n = 4 biological replicates), αPD1 (n = 5 biological replicates) and αGITR (n = 7 biological replicates). Data points are not significantly different from each other (no). p Intratumoral Treg cells were analyzed for the co-expression of CD73 and FR4. GL261-MGH (IgG n = 7, αPD1 n = 9, αGITR n = 4, αPD1 + αGITR n = 11), CT2A (IgG n = 4, αPD1 n = 5, αGITR n = 6, αPD1 + αGITR n = 5), 005GSC (IgG n = 6, αPD1 n = 6, αGITR n = 6, αPD1 + αGITR n = 6). Data presented are mean ± SEM. P < 0.0001 by ordinary one-way ANOVA test and were corrected for multiple comparisons using the Tukey adjustment. Stars were assigned as *p < 0.05, **p < 0.01, ***p < 0.001, ****p < 0.0001. q Intratumoral Treg cells were analyzed for as well as expression of transcription factor Helios GL261-MGH (IgG n = 7, αPD1 n = 9, αGITR n = 4, αPD1 + αGITR n = 11), CT2A (IgG n = 7, αPD1 n = 8, αGITR n = 6, αPD1 + αGITR n = 7), 005GSC (IgG n = 6, αPD1 n = 6, αGITR n = 6, αPD1 + αGITR n = 6) and Helios MFI GL261-MGH (IgG n = 7, αPD1 n = 8, αGITR n = 4, αPD1 + αGITR n = 11), CT2A (IgG n = 7, αPD1 n = 8, αGITR n = 6, αPD1 + αGITR n = 7), 005GSC (IgG n = 6, αPD1 n = 6, αGITR n = 6, αPD1 + αGITR n = 6). Data presented are mean ± SEM. P < 0.0001 (GL261-MGH and 005GSC, Helios frequency, & MFI, and CT2A Helios frequency), P = 0.0003 (CT2A Helios MFI) by ordinary one-way ANOVA test and were corrected for multiple comparisons using the Tukey adjustment. Stars were assigned as *p < 0.05, **p < 0.01, ***p < 0.001, ****p < 0.0001. Source data are provided as a Source Data file.
Fig. 3
Fig. 3. αPD1 + αGITR converts GBM Treg cells to Th1 effector T cells leading to enhanced survival and CD8 T cell memory phenotype in mice.
a Schematic representation of experimental protocol, where mice bearing orthotopic GL261-MGH, CT2A, or 005GSC tumors and treated with 4 doses of either IgG2a (isotype control), or αGITR + αPD1 (n = 6, day 10 post-randomization and treatment). Spleen and tumors were harvested, and cells were sorted for Treg cells. bd RNA-seq analysis was performed on GBM Treg cells and spleens of IgG2a (isotype control, n = 5) vs. αGITR + αPD1 treated CT2A bearing animals (n = 7). b Volcano plots showing differentially expressed genes (DEGs) between spleen and GBM Treg cells treated with IgG2a. c Volcano plot showing DEGs between Treg cells from mice treated with IgG2a or αGITR + αPD1 in the spleen (Top panel) and GBM (lower panel). Genes of interest are highlighted. d Heatmap of representative Th1 genes expressed in GBM Treg cells upon IgG2a (left) or αGITR + αPD1 (right) treatment. ej Intratumoral Treg cells in mice bearing orthotopic GL261-MGH, CT2A, or 005GSC tumors and treated with 4 doses of either IgG2a (isotype control) or αGITR + αPD1 (n = 6 biological replicate, day 10 post-randomization and treatment) analyzed by flow cytometry for (e) Treg cell frequency [(GL261-MGH, P = 0.8819), (CT2A, P = 0.1108), (005GSC, P = 0.2753)] (f) expression of Helios [(GL261-MGH, P = 0.0173, 95% confidence interval:−48.63 to −5.949), (CT2A, P = 0.009, 95% confidence interval:), (005GSC, P = 0.0016, confidence interval:−16.41 to −5.383)], (g) co-expression of CD73 and FR4 [(GL261-MGH, P = 0.0034, 95% confidence interval: −2.930 to −0.7693), (CT2A, P = 0.0455, 95% confidence interval: −38.89 to −7.140), (005GSC, p < 0.001, confidence interval:−4.544 to −2.939)], (h) production of IL-10 [(GL261-MGH, P = 0.0108, 95% confidence interval: −7.707 to −1.293), (CT2A, P = 0.0329, 95% confidence interval: −17.11 to −0.8946), (005GSC, p < 0.001, confidence interval: −8.447 to −4.595)], (i) TGFβ [(GL261-MGH, P = 0.0362, 95% confidence interval: −20.59 to −0.8395), (CT2A, P = 0.0002, 95% confidence interval: −27.18 to −11.58), (005GSC, P = 0.0002, confidence interval:−37.65 to −16.17)], and (j) coproduction of IFNγ and TNFα [(GL261-MGH, P = 0, 95% confidence interval: 0.2742–19.22), (CT2A, p < 0.001, 95% confidence interval: 6.848–11.15), (005GSC, P = 0.0002, confidence interval: 20.87–47.81)]. Two-tailed unpaired t-test for these analyses, and stars were assigned as *p < 0.05, **p < 0.01, ***p < 0.001, ****p < 0.0001. k Schematic representation of the experimental protocol. ln Mice bearing orthotopic GBM tumors (GL261-MGH, 005GSC or CT2A, size ~2 mm3) were treated with six doses of (i) IgG2a, (ii) αPD1, (iii) αGITR, or (iv) αGITR + αPD1 (250 µg/mice for each antibody) and monitored for survival, (Survival study repeated two times). GL261-MGH [(IgG n = 13 and median survival 16 days), (αPD1 n = 13 and median survival 19 days), (αGITR n = 14 and median survival 23.5 days), (αPD1 + αGITR n = 12 median survival 28 days)], CT2A ([(IgG n = 14 and median survival 14 days), (αPD1 n = 15 and median survival 18 days), (αGITR n = 15 and median survival 18 days), (αPD1 + αGITR n = 13 median survival 21 days), 005GSC ([(IgG n = 12 and median survival 15.5 days), (αPD1 n = 12 and median survival 14.5 days), (αGITR n = 12 and median survival 30 days), (αPD1 + αGITR n = 11 median survival 50 days). Statistical significance is shown as *p < 0.05, **p < 0.01, ***p < 0.001, ****p < 0.0001. o Long-term survivors (4 out of 24 mice) with no evidence of residual CT2A tumors in the CT2A cohort were re-challenged with CT2A cells in the contralateral hemisphere of the brain and compared with CT2A naïve mice (n = 7) that were inoculated with CT2A tumor. Survival data is representative of 2 independent experiments. CT2A naïve (median survival of 15 days), and CT2A-rechallenged (not applicable). p Arrows indicate the tumor inoculation region in the brain. Histology of brains from tumor-bearing brains (left) where arrowheads indicate a tumor, and CT2A re-challenged mice (right) where the arrow indicates the primary injection site, and the dashed arrow indicates the secondary injection site. q Levels of activation and cytokine production by CD8 T cells from spleen and cervical LNs of re-challenged mice (n = 5) and CT2A naïve mice (n = 8, day 12 post-randomization). Two-tailed unpaired t-test for these analyses, and stars were assigned as *p < 0.05, **p < 0.01, ***p < 0.001, ****p < 0.0001. Draining Lymph node: [(%CD44 in CD8, p < 0.0001, 95% confidence interval: 24.38–39.23), (%IL2 in CD8, P = 0.0006, 95% confidence interval: 15.22–41.17), (%GzmB in CD8, p = 0.0004, confidence interval: 3.282–8.318)] and Spleen: [(%CD44 in CD8, P = 0.2537), (%IL2 in CD8, P = 0.2538), (%GzmB in CD8, p = 0.4357)]. r Schematic representation of experimental protocol where mice bearing orthotopic CT2A tumors received tumor resection, followed by treatment with IgG2a (control, n = 8), αPD1 (n = 8), αGITR (n = 9), αGITR + αPD1 (n = 8), clinically relevant standard of care (SoC, n = 8) consisting of cranial radiation therapy (1 Gy per day for 10 days) and concomitant daily chemotherapy with temozolomide 25 mg (i.p. for 10 days) or combination treatment with surgery, or chemo-radiation plus αGITR + αPD1 therapy (n = 7). Kaplan–Meier survival estimates were compared using the Mantel–Cox log-rank test as well as the Gehan–Breslow–Wilcoxon test. P values for tumor viability were calculated using unpaired t-tests. *p < 0.05, **p < 0.01, ***p < 0.001. CT2A ([(IgG median survival 8 days), (αPD1 median survival 9 days), (αGITR median survival 22.5 days), (αPD1 + αGITR median survival 21.5 days), (SoC median survival 14 days), (SoC+αGITR + αPD1 median survival 42 days)]. Source data are provided as a Source Data file.
Fig. 4
Fig. 4. CD4 Treg cells are sufficient to elicit the therapeutic effect of αPD1 + αGITR and induce tumor cell killing.
a Schematic representation of the experimental setup to evaluate the contributions of CD8 T cells and Treg cells to antitumor activity against GBM during αPD1 + αGITR treatment. Purified and sorted CD8 T cells (1 × 106), Treg cells (5 × 105), or both were transferred to Rag1−/− mice 2 days before intracranial inoculation with tumor cells (GL261-MGH or CT2A). bc GL261-MGH and CT2A bearing mice were treated with 6 doses of IgG2a or αPD1 + αGITR (250 μg/mouse for each antibody) and monitored for survival. [(GL261-MGH no cell: n = 5, IgG median survival of 27; αPD1 + αGITR, n = 5 median survival of 25], [(GL261-MGH CD8 T cells: IgG n = 5 median survival of 27; αPD1 + αGITR, n = 5 median survival of 25], [(GL261-MGH Treg cells: IgG n = 5 median survival of 25; αPD1 + αGITR, n = 6 median survival of 31], [(GL261-MGH CD8 + Treg cells: IgG n = 5 median survival of 26; αPD1 + αGITR, n = 5 median survival of 52]; [(CT2A no cell: n = 5, IgG median survival of 14; αPD1 + αGITR, n = 4 median survival of 17], [(CT2A CD8 + Treg cells: IgG n = 4 median survival of 15; αPD1 + αGITR, n = 4 median survival undefined]. Kaplan–Meier survival estimates were compared using the Mantel–Cox log-rank test as well as the Gehan–Breslow–Wilcoxon test. P values for tumor viability were calculated using unpaired t-tests. *p < 0.05, **p < 0.01. dh Treg cells and CD8 T cells were isolated from spleens of healthy donor mice (n = 6 per condition) or human peripheral blood mononuclear cells (pooled from n = 3 donors). df Murine GL261-MGH or CT2A or 005GSC (gh) human MGG4 or MGG8 tumor cells (1 × 103 cells) were co-cultured for 48 h with Treg cells, CD8 T cells, or both in ratios of 1:10. GLUC activity in the cell culture media was measured and used as a surrogate marker for tumor cell viability. Tumor cell viability was measured under treatment with IgG2a (isotype control) or αPD1 + αGITR. Data presented are mean ± SEM. p < 0.001 by ordinary one-way ANOVA test and were corrected for multiple comparisons using the Tukey adjustment. For between group analysis post-Tukey, stars were assigned as *p < 0.05, **p < 0.01, ***p < 0.001. The line in the middle of the box and whisker graph represents the median (50th percentile). The box extends from the 25 to 75th percentile. The whiskers extend from the lowest to the highest value. Source data are provided as a Source Data file.
Fig. 5
Fig. 5. MHC dependent recognition and IFNγ-mediated cytolysis are required for antitumor activity of reprogrammed Treg cells and re-activated CD8 T cells.
a Schematic representation of the experimental protocol. Mice bearing orthotopic GBM tumors (GL261-MGH, 005GSC or CT2A, size ~2 mm3) were treated with 4 doses of (i) IgG2a, (ii) αPD1, (iii) αGITR, or (iv) αGITR + αPD1 (250 µg/mice for each antibody), and tumor cells were analyzed for expression of MHCI and MHCII by FACS (n = 6). Histograms represent the expression level of each molecule after therapy. b Treg cells and CD8 T cells were sorted from spleens of healthy donor mice (n = 6 per condition). GL261-MGH, CT2A, or 005GSC tumor cells (1 × 103 cells) were co-cultured with both Treg cells and CD8 T cells at a 1:10 ratio for 48 h. GLUC activity in the cell culture media was measured and used as a surrogate marker for tumor cell viability. Tumor cell viability was measured under treatment with IgG2A (isotype control) or αPD1 + αGITR. Impact of the blockade of MHC Class I, MHC Class II, combined MHC Class I & II, and IFNγ on the efficacy of αPD1 + αGITR treatment was analyzed. Data presented are mean ± SEM. p < 0.001 by ordinary one-way ANOVA test and were corrected for multiple comparisons using the Tukey adjustment. For between group analysis post-Tukey, stars were assigned as *p < 0.05, **p < 0.01, ***p < 0.001. The line in the middle of the box and whisker graph represents the median (50th percentile). The box extends from the 25 to 75th percentile. The whiskers extend from the lowest to the highest value. c Evaluation of the contribution of T cell-derived IFNγ to tumor cell killing. GL261-MGH, CT2A or 005GSC tumor cells were co-cultured for 48 h with Treg cells and CD8 T cells at a ratio of 1 tumor cell to 5T cells, either in direct contact or indirect contact in separate chambers of a transwell plate. Tumor cell viability was measured by measuring GLUC activity in cell culture media as in (b) (n = 4 biological replicates for all treatments). Data presented are mean ± SEM. p < 0.001 (GL261-MGH and 005GSC) and p = 0.0004 (CT2A) for αPD1 + αGITR therapy by ordinary one-way ANOVA test and were corrected for multiple comparisons using the Tukey adjustment. Other treatments (IgG or αPD1 + αGITR + αIFNγ) by one-way ANOVA test were above 0.05 (insignificant). d Schematic of the experimental setup to evaluate the contribution of IFNγ to anti-tumor T cell activity in vivo. Mice bearing orthotopic GBM tumors (GL261-MGH or CT2A, size ~2 mm3) were treated with 6 doses of (i) αPD1 + αGITR, and (iv) αPD1 + αGITR + αIFNγ (250 μg/mouse). [(GL261-MGH: n = 7, IgG median survival of 15; αPD1 + αGITR n = 7 median survival of 31; and αPD1 + αGITR + αIFNγ n = 7, median survival of 20], [(CT2A: n = 14, IgG median survival of 14; αPD1 + αGITR n = 5 median survival of 28.5; and αPD1 + αGITR + αIFNγ n = 7, median survival of 12]. Kaplan–Meier survival estimates in (d) were compared using the Mantel–Cox log-rank test as well as the Gehan–Breslow–Wilcoxon test. *p < 0.05, **p < 0.01, ***p < 0.001. e Schematic representation of the identified mechanism: converted Treg cells and re-activated CD8 T cells post αPD1 + αGITR treatment cooperate in activity, produce IFNγ that induces MHC upregulation on tumor cells allowing for recognition and tumor cell killing. Source data are provided as a Source Data file.

Similar articles

Cited by

References

    1. Lim M, Xia Y, Bettegowda C, Weller M. Current state of immunotherapy for glioblastoma. Nat. Rev. Clin. Oncol. 2018;15:422–442. doi: 10.1038/s41571-018-0003-5. - DOI - PubMed
    1. Reardon DA, et al. Effect of Nivolumab vs Bevacizumab in Patients With Recurrent Glioblastoma: the CheckMate 143 Phase 3 Randomized Clinical Trial. JAMA Oncol. 2020;3:1003–1010. doi: 10.1001/jamaoncol.2020.1024. - DOI - PMC - PubMed
    1. Nayak L, et al. Randomized phase II and biomarker study of pembrolizumab plus bevacizumab versus pembrolizumab alone for recurrent glioblastoma patients. Clin. Cancer Res. 2020;27:1048–1057. doi: 10.1158/1078-0432.CCR-20-2500. - DOI - PMC - PubMed
    1. Cloughesy TF, et al. Neoadjuvant anti-PD-1 immunotherapy promotes a survival benefit with intratumoral and systemic immune responses in recurrent glioblastoma. Nat. Med. 2019;25:477–486. doi: 10.1038/s41591-018-0337-7. - DOI - PMC - PubMed
    1. Schalper KA, et al. Neoadjuvant nivolumab modifies the tumor immune microenvironment in resectable glioblastoma. Nat. Med. 2019;25:470–476. doi: 10.1038/s41591-018-0339-5. - DOI - PubMed

Publication types

MeSH terms

Substances